HAL Id: hal-00469863
https://hal.archives-ouvertes.fr/hal-00469863
Submitted on 26 Aug 2011
HAL is a multi-disciplinary open access
archive for the deposit and dissemination of
sci-entific research documents, whether they are
pub-lished or not. The documents may come from
teaching and research institutions in France or
abroad, or from public or private research centers.
L’archive ouverte pluridisciplinaire HAL, est
destinée au dépôt et à la diffusion de documents
scientifiques de niveau recherche, publiés ou non,
émanant des établissements d’enseignement et de
recherche français ou étrangers, des laboratoires
publics ou privés.
A color matching experiment using two displays: design
considerations and pilot test results
Abhijit Sarkar, Laurent Blondé, Patrick Le Callet, Florent Autrusseau,
Patrick Morvan, Jürgen Stauder
To cite this version:
Abhijit Sarkar, Laurent Blondé, Patrick Le Callet, Florent Autrusseau, Patrick Morvan, et al.. A
color matching experiment using two displays: design considerations and pilot test results. Fifth
European Conference on Color in Graphics, Imaging and Vision, CGIV, Jun 2010, Joensuu, Finland.
8-p. �hal-00469863�
A color matching experiment using two displays: design
considerations and pilot test results
Abhijit Sarkar*,**, Laurent Blondé*, Patrick Le Callet**, Florent Autrusseau**, Patrick Morvan*, Jürgen Stauder*; *Technicolor Research, Rennes (France); ** IRCCyN-IVC, Polytech Nantes, Nantes (France)
Abstract
Various recent studies have shown that observer variability can be a significant issue in modern display colorimetry, since narrow-band primaries are often used to achieve wider color gamuts. As far as industrial applications are concerned, past works on various aspects of observer variability and metamerism have mostly focused on cross-media color matching, an application context that is different from color matching on two displays, both in terms of human visual performance and the application requirements. In this paper, we report a set of three preliminary color matching experiments using a studio Cathode Ray Tube (CRT) display with broadband primaries, and a modern wide-color gamut Liquid Crystal Display (LCD) with narrow-band primaries, with and without surround. Two principal goals of these pilot tests are to validate the experimental protocol, and to obtain a first set of metameric data of display color matches under different viewing conditions. In this paper, various experimental design considerations leading to the current test setup are discussed, and the results from the pilot tests are presented. We confirm the validity of our test setup, and show that the average color matches predicted by the 1964 CIE 10° standard observer, although acceptable as average matches, can often be significantly and unacceptably different from individual observer color matches. The mean, maximum and the 90th
percentile values of the standard observer-predicted color difference of individual observer color matches were 1.4, 3.3 and 2.6 ∆E*00 respectively.
Introduction
When two color stimuli produce the same visual response, a visual match is obtained. Two stimuli with very different spectral power distribution can give rise to identical cone response, leading to a metameric match. However, such a match established by one observer can, and quite often does, lead to a mismatch for a different observer, as the second observer has a different set of color matching functions than the former. This phenomenon is commonly termed as observer metamerism.
The topic of observer metamerism has sparked renewed interest in the recent years with the proliferation of wide-gamut displays. Whether based on LED-backlight or employing laser primaries, all these displays compete with each other in achieving more vivid, more saturated and brighter colors. On the flipside, these displays are particularly susceptible to observer variability [1][2], since their peaky, narrow-band primaries cause noticeable shift in chromaticities of perceived colors with relatively minor change in the visual characteristics of the observer. This can be a nontrivial issue in critical color matching tasks, for example in post-production applications. Thus, it is of interest to study the effect of observer variability in color matching across traditional and modern displays, and to acquire
experimental data in such a context, which can be subsequently used to better model the observer variability.
There is another reason why such experiment is of high relevance for our current work. In 2006, CIE’s (Commission Internationale de l’Eclairage) technical committee TC 1-36 published a report [3] on the choice of a set of Color Matching Functions (CMF) and estimates of cone fundamentals for the color-normal observer. Based on a theoretical analysis, current authors recently showed [4] that the long-wave sensitive (x-) color matching function derived from the CIE 2006 model did not accurately predict the average Stiles-Burch observer data [5] for two subgroups in the age ranges of 22-23 and 49-50. It was also shown that the short-wave sensitive (z-) function of the 10° standard observer produced significant deviation with respect to the intra-group average observer for all three age groups studied, namely the age groups of 22-23, 27-29 and 49-50. In this case, CIE 2006 model prediction was closer to the real average observer data. A new set of color matching data will enable an indirect, nevertheless independent verification of the aforementioned observations, and will allow us to investigate their significance, if any, in the context of modern display colorimetry.
The preliminary set of color matching experiments described in this paper is part of our current study that investigates the effect of observer variability in comparing colors on a modern, wide-gamut display with narrow-band primaries, and a conventional display with broadband primaries (for example, a CRT display). The pilot tests were intended to validate our experimental protocol, while the final goal of our experiments is to obtain new color matching data in the context of modern display colorimetry. Nevertheless, our approach is guided by the fundamental principles of human color vision. Thus, our experimental paradigm is a hybrid version of classical color matching experiments and the experiments from applied studies. The test setup was carefully planned, and several experimental design choices were made. These are explained in this paper, and the results from the pilot tests are analyzed.
Background
Fifty years ago from the time of writing this paper, Stiles and Burch conducted the most comprehensive, and arguably the most authoritative large-field color matching experiment [5] till date, which eventually led to the 1964 CIE 10° standard observer functions. Since then, and even earlier, numerous researchers have conducted color matching experiments with a variety of experimental setups and goals [6] (page 288), full review of which is beyond the scope of this paper. Here, we focus on some of the past research works that were highly relevant for advanced applied colorimetry. The reader must bear in mind however, that there also exists a vast amount of literature dealing with more classical color vision studies.
In a seminal work, Thornton [7] performed several 10° color matching experiments with his visual colorimeter-spectroradiometer instrument, using disparate sets of spectral
primaries. Among some other highly consequential inferences, he found “…the mathematical constructs we know as the CIE Standard Observers, while they have been vastly helpful during their long tenure, when used in the computation either of perceived brightness or of matching condition of two lights, often result in an approximation that is visually unacceptable”. A motivation of the current work is to verify this observation in the context of modern display colorimetry.
Soon after Thornton’s study, North and Fairchild [8] came up with an innovative experimental setup for color matching, where the observers mixed a tungsten light source filtered by interference filters and the primaries of a CRT, in order to match a diffuse tungsten-halogen source simulating daylight. This was a Maxwell-type [6] (page 293) color matching in a 2° bipartite field. Color matching data collected using this instrument was used to assess observer variability. The authors showed [9] that the CIE recommendations on observer metamerism, also known as the CIE Standard Deviate Observer [10] resulted in a prediction of the order of variability within a single observer, while the variability between different observers was significantly larger.
Several years later, Alfvin and Fairchild [11] performed a color matching experiment where observers made matches between different colors presented in reflective and transmissive color reproduction media and on a broadband display. They found that inter-observer variability was twice as large as intra-observer variability, and was significantly under-predicted by the CIE Standard Deviate Observer [10]. In contrast with Thornton’s observation, they concluded that the existing CIE Standard Colorimetric Observers were a good representation of the population of normal trichromats.
In another significant study on cross-media color reproduction, Oicherman et al. [12] performed a color matching experiment using spatially separated computer display and surface color stimuli, in an experimental setup that attempted to replicate real-life industrial setting for a color matching task. One of the most significant conclusions was that the variability of matches between spatially separated stimuli cannot be predicted by the variability of individual color matching functions. The authors suggested that in the context of asymmetric cross-media color matching, observer variability could be better modeled by an optimized color difference equation.
The experiments described in this paper deal with matching colors presented on a display with broadband primaries and a
second display with narrow-band primaries. This application context is different from cross-media color reproduction, both in terms of human visual performance and the application requirements.
Experimental Method
The setup
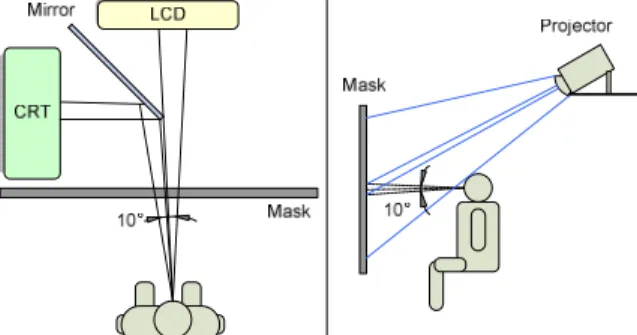
Two displays were used in this experiment. The first was a 32” Sony BVM Cathode Ray Tube (CRT) display widely used as a studio reference display, and the second was an HP Dreamcolor (LP2480zx) Wide-Gamut Liquid Crystal Display (LCD) with LED backlight. For both displays, the luminance of the full white was set close to 97 cd/m2. Spectral power distributions of the two displays are shown in fig 1. There is a significant difference in the spectral characteristics between the two displays, so, a color match made on the two displays is highly metameric in nature. This justifies the choice of these two displays for our observer variability study. The LCD is representative of modern wide-gamut displays with peaky primaries. The CRT has a 10-bit HD/SDI input and the LCD has an 8-bit DVI input. The two displays were controlled independently through a specially-designed hardware, integrated with the software specially developed for our color matching experiments.
The displays were placed perpendicular to each other, as shown in fig 2. A front-surface reflection mirror was placed in front of the CRT at 45° to the observer’s line-of-sight, which was perpendicular to the LCD screen to avoid the directionality issue of the LCD. The observer’s visual field consisted of a 10° bipartite field, the right half of which was the LCD screen, and the left half was the CRT screen, seen through the mirror. A mask was placed between the observer and the displays to block the view of the displays and the mirror, allowing the observer to see only two solid self-luminous color patches on two sides of the field when looking at the mask normally. The mirror also blocked lights from the CRT to fall on the LCD screen. The distance between the observer and the mask was 69.2 cm (2.27 ft), and that between the mask and the LCD screen was 68 cm (2.23 ft).
The width of the mirror formed a 0.02° black field separation at the observer’s eyes. Luminance discrimination is best when the two half fields are precisely juxtaposed. By introducing the field separation, red-green chromatic discriminations remain the same, but discrimination based on differential short-wavelength sensitive cone excitation improves [13] (p 136). The effect of the separation introduced by the
Figure 1. Spectral Power Distribution of the CRT and the LCD
used in the experiments
mirror edge on the color matching was outside the scope of current study.
The displays were characterized before the experiment. The display Lookup-Tables (LUTs) thus obtained were used to determine the initial RGB digital counts that would result in specific chromaticities on the displays. However, during the adjustment of the CRT color by the observer, a simple linear transform from XYZ to RGB was preferred over the display LUT, as this allowed the observer to have a better control over the adjustment in a linear scale. The mirror was included in the characterization of the CRT, to account for any spectral absorption or transmission by the mirror surface. At the beginning of each session, the luminance of the full-white of both displays was measured to ensure that they were close. While both displays were found to be quite stable in terms of full white luminance, radiometric data for both displays were collected after each color match (except for the first pilot test, as explained later). Thus, the experimental results were independent of the stability of display characterization, or of the assumption of the validity of the display additivity and proportionality. For the measurement, a spectroradiometer was placed directly behind the observer at the eye level, and two displays were measured in succession. The spectroradiometer PhotoResearch PR-670 used in this work was factory-calibrated three months before the experiment with a NIST traceable light source. The luminance as well as radiometric uncertainty relative to NIST was ±2% and spectral wavelength uncertainty was less than ±2 nm.
Observer task
The observer was asked to adjust the color on the left half of the bipartite field (matching field) to match the color on the right half (test field). The observers were aware that they were matching colors on two displays. Since the CRT had a 10-bit channel resolution (i.e. 1024 levels of R, G and B luminance), it was chosen as the matching field, and the LCD was used as the test field. Thus, the color matching task was a quasi-symmetric matching procedure.
However, at this point, several experimental design issues were encountered.
Which parameters to adjust?
Several possibilities for adjustment of the colors were explored. Adjustment in chroma, hue and lightness was found to be more intuitive and was preferred over the direct RGB channel adjustment, or the adjustment of opponent colors (redness-greenness and yellowness-blueness), as has been done in previous works using the CIELAB color space [11][10][12]. In our work, we used the IPT color space, which is perceptually more uniform than CIELAB, particularly in the blue region of the color space [14]. The color in the test field could be adjusted in three dimensions of
chroma, hue and
lightness, derived in the IPT color space.
To make the color matching task less daunting for the observer, the starting
color in the matching field (CRT) was set to hue and lightness values of the test field (LCD) as predicted by display characterization (except for the first pilot test, as explained later). However the initial matching field chroma was randomly varied between 75% and 90% of the test field chroma. This was done because preliminary tests revealed that for observers unfamiliar with color, the task of matching was more difficult when both hue and chroma were completely different in the two fields. However, the observers generally made an adjustment in all three dimensions, which was expected since a display characterization is essentially based on an average, standard observer data (in this case, 1964 10° CIE standard observer) and does not conform to individual observer characteristics. In addition to setting the initial color, the ranges in all three dimensions were restricted to prevent the observer from deviating too far from the region where a match could be located. For example, the hue angle range was set to ±30° of the initial value.
How to adjust?
A ShuttleXpress® multimedia control by Contour Design was used in this experiment for color adjustment. This control has five buttons, one wheel and a jog, which were programmed to specific functionalities (fig 3), and was connected to the computer through USB interface. The Chroma/Hue/Lightness button allowed switching from one dimension to the other by subsequent pressing. The jog and the shuttle allowed changing the value of the current dimension. Two additional features that were found to be quite helpful in better executing the color matching task were also implemented. The first was a Save-Undo feature that allowed the observer to temporarily save the matching field color before adjusting it further to refine the match, and to go back to the saved version if needed. The second feature was a Reset functionality, which allowed the observer to go back to the initial setting of the current dimension (Chroma/Hue/Lightness) if encountered with the difficulty in getting closer to a match. The Commit button confirmed observer’s match and saved the current device RGBs and IPT values for both fields. Radiometric measurements were launched by a separate command once the match was confirmed.
To fixate or not to fixate?
No head restraint was used in the experiment. White adapting stimuli were presented in both fields for a couple of seconds before launching a new trial. During the course of the trial, the observer was encouraged to move his/her head sideways from time to time, or to look away, in order to reduce the effect of local adaptation. When test and matching field luminance is greater than the surround, adaptation to the bipartite field is likely. The effect of this adaptation is to reduce the perceived difference between the two halves of the bipartite field after viewing them for several seconds. Another way to avoid the adaptation to the bipartite field stimuli is to present the fields for a small percent (e.g. 20%) of the duty cycle, and replace them by the surround chromaticity for the rest of the time [15]. However, this method is more cumbersome and time-consuming, and may cause annoyance to the observer.
The other issue occasionally encountered by the observers was a halo effect, wherein the peripheral part of the bipartite field appeared to be lighter than the rest of the field. This was likely due to simultaneous contrast induced at the border of the field when dark surround was used. Sideways movement of the head or looking away from the field for a couple of seconds
Figure 3. User control for adjusting the
significantly helped in reducing both adaptation and contrast effects. However, it must be emphasized that the final match was always made while focusing on the bipartite field, and not through peripheral vision.
For some stimuli, a color inhomogeneity in the center of the field, commonly known as the Maxwell spot, was noticed by some observers. This is a well-documented effect of higher density of macular pigment in the central fovea [6] (p 133). The observers were asked to ignore this non-uniformity.
What about adaptation and surround?
The surround serves to maintain a reasonably steady-state of adaptation for the observer [13] (p 137). Note that the term adaptation here refers to the luminance adaptation and not the chromatic adaptation. The effect of a chromatic surround on color matching was outside the scope of current study. To study the effect of adaptation on display color matches, observers were asked to perform color matching in two separate preliminary tests, one in dark surround and the other with an achromatic surround with roughly uniform luminance. For the surround test, a diffuse white mask was used instead of a black mask. A projector (Optoma EP747 with DLP™ technology) placed behind the observer overhead was used to uniformly illuminate the mask. A black circle in the middle of the projected image overlapped with the 10° bipartite field on the mask, so that light from the projector passing through the hole could be minimized. The projector was carefully positioned such that the observer’s head did not cast a shadow on the mask, and the small amount of light passing through the hole fell on the black cover on the table in front of the displays, and not on the mirror or the displays themselves. The luminance of the surround was 15 cd/m² in the middle, and had a horizontal fall-off of about 10% on the far end of both sides. The correlated color temperature of the surround was close to 7400K. The 102cm x 60cm surround formed an angle of 73° horizontally and 47° vertically in the observer’s eyes.
Table 1 lists the full-white chromaticities, luminance values and the Correlated Color Temperatures (CCTs) of CRT, LCD and the projector as measured by the spectroradiometer. Table 1. Chromaticities, luminance values and Correlated Color Temperatures of the two displays and the projector
CRT LCD Projector
x 0.3074 0.306 0.2958
y 0.3255 0.3245 0.3359
Y(cd/m²) 96.04 96.69 14.98
CCT (K) 6828 6919 7363
Selection of test stimuli
The basis of stimuli selection in the current work differs from previous studies with similar experimental setups, where either the primary or secondary colors were selected as stimuli [11][10], or the color space was sampled in equal hue angle steps [12]. Such choices are useful in comparing observer variability in color matching in different regions of the color space. However, they do not have a physiological basis, and do not consider how the stimuli may affect the long-, medium- and short- wavelength sensitive cone excitations (hereafter referred to as L-, M- and S- respectively), which is an issue of fundamental importance in color matching. Since a major goal of the current study is to evaluate the merits of various color matching functions and cone fundamentals in the context of
modern display colorimetry, it was of interest to select the test stimuli for the experiments in such a way that they varied along physiologically significant axes. Thus, MacLeod-Boynton chromaticity diagram [16] was used for specifying the chromaticity coordinates of nine test stimuli. In this diagram, the cone spectral sensitivities form rectangular axes in a constant luminance plane. The abscissa represents the equal and opposite change in L- and M-cone excitations (such that the sum is unity), and the ordinate represents the level of S-cone excitation. It is possible to derive the MacLeod-Boynton chromaticity coordinates from Stockman-Sharpe 10° cone fundamentals [17], on which much of our current work [4] and CIE 2006 cone fundamentals [3] are based. However, transforming MacLeod-Boynton chromaticities of a test stimulus into 10° XYZ tristimulus values is not straightforward. This transformation, described elsewhere [13] (page 118), is relatively simple using MacLeod-Boynton chromaticities based on Smith-Pokorny 2° cone fundamentals [18], since L- and M- are appropriately scaled so that (L+M) gives luminous efficiency function Y. However, the xy chromaticity values so obtained correspond to 1951 Judd modified CIE 2° observer. Thus, the Judd-revised observer was used to perform display characterization computations and to derive the RGB digital counts for both displays that would result in the specific MacLeod-Boynton chromaticities. We assume the chromaticities obtained with Stockman-Sharpe 10° cone fundamentals would not have been drastically different. Note that, with the exception of stimuli selection, 1964 CIE 10° standard observer was used for all colorimetric computations.
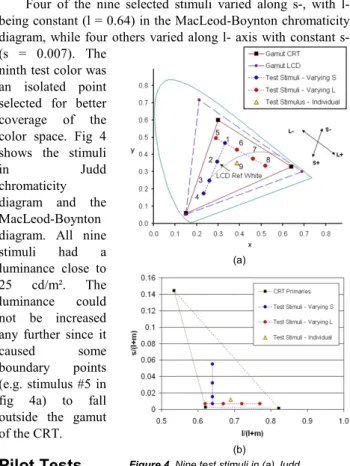
Four of the nine selected stimuli varied along s-, with l- being constant (l = 0.64) in the MacLeod-Boynton chromaticity diagram, while four others varied along l- axis with constant s- (s = 0.007). The
ninth test color was an isolated point selected for better coverage of the color space. Fig 4 shows the stimuli
in Judd
chromaticity diagram and the MacLeod-Boynton diagram. All nine stimuli had a luminance close to 25 cd/m². The luminance could not be increased any further since it
caused some
boundary points (e.g. stimulus #5 in fig 4a) to fall outside the gamut of the CRT.
Pilot Tests
Three pilot
tests were
conducted. All tests were conducted in a dark room, with
(a)
(b)
Figure 4. Nine test stimuli in (a) Judd
chromaticity diagram, and (b) MacLeod-Boynton chromaticity diagram based on Smith-Pokorny 2° cone fundamentals (shown in part)
all visible surfaces being covered by black paper/cloth. In each test, there were nine test stimuli as described before, and each observer performed three repetitions. Thus, there were 27 trials in each test. Each repetition lasted 45 min – 1 hour, between which, and between two consecutive matches, the observers took a break for several minutes. Each observer participated in the three tests within a span of two weeks.
Specific details of the three pilot tests follow.
Pilot Test 1
In this test, only the LCD was used for color matching. A window with two rectangles separated by a thin black strip filled the full screen of the LCD. The right rectangle formed the test field, and the left rectangle, whose color could be adjusted by the observer, formed the matching field. When seen through the 10° mask, the visual appearance of the 10° bipartite field was exactly the same as in case of the tests involving two displays. The test was performed in the dark surround condition. The observer task was the same as described before. This pilot test served two purposes. First, since the match was made on the same display, the test could be used for short-listing observers for the final experiment, since the results would give an idea about a given observer’s discrimination threshold, and intra-observer variability. Second, comparing the results of intra- and inter-observer variability, the
validity of the
experimental protocol could be ascertained.
For example, if for majority of the observers,
the intra-observer
variability is more than the inter-observer variability, this would mean the experimental setup is not suitable for acquiring color matching data, as the uncertainty of observer color matches would not be within acceptable range. On the other hand, if the intra-observer variability is high only for a limited number of observers, we can conclude that these observers are not adept at using the experimental tool for obtaining color matches with adequate certainty, either because of their higher chromatic discrimination threshold, or because of their unfamiliarity with the color matching task. This test offers an advantage over the previous studies [8][11][12], in which it was not easy to ascertain whether and to what extent intra-observer variability was influenced by the method of color matching itself.
Unlike the other two pilot tests, the initial lightness, chroma and hue values of the matching field were randomly set to values
significantly different from those of the test field. Also, when a match was confirmed by the observers, the lightness, chroma and hue control settings were recorded, but the spectral measurement was not performed, unlike in the other two tests.
Pilot Test 2
This test was performed using the two displays as discussed before, in the dark surround conditions. No light source other than the bipartite field was present.
Pilot Test 3
This test was conducted with white surround condition, as described under experimental method. Comparing the results of pilot test 3 with those of pilot test 2 would enable us to assess the potential role of steady-state, luminance adaptation on display color matches. This is of interest since in practical, real-life situation, the display viewing condition generally includes a lit surround.
Ten observers participated in each of the three pilot tests. The observers were in the age range of 30 – 50, and all were color normal, as confirmed by Ishihara pseudo-isochromatic plates and a Farnsworth-Munsell 100 hue test.
Results and Discussion
Intra- and inter- observer variability
As explained before, a comparison of the intra- and inter-observer variability in the data from Pilot Test 1 (single display – dark surround) will indicate the suitability of our experimental setup for conducting color matching experiments. The intra-observer variability refers to the deviations in matches for a given test color made by a single observer during different trials, whereas the inter-observer variability refers to the deviations in mean observer matches (averaged over several repetitions) for a given test color from one observer to the other. To determine the intra- and inter-observer variability in the Pilot Test 1 data, the root-mean-square (RMS) errors were computed for the color matches in the lightness, chroma and hue dimensions in the IPT space. These were the original dimensions adjusted by the observers. The display used in this experiment was stable enough to let us assume the test colors presented to the observers were approximately constant across different sessions. This issue is further clarified afterward.
For computing the intra- observer variability, first the RMS values of the differences of all match repetitions by a given observer from the mean match are obtained for each test stimulus. The mean of these RMS values over all observers gives the intra-observer RMS error. Similarly for inter- observer variability, RMS errors are computed between the mean of all observer color matches for each test stimulus, and the mean of each observer matches is computed over all repetitions. Fig 5 shows the plots of intra- and inter-observer variability in three color space dimensions. On an average, both intra- and inter-observer RMS errors are low. Mean intra-inter-observer RMS errors were 1.4% in lightness, 3.3% in chroma and 1.3% in hue, averaged over all test colors. For mean inter-observer RMS error, these values were 2.2%, 4.5% and 1.3% respectively. At such low error levels, the experimental uncertainty plays a role, which is manifested in intra-observer variability being slightly higher than inter-observer variability in some cases, particularly since the number of observers is not large. We can expect that in case of Pilot Test 1, the uncertainty of color matches contributed
Figure 5. Results from Pilot Test 1
(single display): mean intra- and inter-observer RMS errors in lightness, chroma and hue, computed in IPT color space
by the experimental setup itself does not exceed the mean intra-observer RMS errors.
However, test color #4 has higher inter-observer variability in lightness and chroma, which confirms the conclusion of our previous study [4] that the cyan/blue region is particularly susceptible to observer variability. We have shown that the variability in various physiological factors, namely macular pigment absorption and ocular media absorption, affects the blue perception the most, and the effect is rather significant in displays with narrow-band primaries [19]. Interestingly, this variability is reflected here in the lightness and chroma, and not in the hue.
The hue in case of test color #2, which was an achromatic color close to the LCD white point, shows relatively high intra- (4.9°) and inter-observer (3.8°) RMS errors in hue. However, for five out of ten observers, the mean intra-observer RMS error was only 2.7, indicating that the high error resulted from individual observer uncertainty in matching achromatic colors, and was not caused by the experimental setup itself.
Overall, the results from Pilot Test 1 indicate that all observers were able to adjust the matching field to get satisfactorily close to the test field color. All observers expressed satisfaction over their matches, and over the method of adjustment. Thus, we conclude that the experimental protocol is suitable for acquiring valid metameric color matching data.
The intra- and inter-observer variability was also determined for the Pilot Test 2 (two displays – dark surround) and Pilot Test 3 (two displays – white surround). In both cases, measured spectral power distributions of the matching field for each observer match were used. Note that in this case, we do not compare the LCD and CRT colors, but rather inspect the variability in the CRT color matches, assuming the test colors on the LCD stayed approximately constant during the experiment. Average color difference on the LCD side across all trials was less than 0.1 ∆E*00 (CIE 2000 advanced color difference metric
[20]), so the assumption is acceptable. From the spectral data, XYZ tristimulus values and CIELAB coordinates were calculated using the 1964 CIE 10° standard observer and display white points. Mean Color Difference from the Mean (MCDM) [21] was computed across three repetitions for each observer in case of intra- observer variability, and across the mean matches of all observers in case of inter- observer variability.
Table 2. Mean Color Differences from the Mean (MCDM) for intra- and inter-observer data from Pilot Test 2 (dark surround) and Pilot Test 3 (with white surround)
Stimulus ID
Pilot Test 2 Pilot Test 3
Intra- Inter- Intra- Inter-
1 0.61 0.93 0.53 1.16 2 0.68 1.48 0.55 1.67 3 0.60 1.02 0.51 0.99 4 0.63 1.01 0.48 0.85 5 0.58 0.79 0.53 0.98 6 0.58 1.48 0.44 1.30 7 0.51 0.99 0.39 0.90 8 0.47 0.75 0.46 0.53 9 0.94 1.36 0.53 1.26
Table 2 lists the MCDM values for all nine stimuli, for both tests, calculated based on ∆E*00. As expected, inter-observer
variability is more than the intra-observer variability. The average difference between the two quantities is 0.47 ∆E*00 for
the Pilot Test 2, and 0.58 ∆E*00 for the Pilot Test 3. The
surround has the effect of a steady-state adaptation during the color matching. Intra-observer variability slightly reduced on the introduction of a surround, but the effect on the inter-observer variability is less apparent. The average reduction is 0.13 ∆E*00
for the intra-observer variability, and 0.02 ∆E*00 for the
inter-observer variability. Overall, no strong effect of surround on the observer color matches was observed.
Color match prediction error with CIE 10° standard observer
Two different methods were used to compare CIE 10° standard observer predictions with individual color matches. In the first method, display characterization data were used to predict a CRT color match of the LCD test color. For each trial, XYZ tristimulus values were computed from the spectral data of the LCD test colors, using CIE 10° standard observer. The XYZ values were averaged over all repetitions for a given observer. These are the XYZ values to be reproduced on the CRT. The CRT inverse model predicted the digital counts that would generate similar XYZ values. For better accuracy, the CRT forward model was then used to compute the XYZ values that could actually be reproduced on the CRT. Thus, these XYZ values corresponded to a “standard observer” color match on the CRT, as predicted by the 10° standard observer. XYZ values were also computed from the spectral data of the observer color matches on the CRT. These two sets of XYZ values were converted to CIELAB, and ∆E*00 color difference values were
computed. The second and third columns of Table 3 list the 90th percentile of these ∆E*00 values between the predicted and
actual observer matches on the CRT side for each of the nine stimulus, averaged over all observers.
The second method was more straightforward. As before, XYZ values were computed from the spectral data for both the LCD test colors and the CRT matching colors, using CIE 10° standard observer. For each observer, the XYZ values over all repetitions were averaged, and then were converted to CIELAB values. Finally, ∆E*00 color difference between these two sets of
CIELAB values were computed. These ∆E*00 values signify the
differences perceived by a “standard observer” between the LCD and CRT colors, while in reality they were satisfactory matches for individual observers. The last two columns of Table 3 list the 90th percentile of these ∆E*
00 values.
Table 3. 90th percentile color difference (∆E*00) values computed between i) the CIE 10° standard observer predicted matches and observer color matches on the CRT side, and ii) the test colors on LCD and observer matches on CRT
Stimulus ID
Prediction and Observer Matches (on
CRT) Observer Matches (LCD and CRT) Pilot Test 2 Pilot Test 3 Pilot Test 2 Pilot Test 3 1 2.36 3.00 2.05 2.81 2 3.21 3.15 2.81 3.08 3 2.17 2.12 2.20 2.50 4 2.87 2.59 3.16 3.07 5 2.30 2.40 2.16 2.36 6 3.62 3.45 3.26 2.89 7 1.70 1.73 1.63 1.75 8 1.38 1.01 1.42 1.23 9 3.25 2.36 2.82 2.36
∆E*00 values corresponding to the CIE 10° standard
observer predictions and observer color matches on the CRT are generally higher than the ∆E*00 values corresponding to
observer matches on LCD and CRT. This is not surprising since the former is affected by the computational approximations of display modeling, and is dependent on the assumptions of display additivity and proportionality.
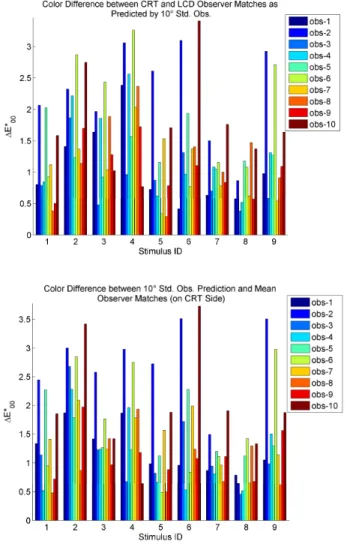
Fig 6 plots the ∆E*00 color difference values corresponding
to individual observer matches on LCD and CRT, and the predicted and real observer color matches on the CRT side, both for pilot test 2. From the data in Table 3 and the plots in fig 6, it is clear that for some observers, some of the colors on the two displays that match for individual observers are predicted by the CIE 10° standard observer as having a significant color difference, and similarly, the colors that are predicted by the standard observer to be a match when shown on the two displays are sometimes unacceptable to individual observers. This discrepancy is the highest for the test color #2 and #4, an achromatic color and a saturated blue respectively (Table 3). In case of Pilot Test 2, the mean, maximum and the 90th percentile ∆E*00 values between individual observer matches on LCD and
CRT, across all stimuli and all observers, are 1.4, 3.4 and 2.6 respectively (1.4, 3.5 and 2.7 respectively for Pilot Test 3).
The significance of the ∆E*00 values depends on the
context, viewing conditions and the observer. While the values
reported here are possibly low for complex images and surrounds, for a carefully designed experimental setup such as ours, where uniform color stimuli are matched by experienced observers under controlled viewing conditions, a ∆E*00 color
difference much larger than 1.0 is likely to be perceptible. An average color match prediction error of 1.4 ∆E*00 over all colors
and all observers is still acceptable, confirming that the 10° standard observer is a reasonably good representation of an average observer. However, the maximum and the 90th
percentile ∆E*00 values between individual observer matches
predicted by the 10° standard observer are rather high (above 2.5 ∆E*00). This indicates that for some colors, color match
prediction by an average observer results in significant color match errors for many individual observers. In color critical applications involving modern displays, expert observers will likely find such differences unacceptable. The degree of the prediction error is dependent on the spectral characteristics of the display, and also on the observer-specific color matching functions. Based on our preliminary results, the problem seems to be nontrivial.
Conclusions
An experimental setup for conducting color matching experiments has been developed using a studio Cathode Ray Tube (CRT) display with broadband primaries, and a modern wide-color gamut Liquid Crystal Display (LCD) with narrow-band primaries. While the context of the current study is modern display colorimetry, experimental design choices were influenced by various aspects of classical color matching experiments. The design choices leading to the current experimental setup, the selection of the test stimuli, the viewing conditions etc are clarified in this paper. The suitability of the test setup in acquiring valid metameric color matching data is established through a pilot test. The mean intra-observer root-mean-square (RMS) errors, which in this case is also a metric of the uncertainty of color matches contributed by the test setup itself, were no more than 2.2% in lightness, 4.5% in chroma and 1.3% in hue dimension.
CRT color matches of LCD test colors predicted by the CIE 10° standard observer were acceptable as an average of observer matches, but were significantly different from color matches of some of the individual observers. Likewise, the standard observer predicted high color differences for some individual observer matches. The mean, maximum and the 90th percentile values of the standard observer-predicted color difference of individual observer color matches were close to 1.4, 3.3 and 2.6 ∆E*00 respectively, both for dark and white surround conditions.
In the context of modern display colorimetry, when colors are compared on two displays with very different spectral power distributions, using the CIE 10° standard observer in the computation can lead to a highly unacceptable color match for some color normal observers. We have encountered this problem repeatedly during the course of this study, when color matches made by one observer, and confirmed as satisfactory matches, were rejected by some of the other observers as unacceptable, and vice versa. This issue of observer metamerism is once again emphasized by our preliminary results. We hope to confirm this observation conclusively with our final experiment.
Based on the pilot test results, the test setup will be further refined, and then the final phase of our experiments will commence.
Figure 6. ∆E*00 Color difference between CRT and LCD observer matches
as predicted by 10° Standard Observer (top), and between CRT observer matches and corresponding CRT match predictions by 10° Standard Observer (bottom), both for Pilot Test 2
References
[1] M. D. Fairchild and D. R. Wyble, Mean Observer Metamerism and the Selection of Display Primaries, Final Program and
Proceedings-IS&T/SID Color Imaging Conference, pg. 151-156, Albuquerque, NM, USA (2007).
[2] R. Ramanath, “Minimizing Observer Metamerism in Display System”, Color Res. & Appl., 34(5): pg. 391-398 (2009). [3] CIE, Fundamental Chromaticity Diagram with Physiological Axes
– Part I, CIE Technical Report, 170-1:2006, (2006).
[4] A. Sarkar, L. Blondé, P. Le Callet, F. Autrusseau, J. Stauder, P. Morvan, Study of Observer Variability on Modern Display Colorimetry: Comparison of CIE 2006 Model and 10° Standard
Observer, Final Program and Proceedings, The 11th Congress of
the International Colour Association (AIC) 2009, Sydney, Australia (2009)
[5] W.S. Stiles and J.M. Burch, “N.P.L. colour-matching
investigation: final report”, Optica Acta, Vol. 6, pp 1-26 (1959). [6] G. Wyszecki and W.S. Stiles, Color Science, Concepts and
Methods, Quantitative Data and Formulae, New York: Wiley, 1982.
[7] W.A. Thornton, “Toward a more accurate and extensible colorimetry. Part I. Introduction. The visual
colorimeter-spectroradiometer. Experimental results”, Color Res & Appl 17(2), pg. 79-122 (1992).
[8] A.D. North, M.D. Fairchild, “Measuring color-matching functions. Part I”, Color Res & Appl., 18(3), pg. 155-162 (1993).
[9] A.D. North, M.D. Fairchild, “Measuring color-matching functions. Part II. New data for assessing observer metamerism”, Color Res & Appl., 18(3), pg. 163-170 (1993)
[10] CIE, “Special Metamerism Index: change in Observer”, CIE Publ. No. 80, Central Bureau of the CIE, Vienna (1989)
[11] R. L. Alfvin and M. D. Fairchild, “Observer Variability in Metameric Color Matches Using Color Reproduction Media”, Color Res. & Appl., 22(3): pg. 174-188 (1997).
[12] B. Oicherman, M. R. Luo, B. Rigg, and A. R. Robertson, “Effect of Observer Metamerism on Colour Matching of Display and Surface Colours”, Color Res. & Appl., 33(5): pg. 346 – 359 (2008).
[13] S.K. Shevell, The Science of Color, 2nd Ed., (Elsevier Science, 2003)
[14] F. Ebner and M.D. Fairchild, Development and Testing of a Color Space (IPT) with Improved Hue Uniformity, Proceedings of the Color Imaging Conference: Color Science, Systems, and Applications, pg. 8-13 (1998)
[15] C.J. Bartleson, Threshold and Matching, in Optical Radiation Measurement, (Academic Press, Orlando, FL 1984), Vol 5: Visual Measurements, Chapter 7, pg. 409
[16] D.I.A. MacLeod, and R.M. Boynton, “Chromaticity Diagram Showing Cone Excitation by Stimuli of Equal Luminance”, Jour. Opt. Soc. A., 69, pp.1183–5. (1979)
[17] A. Stockman and L.T. Sharpe, “The Spectral Sensitivities Of The Middle- and Long- Wavelength-Sensitive Cones Derived from Measurements in Observers of Known Genotype”, Vision Research, Vol. 40, pp. 1711-1737 (2000).
[18] V. C. Smith and J. Pokorny, "Spectral Sensitivity of the Foveal Cone Photopigments between 400 and 500 nm," Vision Res. 15, 161-171 (1975).
[19] A. Sarkar, L. Blondé, P. Le Callet, F. Autrusseau, J. Stauder, P. Morvan, Study of Observer Variability on Modern Display Colorimetry: An Analysis of CIE 2006 Model, Final Program and
Proceedings, The 11th Congress of the International Colour
Association (AIC) 2009, Sydney, Australia (2009)
[20] M.R. Luo, G. Cui, B. Rigg, “The development of the CIE 2000 color-difference formula: CIEDE2000”, Color Res. & Appl., 26: pg. 340-350 (2001).
[21] R.S. Berns, Billmeyer and Saltzman’s principles of color technology, (Willy, New York, USA, 2000), pg. 97
Acknowledgment
We gratefully acknowledge our colleague Jean-Jacques Sacré for his help and guidance in preparing the experimental setup. Thanks are also due to all our observers for their valuable time and active cooperation in executing these laborious color matching experiments.
Author Biography
Abhijit Sarkar received his bachelor’s degree in electrical engineering from India, and two MS degrees specializing in lighting and color science, from the Pennsylvania State University, USA and the Rochester Institute of Technology, USA, respectively. He is currently a PhD student at Technicolor Research, Rennes, France, and is affiliated to the Ecole polytechnique de l’université de Nantes, France. His research interests include digital color imaging, color vision and perception.
Laurent Blondé is graduate engineer of the Institut d’Optique – ParisTech (1985) and is currently a Principal Scientist at Technicolor Research. He was involved in several Thomson/Technicolor R&D projects including: Infrared Image Synthesis, Special Effects and Virtual Studio, Display processing, Anti-Camcorder and Color Management for Cinema applications. His research interests involve all domains of image processing for the media industry, with physics and perception in mind.
Patrick Le Callet is a Professor at the Ecole polytechnique de l’université de Nantes and heads the Image and Video Communication lab at CNRS-IRCCyN, a group of more than 35 researchers. His research activities encompass human vision modeling in image and video processing, including image and video quality assessment, watermarking techniques and visual attention modeling and applications. He is an author/co-author of more than 140 publications and a co-inventor of 7 international patents.
Florent Autrusseau is a research engineer at the Ecole polytechnique de l’université de Nantes, where he received his PhD degree in Computer Science and Image processing in 2002. His
research interests include digital watermarking, quality assessment,
image coding, color perception, Image analysis.
Patrick Morvan received his Electronic Engineering diploma from Polytech' Nantes (France) in 1989. Since then he has worked in Thomson/Technicolor Research Labs in Rennes. His work is now focused on color management topics for the moving picture industry.
Jürgen Stauder received his PhD degree in computer vision from the University of Hannover, Germany in 1999. He is currently a Principal Scientist at Thomson/Technicolor Research Labs in Rennes and a guest lecturer at the University of Rennes for applied color science. His research interests include computer vision, color science, and computer graphics as applied to content production and color management.