Publisher’s version / Version de l'éditeur:
Engineering Journal, 38, pp. 3-6, 1995-03-01
READ THESE TERMS AND CONDITIONS CAREFULLY BEFORE USING THIS WEBSITE. https://nrc-publications.canada.ca/eng/copyright
Vous avez des questions? Nous pouvons vous aider. Pour communiquer directement avec un auteur, consultez la
première page de la revue dans laquelle son article a été publié afin de trouver ses coordonnées. Si vous n’arrivez pas à les repérer, communiquez avec nous à [email protected].
Questions? Contact the NRC Publications Archive team at
[email protected]. If you wish to email the authors directly, please see the first page of the publication for their contact information.
NRC Publications Archive
Archives des publications du CNRC
This publication could be one of several versions: author’s original, accepted manuscript or the publisher’s version. / La version de cette publication peut être l’une des suivantes : la version prépublication de l’auteur, la version acceptée du manuscrit ou la version de l’éditeur.
Access and use of this website and the material on it are subject to the Terms and Conditions set forth at
A method of computing maximum snow loads
Thomas, M. K.
https://publications-cnrc.canada.ca/fra/droits
L’accès à ce site Web et l’utilisation de son contenu sont assujettis aux conditions présentées dans le site LISEZ CES CONDITIONS ATTENTIVEMENT AVANT D’UTILISER CE SITE WEB.
NRC Publications Record / Notice d'Archives des publications de CNRC:
https://nrc-publications.canada.ca/eng/view/object/?id=d467d983-670e-4caa-ae0b-6de7b4f22a63 https://publications-cnrc.canada.ca/fra/voir/objet/?id=d467d983-670e-4caa-ae0b-6de7b4f22a63
N A T I O N A L R E S E A R C H C O U N C I L
C A N A D A
A METHOD OF COMPUTING MAXIMUM
SNOW LOADS
M.
K.
Thomas
Meteorological Division, Department of Transport
RESEARCH PAPER No. 15
OF THE
DIVISION OF BUILDING RESEARCH OTTAWA
REPRINTED FROM
THE ENGINEERING JOURNAL, VOL. 38
This publication is being distributed by the 1)ivision of Building Research of the hTational Research Council as a contribution towards better building in Canada. It should not be I-eproduced in whole or in part, without permission of the original publisher. The Division would be glad to be of assistance in obtaining such permission.
Publications of the Division of Building Research nlay be obtained by mailing the appropriate remittance, (a Bank, Express, or Post Office Money Order or s cheque made payable a t par in Ottawa, to the Re- ceiver General of Canada, credit National Research Council) to the National Research Council, Ottawa. Stanlps are not acceptable.
A coupon system has been introduced to make payrnents for publica-
tions relatively simple. Coupons are available in cleno~ninations of 5 ,
25 and 50 cents, and may be obtained by making a remittance as in- dicated above. These coupons may be used for the purchase of all hTational Research Council publications including specifications of the
M.
K.
Thomas
Meteorological Division, Department of Transport, Toronto.
I n this study to determine snow loads on roofs, a flat, horizontal, unheated roof has been considered to be the same as the ground surface. While a roof is usually more subject to wind action than the ground, this may result in er a sweeping off of the snow or a piling of drifts, de- ing on the position of local d obstructions. IVith sloping and roofs not insulated from ing heat, it is generally es- d that snow load coilditions eldom become as severe as on a orizontal, unheated surface.
depths are measured daily t climatological stations in e data indicate the of snow on a hori- about each observa- as which have been which have been are avoided as f a r as possible in observing snow depths. Amounts of freshly fallen snom are also observed a t least daily a t all climatological stations.
Freshly fallen snow in Canada is arbitrarily given a specific gravity of 0.1 in computing total precipita- tion data. This relatioilship is good on the average, but from storm to storm the snow density may vary widely. On the grou~ld snow usually begins to pack and consolidate a t once. The weight of further snowfall contributes to this settling, as does
is usually in the range
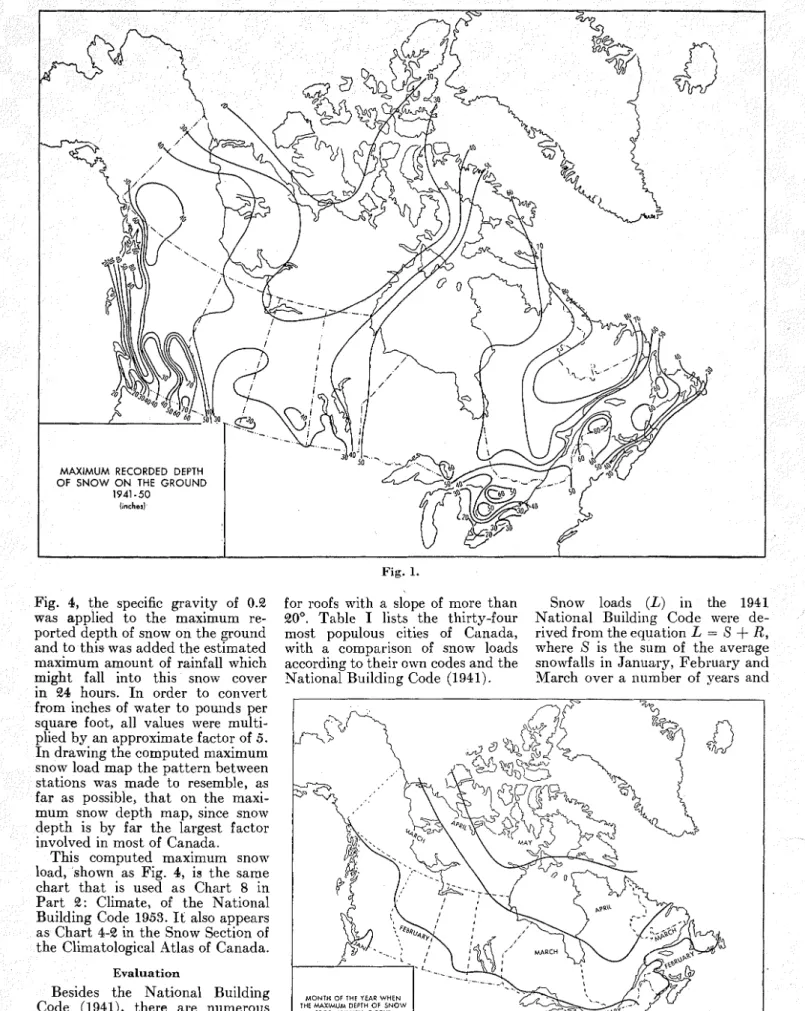
data were plotted on a chart and lines of equal maximum snow depth were drawn a t intervals of 10 inches. This chart is shown as Fig. 1. The isolines were kept as smooth as possible and if the masimum depths a t two adjacent stations did not agree, the larger figure was adopted. It must be remembered that most observing stations, from which rec- ords have been used in this study, are located a t airports or in urban locations. It is believed that snow in the bush and in rolling, forested country accumulates t o greater depth than in the open. This is also the case in mountainous country, where the masimum depth of snow on the grountl in inaccessible, high valleys and passes is most certainly greater than the valley station data, from \vhich this chart is largely drawn.
T o obtain a better uilderstaildiilg of the maximum reported depth of snom on the ground, a survey was made to determine when this maxi- mum usually occurs. From Fig. 2 it can be seen that maximum depths are expected in January and Febru- ary in most of coastal and southern Canada. I n interior Canada, as the latitude increases, the period of usual rnaximum depth is delayed. Xorth of Hudson Bay this period is usually in May.
Since maximum snow depths al- ways occur immediately following a heavy snowfall, it was felt t h a t the average density figure should be somewhere between that of 0.1 for freshly fallen snow and 0.2 t o 0.4 for an old snow pack. A specific gravity of 0.2 was arbitrarily chosen as the average and was used in reducing snow depths to weight units.
I n southeastern Canada, most structural failures due t o snow loads are reported when a winter or spring rain falls on a heavy snow cover. For several hours the snow
Computed maximum snow loads have been derived from extreme snowfall, snow cover and rainfall data in the decade from 1941 to
1950. The derived loads are evalu. ated against those obtained from huilding codes now in use in major Canadian cities and found t o be comparable in most cases. The value of these derived loads to smaller municipalities is mentioned.
cover is able to hold the rain often no run-off takes place, but load increases steadily. Frequent1 this type of storm produces a mi ture of heavy wet snow a n d rai In the Prairie Provinces and northern Canada, heavy rainfall quite unlikely during the period rnasirnum snow cover and this fa tor is not so important. On t Pacific Coast, rain is frequent an abundant during the winter mo but with its occurrence, t e m tures are usually sufficiently to melt a snow cover quickly.
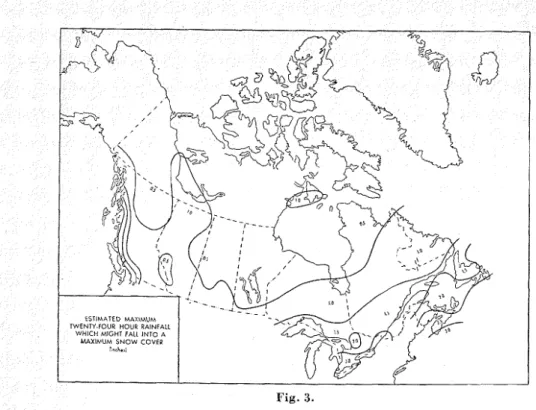
To consider the rainfall fac the records were searched for maximum amount of rainfall whi has fallen in 24 llours during t season when a maximum snow cover might be expected. A period of 24 hours was chosen because (1) it was felt t h a t rain for a longer period would inost certainly produce appreciable run-off and (2) it is the only period for which rainfall in- tensity figures are generally avail- able. Data used were from the period 1941-50, which is similar t o the period used for snowfall d a t a . En- veloping lines were drawn on a chart which indicate the probable limiting position of the 24-hour amounts which might fall during th
This chart is shown as Fi To obtain t h
MAXIMUM RECORDED DEPTH
Fig. 4, the specific gravity of 0.2 for roofs with a slope of more than Snow loads ( L ) in the 1
was applied to the maximum re- 20'. Table I lists the thirty-four National Building Code were ported depth of snow on the ground most populous cities of Canada, rived from the ecluation L = S
+
and to this was added the estimated with a comparisoil of snow loads where S is the sum of the aver maximum amount of rainfall which according to their own codes and the snowfalls in January, February an might fall into this snow cover National Building Code ( 1 9 4 1 ) . March over a number of years an in 24 hours. I n order to convert
computed maximum snow hown as Fig. 4, is the same that is used as Chart 8 in
limatological Atlas of Canada. Evaluation
R is correspoildingly the average
ainfall in inches. This equation flat roof ant1 adjust- made for sloped roofs. gives values for hIont- onto which are very loads in their munici- des and to the snow loads obtained in the present study. However wlleil applied . t o other
parts of Canada the values ob- tained from the equation are not satisfactory.
I n the Pacific Coast region (see Vancouver) and the Maritime Prov- inces (see Kdifax) where there is an abundance of winter rainfall, the 1941 equation gives values whicll tend to be high. I n the Prairie Proviilces (see Regina), since snow- Table I : A Cornpal.ison of Snow 1,oacls Accortling LO Different Rllilding
Cotles (Pounds per Square Foot)
-- -
I
I
City
i 'lunicil)al Bit'g' S a t i o r ~ z ~ l Bldg. Computcd ~ I a x ~ m u r n I'rov Codc in Forrc
1052 Code 1041 Sr~olv I.oad
&Iontrc;ll Toron to V n n r o ~ ~ v c r 15'1nuipeg Ottawa Qucl~ec Hamilton E d ~ u o n t o n Windsor Calgary Halifax London Ont. Que. Ont. Alta.. Ont. Alta.. N.S. Ont.
chiefly because
bf
the reaso values it gave to the m Ontario and Quebec.The snow load values
loads derived here, eleven
greater than those given i n t h
1952 building codes.
At most of the cities where t h value in use is the rather standard
but the possibility of heav is present and had t
based on thirty year snow depth data m obtained. T h e sa here is 50 pounds.
At three locatians in however, t h e situation is According t o values obtain study, the snow loads i codes of Ottawa, Ki
Victoria 30 a t these cities may hav
Saint John 50
Regiun 30 influenced by values used a t
St. John's 5 0 to, where t h e probability of
Verdun 50 snow cover is not so great:
Snska toon 35 this apparent under-deslgnlng a
Sherbloohe ,55
Three Rivers 6 0 Ottan~a, Icingston and Sault Ste.
Kitchener 40 Marie, we might expect these areas
Hull 60 to report a greater proportion o
S u d l ~ u r y 40 structural failures due t o snow
Osha~va 3.5
Peterborougb 6 0 loads than other Canadian cities.
St. Catl~arines 3 5
Bran tford 35 Snow Load Studies in th
Sarnia 3 0 United States
Port JYilliam 5 5
Kingston 55 A research study on snow 1
Snult Ste. hlarie Ont. 5.5 has recently been completed in
Port .krthur 55 United States by the Weat
Sydney SO Bureau under the sponsorsh
Outremont 50 the Housing and Home
Fig. 1.
loads selected for the
plus the weight of a able snowstorm. This the most extreme
oads in this paper have
of any other live loads been in- cluded; the loads derived are strictly from clilnatological data and are rounded off to the closest 5 pounds in Table
I.
I11general, the resultingvalues are comparable with those in use in the 1952 building codes of some twenty major cities across Canada. Perhaps the greatest value of this paper is to indicate to smaller municipalities the proper snow load values to use in preference to direct adoption of values in use at nearby large cities.
A c k n o w l e d g m e n t s
This paper records work done by the author in connection with the revision of the National Building Code of Canada. This was carried out as part of the author's duties as climatologist to the Division of Building Research of the National Research Council, to which position he was seconded from the Meteoro- logical Division, Department of Transport. The paper is published with the approval of Andrew Thom- son, Controller of the Rteteorologi- cal Division and of R.
F.
Legget,M.E.I.c., Director of the Division of Building Research, under whose
immediate direction the project was undertaken.
References
1. Ullpublished data on rain, snow and snow cover on file a t the Climatological Section, Meteorological Division, De- partment of Transport, Toronto.
2. Canada, Department of Transport, Mete- orological Division. "Climatic Summaries for Selected Tv~eteorological Stations, Volume I," Toronto (1947).
3. Canada, National Research Council, "National Building Code N.R.C. No.
1068," Ottawa, 1951.
4. United States. Division OF Housing Re-
search, Housing and Homy, Finance Agency, "Snom Lond Studies, Housing Research Paper KO. 19, Washington,
1952.
5. Pearce, D . C. and Gold, L. W. "The C a n a d i a n Snow S u r v e y 1947-1950,"
National Research Council of Canada, Associate Committee on Soil and Snow Mechanics, Technical Memoralldum No.
21, Ottawa, 1931.
6. Boughner, C. C. and Potter, J. G . "Snom Cover in Canada", Weatherwise 6(6):
pp. 155-139, 170-171, December 1953. 7. Thomas, M. K. "Climatological Atlas of
Canada", N.R.C. No. 3151, Ottawa, 1953. 8. Associate Committee on the National Building Code, "Yational Building Code of Canada 1933, Part 2 Climate", N.R.C. No. 3190, Ottawa, 1953.