https://doi.org/10.4224/20377557
READ THESE TERMS AND CONDITIONS CAREFULLY BEFORE USING THIS WEBSITE. https://nrc-publications.canada.ca/eng/copyright
Vous avez des questions? Nous pouvons vous aider. Pour communiquer directement avec un auteur, consultez la première page de la revue dans laquelle son article a été publié afin de trouver ses coordonnées. Si vous n’arrivez pas à les repérer, communiquez avec nous à PublicationsArchive-ArchivesPublications@nrc-cnrc.gc.ca.
Questions? Contact the NRC Publications Archive team at
PublicationsArchive-ArchivesPublications@nrc-cnrc.gc.ca. If you wish to email the authors directly, please see the first page of the publication for their contact information.
Archives des publications du CNRC
For the publisher’s version, please access the DOI link below./ Pour consulter la version de l’éditeur, utilisez le lien DOI ci-dessous.
Access and use of this website and the material on it are subject to the Terms and Conditions set forth at Benchmarking of energy savings associated with energy efficient lighting in houses
Parekh, Anil; Swinton, M. C.; Szadkowski, F.; Manning, M. M.
https://publications-cnrc.canada.ca/fra/droits
L’accès à ce site Web et l’utilisation de son contenu sont assujettis aux conditions présentées dans le site
LISEZ CES CONDITIONS ATTENTIVEMENT AVANT D’UTILISER CE SITE WEB.
NRC Publications Record / Notice d'Archives des publications de CNRC:
https://nrc-publications.canada.ca/eng/view/object/?id=e315a81c-8a79-4d60-b057-d1c3450839e3 https://publications-cnrc.canada.ca/fra/voir/objet/?id=e315a81c-8a79-4d60-b057-d1c3450839e3
Canadian Centre
Centre canadien des
for Housing Technology
technologies résidentielles
Benchmarking of energy savings associated with energy efficient lighting in houses
Parekh, Anil; Swinton, M.C.; Szadkowski, F.; Manning, M.M.
The Canadian Centre for Housing Technology (CCHT)
Built in 1998, the Canadian Centre for Housing Technology (CCHT) is jointly operated by the National Research Council, Natural Resources Canada, and Canada Mortgage and Housing Corporation. CCHT's mission is to accelerate the development of new technologies and their acceptance in the marketplace.
The Canadian Centre for Housing Technology features twin research houses to evaluate the whole-house performance of new technologies in side-by-side testing. The twin houses offer an intensively monitored real-world environment with simulated occupancy to assess the performance of the residential energy technologies in secure premises. This facility was designed to provide a stepping-stone for manufacturers and developers to test innovative technologies prior to full field trials in occupied houses.
As well, CCHT has an information centre, the InfoCentre, which features a showroom, high-tech meeting room, and the CMHC award winning FlexHouse™ design, shown at CCHT as a demo home. The InfoCentre also features functioning state-of-the art equipment, and demo solar photovoltaic panels. There are over 50 meetings and tours at CCHT annually, with presentations and visits occurring with national and international visitors on a regular basis.
Final Report
B
Be
e
nc
n
c
hm
h
ma
a
r
r
ki
k
i
ng
n
g
o
of
f
E
En
ne
er
r
g
g
y
y
S
Sa
a
vi
v
in
ng
gs
s
A
As
ss
so
oc
ci
i
a
a
t
t
e
e
d
d
w
wi
i
t
t
h
h
E
En
ne
er
rg
gy
y
E
Ef
ff
fi
ic
c
i
i
en
e
nt
t
L
L
i
i
g
g
ht
h
ti
i
ng
n
g
i
in
n
H
H
o
o
us
u
se
e
s
s
Prepared By: Anil ParekhSustainable Buildings and Communities Group CANMET Energy Technology Centre - Ottawa Energy Technology and Programs Sector Natural Resources Canada
Ottawa, Ontario K1A 0E4
In Collaboration with
Michael Swinton Frank Szadkowski Marianne Manning
Canadian Centre for Housing Technology (CCHT)
EXECUTIVE SUMMARY
Energy efficient compact fluorescent lighting fixtures are becoming more commonly available in the marketplace for homeowners. The replacement of energy efficient lamps in houses would certainly reduce the electrical energy use and power demand; however, would also affect the space heating and space cooling energy needs. The purpose of this project is to establish inter-dependence of lighting on the overall energy usage in housing. Based on the inter-dependence effects, the overall impacts of compact fluorescent lamps (CFL) in housing applications can be evaluated. The following tasks were accomplished:
• benchmarking testing was conducted at the Canadian Centre for Housing Technology (CCHT) facility to develop reliable power and energy use profiles;
• verification of an internal gains model for HOT2000 algorithms; and
• extrapolation of potential impact of energy efficient lighting on different types of housing.
Lighting Energy Use
• The housing surveys showed that, on average, lighting energy use is about 3.4 kWh per day in Canadian houses. The lighting energy use accounts for about 5% to 8% of the annual utility costs.
Characteristics of Compact Fluorescent Lamps
• The manufacturers’ ratings of the power demand for lamps were good and reliable for the energy modelling purposes. The difference in published rating and measured wattages of the compact fluorescent and conventional incandescent lamps ranged was approximately ±1.2 W – or about ±4%.
• The power factor of the compact fluorescent lamps ranged from 0.56 to 0.59. The incandescent lamps had a power factor of 1.0.
• The kVAr measurements for the whole house showed that the reactive power is slightly lower for CFL lighting than conventional lighting. Therefore, the lower power factor of the CFL lamps does not appear to be an issue because their lower reactive power more than compensate for it.
CCHT Testing during the Heating Season
The CCHT testing of the conventional incandescent and the compact fluorescent lighting showed the following results:
• The compact fluorescent lighting can reduce electricity demand and provide significant energy savings. Based on a typical lighting schedule for the house, the daily energy savings are about 67%.
• The reductions in the lighting energy use are almost offset by increase in the space heating requirements. The lighting energy is utilized as internal gains for the house. The results showed that 83% to 100% of lighting energy consumption could contribute to the internal gains.
• It appeared that the different ventilation strategies, either continuous or intermittent, did not have any impact on the overall energy savings associated with CF lamping.
CCHT Testing during the Cooling Season
The CCHT testing of the conventional incandescent and the compact fluorescent lighting during the summer season showed the following results:
• The compact fluorescent lighting can reduce electricity demand and provide significant energy savings. Based on a typical lighting schedule for the house, the daily energy savings are about 67%.
• The reduction in lighting energy use also reduces the cooling loads. The energy analysis showed that about 80% of the lighting energy internal gains are associated with cooling demand.
• The use of CF lighting also reduces the ON time run of the cooling equipment by 20% or more.
Potential Estimates of Benefits of Compact Fluorescent Lighting
Internal heat gain models were verified successfully. The thermal archetype was based on the age, location and type of the house with conventional lighting energy consumption at about 3.4 kWh/day. It was assumed five conventional incandescent fixtures were replaced with compact fluorescent fixtures. Based on this scenario, conventional lights with 77 W of five fixtures used for three hours/day were replaced with CFL of 19 W of five lamps used for three hours/day. The reduction in daily lighting energy use is about 0.87 kWh.
• The electrical energy savings are about 318 kWh per year with CF lighting. The reduction in lighting energy consumption is about 26%. The whole house electricity load reduction (annual energy use) is about 3.7%.
• The electrical demand savings are about 0.29 kW with CF lighting.
• The increase in the annual space heating energy consumption is about 0.6% to 1.7%.
• The reduction in the space cooling energy use ranged from 4% to 9.5% for the CF lighting. The ON time operation of cooling equipment ranged from 10% to 18%.
• The utility costs showed that even in the ‘heating only’ scenario, the compact fluorescent lighting positively saved the utility costs. The cooling season savings significantly adds to the cost savings. The lighting replacements also positively reduce the utility costs in all electric houses.
• Assuming the cost of five CF lighting fixtures of about $30, the simple payback period is three to six years for non-air-conditioned houses. A house with summertime air-conditioning, would accelerate the simple payback period form 2.5 to five years.
Overall, compact fluorescent lighting contributes positively to energy and cost savings in typical Canadian houses.
Table of Contents
EXECUTIVE SUMMARY ... III ACKNOWLEDGEMENTS ... VIII
1. INTRODUCTION ...1
1.1. SCOPE AND OBJECTIVES...1
1.2. AVERAGE LIGHTING ENERGY USE...2
1.3. TEST AND VERIFICATION METHODS...3
1.4. REPORT ORGANIZATION...4
2. ENERGY PERFORMANCE OF COMPACT FLUORESCENT LAMPS ...5
2.1. LIGHT BULBS AND CFLCHARACTERISTICS...5
2.2. LIGHTING SCHEDULE...10
2.3. HEATING SEASON TESTS...11
2.3.1. Benchmarking Tests...11
2.3.2. CFL Tests...12
CFL Test with Continuous Ventilation Strategy ...12
CFL Test with Intermittent Ventilation Strategy...17
2.3.3. Summary of Heating Season Results ...19
2.4. COOLING SEASON TESTS...20
2.4.1. Set-up of Air-Conditioning System ...20
2.4.2. Benchmarking AC Energy Contributions...23
2.4.3. CFL Tests...24
2.4.4. Summary of Cooling Season Results ...28
2.5. SUMMARY...29
3. IMPACT OF ENERGY EFFICIENT LIGHTING IN HOMES ...30
3.1. INTERNAL HEAT GAINS...30
3.2. ENERGY SAVINGS ASSOCIATED WITH COMPACT FLUORESCENT LIGHTING...32
3.2.1. Assumptions:...33
3.2.2. Estimates of Energy Savings for the New Homes...33
3.2.3. Estimates of Energy Savings for the Existing Homes...35
3.3. SUMMARY...35
4. SUMMARY AND CONCLUSIONS...36
List of Tables
TABLE 1. PROFILE OF BASE ELECTRIC USE PATTERNS FOR SINGLE-FAMILY HOMES. ... 3
TABLE 2: LIGHT BULBS PARAMETERS OBTAINED WITH A ELCONTROL VIP96 METER... 8
TABLE 3. SUMMARY OF POWER QUALITY MEASUREMENTS FOR THE WHOLE HOUSE USING CF AND CONVENTIONAL LAMPS. ... 9
TABLE 4. BENCHMARKING RESULTS OF TEST AND REFERENCE HOUSES. ... 12
TABLE 5. MEASURED RESULTS OF LIGHTING ENERGY AND THE SPACE HEATING ENERGY USE IN TEST AND REFERENCE HOUSES – CONTINUOUS VENTILATION STRATEGY... 14
TABLE 6. MEASURED RESULTS OF LIGHTING ENERGY AND THE SPACE HEATING ENERGY USE IN TEST AND REFERENCE HOUSES – INTERMITTENT VENTILATION STRATEGY. ... 17
TABLE 7-REFERENCE HOUSE AIRFLOW MEASUREMENTS -CIRCULATION SPEED (CFM) ... 22
TABLE 8-REFERENCE HOUSE AIRFLOW MEASUREMENTS -ACSPEED (CFM) ... 22
TABLE 9-TEST HOUSE AIRFLOW MEASUREMENTS -CIRCULATION SPEED (CFM)... 22
TABLE 10-TEST HOUSE AIRFLOW MEASUREMENTS -ACSPEED (CFM) ... 23
TABLE 11-ACENERGY CONTRIBUTIONS... 24
TABLE 12. RESULTS OF ENERGY CONSUMPTIONS FOR THE LIGHTS AND THE AIR-CONDITIONING (PLUS FAN). ... 26
TABLE 13. MATRIX FOR THE ENERGY SAVING ESTIMATES. ... 32
TABLE 14. 2004ANNUAL AVERAGE FUEL COSTS (ENERGY STATISTICS HANDBOOK). ... 33
TABLE 15. ESTIMATES OF ANNUAL ENERGY AND COST SAVINGS ASSOCIATED WITH CFL IN TYPICAL NEW HOMES. ... 34
TABLE 16. ESTIMATES OF ANNUAL ENERGY AND COST SAVINGS ASSOCIATED WITH CFL IN TYPICAL EXISTING HOMES. ... 35
TABLE 17. SELECTED CHARACTERISTICS OF THE TEST AND RESEARCH HOUSES... 39
TABLE 18. LIST OF ENERGY METERS INSTALLED IN EACH HOUSE. ... 39
List of Figures
FIGURE 1. TYPICAL ANNUAL ENERGY USE PROFILE FOR A 2000 SQ-FT HOUSE LOCATED IN TORONTO... 2FIGURE 2. TYPICAL ANNUAL UTILITY COST PROFILE FOR A 2000 SQ-FT HOUSE LOCATED IN TORONTO... 2
FIGURE 3. PROFILE OF LIGHTING ENERGY USE IN CANADIAN HOUSING. ... 3
FIGURE 4: ELECTRIC CIRCUITRY... 6
FIGURE 5. COMPACT FLUORESCENT LAMP IN A TEST HOUSE. ... 8
FIGURE 6. CCHT LIGHTING SCHEDULE FOR ENERGY EFFICIENT LIGHTING PROJECT... 10
FIGURE 7. PROFILE OF LIGHTING POWER DEMAND FOR REFERENCE AND TEST HOUSES. ... 11
FIGURE 8. PROFILE OF LIGHTING POWER DEMAND FOR REFERENCE AND TEST HOUSES. ... 13
FIGURE 9. COMPARISON OF FURNACE ENERGY CONSUMPTION WITH CONVENTIONAL AND ENERGY EFFICIENT LIGHTING... 15
FIGURE 10. ENERGY BALANCE ANALYSIS OF INTERNAL GAINS ASSOCIATED WITH LIGHTING AND THE SPACE HEATING LOADS. ... 16
FIGURE 11. UTILIZATION LIGHTING ENERGY GAINS TO OFFSET SPACE HEATING REQUIREMENTS. ... 16
FIGURE 12. COMPARISON OF FURNACE ENERGY CONSUMPTION WITH CONVENTIONAL AND ENERGY EFFICIENT LIGHTING – INTERMITTENT VENTILATION... 18
FIGURE 13. ENERGY BALANCE ANALYSIS OF INTERNAL GAINS ASSOCIATED WITH LIGHTING AND THE SPACE HEATING LOADS WITH INTERMITTENT VENTILATION STRATEGY... 19
FIGURE 14. AIR CONDITIONING SYSTEM CONFIGURATION AT CCHT HOUSES AND LOCATION OF SENSORS... 21
FIGURE 15-FIRST FLOOR BATHROOM BATHROOM DUCT TEMPERATURE PROFILE. ... 21
FIGURE 16-FIRST FLOOR ENTRANCE DUCT TEMPERATURES PROFILE. ... 22
FIGURE 17-HOUSE RELATIVE HUMIDITY SUMMER 2004... 23
FIGURE 18-NET ENERGY REMOVED BY AC SYSTEM -SUMMER 2004 ... 24
FIGURE 19. CCHT LIGHTING SCHEDULE FOR ENERGY EFFICIENT LIGHTING DURING THE SUMMER SEASON. ... 25
FIGURE 20. PROFILE OF LIGHTING ENERGY CONSUMPTION. ... 26
FIGURE 21. CORRELATION OF MAXIMUM OUTDOOR TEMPERATURE AND THE DAILY COOLING LOAD... 28
FIGURE 22. CORRELATION FOR THE ACON TIME... 28
FIGURE 23. UTILIZATION ON INTERNAL HEAT GAINS... 31
ACKNOWLEDGEMENTS
The “Benchmarking of Energy Savings Associated with Energy Efficient Lighting in
Houses” project supported by Standards and Labelling, Housing and Equipments group of the Office of Energy Efficiency. Pierrette LeBlanc, Katherine Delves and John Cockburn managed and directed the project.
Anil Parekh of the Sustainable Building and Communities (SBC) group of the CANMET Energy Technology Centre conceived and led the research team. The project team included Frank Szadkowski of SBC; and Mike Swinton and Marianne Manning of the Canada Centre for Housing Technologies (CCHT). The project team sincerely appreciates CCHT Research Committee for their report review and technical support.
B
Be
e
nc
n
c
hm
h
ma
a
r
r
ki
k
i
ng
n
g
o
of
f
E
En
ne
er
r
g
g
y
y
S
Sa
a
vi
v
in
ng
gs
s
A
As
ss
so
oc
ci
i
a
a
t
t
e
e
d
d
w
w
i
i
t
t
h
h
E
E
n
n
e
e
r
r
g
g
y
y
E
E
f
f
f
f
i
i
c
c
i
i
e
e
n
n
t
t
L
L
i
i
g
g
h
h
t
t
i
i
n
n
g
g
i
i
n
n
H
H
o
o
u
u
s
s
e
e
s
s
1. INTRODUCTION
In recent years, due to the substantial reductions in the incremental costs associated with energy efficient lighting fixtures, their use in housing is becoming more prevalent. The energy efficient lighting fixtures offer substantial potential for reducing the electrical power consumption and energy use. The use of these energy efficient lighting fixtures also influences the need for house heating and cooling.
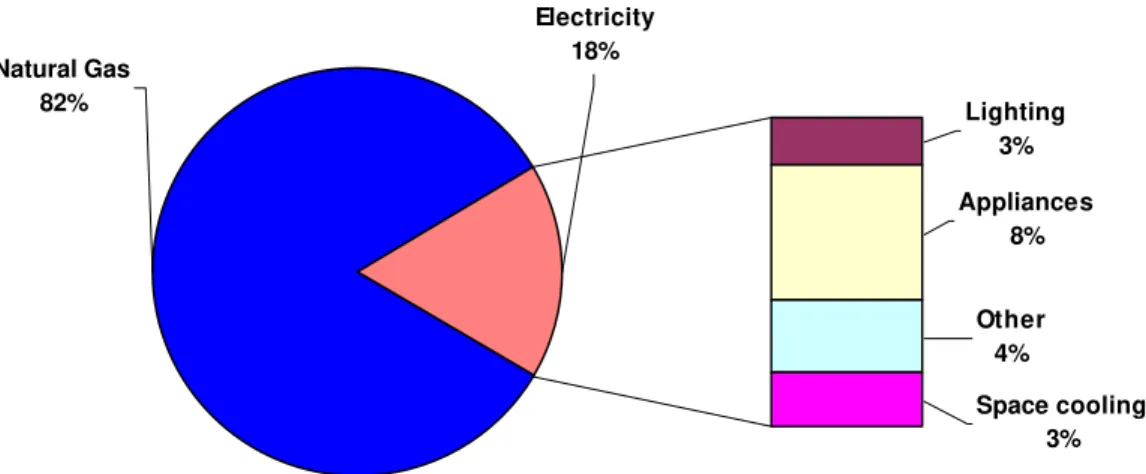
There are a number of field studies available for retail and commercial buildings showing the increase in the need for heating and the reduction in the cooling loads associated with the replacement of existing conventional lighting with the energy efficient lighting1. Residential use of lighting is different than the retail and commercial sectors. There is a selective use of lamps/fixtures in houses depending on occupant’s needs. As shown in Figure 1, space and hot water heating is predominant in Canadian housing. Figure 2 shows the annual costs associated with various energy use in a typical house. The unit cost of different sources of energy also plays a key role in identifying the potential retrofit measures. The lighting energy use accounts for about 5% to 8% of the annual utility costs. The replacement of energy efficient lamps in houses would certainly reduce the electrical energy use and power demand; however, would also affect the space heating and space cooling energy needs. The purpose of this project is to establish inter-dependence of various internal loads, particularly lighting, on the overall energy usage in housing. Based on the inter-dependence effects, the overall impacts of compact fluorescent lamps (CFL) in housing applications have been determined.
1.1. Scope and Objectives
The purpose of this project was to determine the overall energy efficiency and power demand reductions feasible with energy efficiency compact fluorescent lamps in houses. As part of the project, benchmarking testing was conducted at the Canadian Centre for Housing Technology (CCHT) facility to develop reliable power and energy use profiles. The outcome of this project includes:
• the benchmark testing of energy efficient lighting at the CCHT research facility;
• the verification of an internal gains model for HOT2000 algorithms; and
1 Advanced Lighting Guidelines – Edition 2003, New Buildings Institute. Available at http://www.newbuildings.org. (Refer to Section 3.1.3 and Table 3-1).
• extrapolation of potential impact of energy efficient lighting on different types of housing. Other 4% Space cooling 3% Appliances 8% Lighting 3% Natural Gas 82% Electricity 18%
Figure 1. Typical annual energy use profile for a 2000 sq-ft house located in Toronto.
Other 7% Space cooling 5% Appliances 13% Lighting 5% Electricity 30% Natural Gas 70%
Figure 2. Typical annual utility cost profile for a 2000 sq-ft house located in Toronto.
1.2. Average Lighting Energy Use
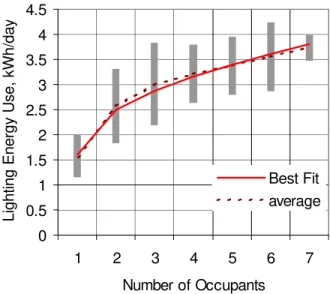
Over the years, there have been a number of detailed housing surveys. From a set of 134 highly monitored houses2, the following profiles were generated to define the lighting energy use in housing. Table 1 shows the typical lighting energy use profile for housing. Figure 3 shows the data analysis graph for the lighting loads. The best-fit equation shows the approximate correlation for the lighting energy use and the number of occupants in the house.
2 Nova Scotia Report (NRCan) 1993; Efficiency Housing Database - Alberta (NRCan) 1993; Field Energy Audit
Survey (NRCan) 1994, BC; Espanola Energy Efficiency Housing Retrofit Program, Ontario Hydro, Scanada 1989, ON; Airtightness and Energy Efficiency of New Conventional and R2000 Housing in Canada (NRCan) 1997.
As per the above data, the average lighting energy use is about 3.4 kWh per day in Canadian houses. The data analysis for Alberta and Ontario houses (each consisting of more than 40 houses) showed that the average lighting energy use for Alberta was about 0.6 kWh/day more than that for Ontario. For the purpose of this study, the lighting energy use is assumed to be 3.4 kWh/day.
Table 1. Profile of base electric use patterns for single-family homes.
No. of Occupants Average Lighting Energy Use, kWh/day Standard Deviation, kWh/day 1 1.6 0.4 2 2.6 0.7 3 3.0 0.8 4 3.2 0.6 5 3.4 0.6 6 3.5 0.7 7 3.7 0.3 0 . 1 9 . 0 6 . 1 _
_Energy Use= + OccN −
Lighting kWh/day
OccN = number of occupants
0 0.5 1 1.5 2 2.5 3 3.5 4 4.5 1 2 3 4 5 6 7 Number of Occupants
Lighting Energy Use, kWh/day
Best Fit average
Figure 3. Profile of lighting energy use in Canadian housing.
1.3. Test and Verification Methods
The project objectives were accomplished with the following tasks:
1. Benchmark testing of energy efficient lighting at CCHT research facility. The Canadian Centre for Housing Technology (CCHT) consists of two well-defined
identical research houses (http://www.ccht-cctr.gc.ca/). This facility is jointly owned by the National Research Council Canada (NRC), Canada Mortgage and Housing Corporation (CMHC) and Natural Resources Canada (NRCan) and is located at NRC’s Ottawa campus. The facility allowed for running the reference house with conventional lighting and the test house with the CFL (compact fluorescent lamps) and other energy efficient lighting. The benchmark testing included the following:
• Measurements of the power demand and lighting performance of conventional and energy efficient lamps.
• Comparison of the impact of energy efficiency lighting during the heating season using two options:
v Intermittent ventilation – In this case, the ventilation system was “ON” only during the heating periods and there was no circulation of air in the house. This test simulated the operating conditions of old existing houses.
v Continuous ventilation – In this test, HRV ventilation system was kept fully “ON” during the heating periods. This reasonably represented the new construction where dedicated ventilation is mandated.
• Comparison of the impact of energy efficiency lighting during the cooling season. The second test set was for a period of three weeks during the cooling season. 2. Verifications of internal gain models of the residential energy analysis software
programs.
3. Extrapolate results for different styles of housing and locations and prepare a
report.
1.4. Report Organization
This report is structured in the following main sections:
• Section 2 presents the results of the benchmarking tests at the CCHT during the heating and cooling seasons;
• Section 3 documents the review of internal gains models and verifications of HOT2000 energy simulations and shows a matrix of potential energy efficiency and power demand benefits associated with CF lamping in two different styles of houses at various locations; and
2. ENERGY PERFORMANCE OF COMPACT FLUORESCENT LAMPS
The study focused on the impact of the compact fluorescent lamps on the annual energy consumption and power demand. This section provides a review of the average lighting energy use in Canadian houses and the field results of the benchmarking tests.
The Canadian Centre for Housing Technology (CCHT) facility provides a unique opportunity for verifying the difference between two different types of technologies. Visit the website http://www.ccht-cctr.gc.ca/ for a full description of the facility and the results of the comparison of two identical full-sized houses located on the campus of National Research Council in Ottawa. Appendix A provides brief overview of the CCHT facility.
2.1. Light Bulbs and CFL Characteristics
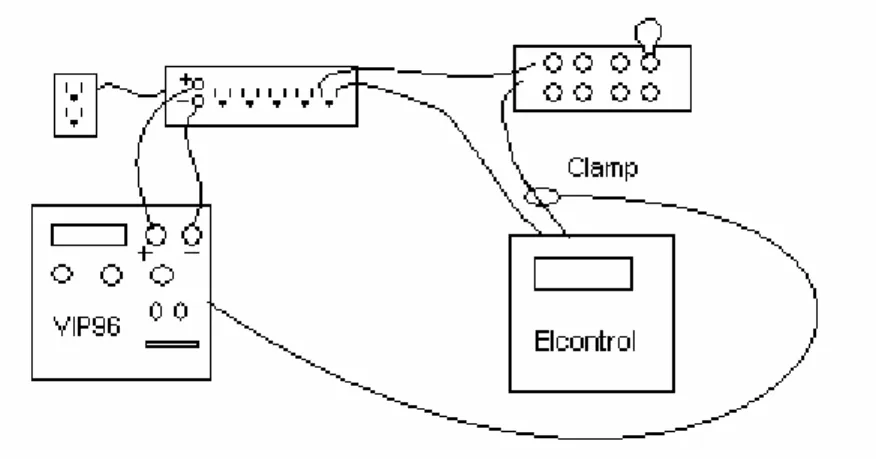
To check and qualify every light bulb used in the lighting experiment, two types of instruments were used. The first one is a Elcontrol VIP96 which gives the light voltage, intensity, power, power factor, volts-amps reactive, volts-amps and frequency. The second instrument is a 3060 Power Profiler by Basic Measuring Instrumentation. The Power Profiler can give instantaneous information (snapshot) or hourly, daily, reports.
The types of light bulbs used are:
• 60W incandescent = 60W DuraMax Long Life by Philips
• 40W incandescent = 40W DuraMax Long Life by Philips
• Round CFL = 9W G25 Globe by Commercial Electric
• Compact Fluorescent Lamps = 15W Marathon Energy saver mini decorative twister by Philips
Figure 4 illustrates the test set up for the lamps. Each test report informs about:
• Instantaneous power (max and min power, power consumption plot)
• Instantaneous volts-amps (max and min volts-amps, volts-amps plot)
• Billing demand (demand interval, max and min demand, demand plot)
• Load duration curve
Figure 4: Electric circuitry
• Volts-Amps report (max and min volts-amps reactive, volts-amps reactive plot)
• True Power Factor
• Max and min true power factor
• True power factor plot
• Displacement factor (max and min displacement factor, displacement factor plot)
• Voltage THD (max and min voltage THD, voltage THD plot)
• Current THD (max and min current THD, current THD plot)
• Voltage 5th harmonic (max and min voltage 5th harmonic, voltage 5th harmonic plot)
• Current 5th harmonic (max and min current 5th harmonic, current5th harmonic plot)
• Voltage (max and min voltage, voltage plot)
• Current (max and min current, current plot)
• Neutral-Ground voltage (max and min ground voltage, ground voltage plot)
• Frequency (max and min frequency, frequency plot) Snapshot informs about:
• Power consumption
• Instantaneous power + sinusoid
• Power factor (power, volts-amps, volts-amps reactive, power factor, dPF)
• Harmonics (fundamental frequency)
• Phase A-N Volts (THD)
• Phase A current (THD)
• Phase A voltage spectrum (fundamental volts, fundamental frequency, harmonics)
• Phase a power spectrum (power, fundamental frequency, harmonics, power)
• Voltage and current (phase A-N, neutral-ground, phase A)
• Neutral-ground voltage (crest factor, form factor, neutral-ground voltage plot, neutral-ground current plot)
For all light bulbs used, a snapshot report was produced.
The Elcontrol VIP96 helped verify the accuracy of the 3060 Power Profiler and verifying the constancy of the light bulbs of a same kind. If the voltage, intensity, power, power factor, volts-amps reactive, volts-amps and frequency given by both the Elcontrol VIP96 and the 3060 Power Profiler were close to each other, it was easy to conclude that both instruments are accurate. In the same way, if two bulbs of the same kind would give the same results with the Elcontrol then it’s possible to conclude that they are constant. Table 2 gives the various results obtained with the Elcontrol.
When measuring the previous parameters, experimenters observed that the readings are not as stable with the compact bulbs (round and compact) than with the regular ones.
Some tests were done by turning on the light suddenly to explore the effect of this action on the various parameters. Since the shortest period for reports is one hour, the measuring scale was unable to show any fluctuation or the time of response.
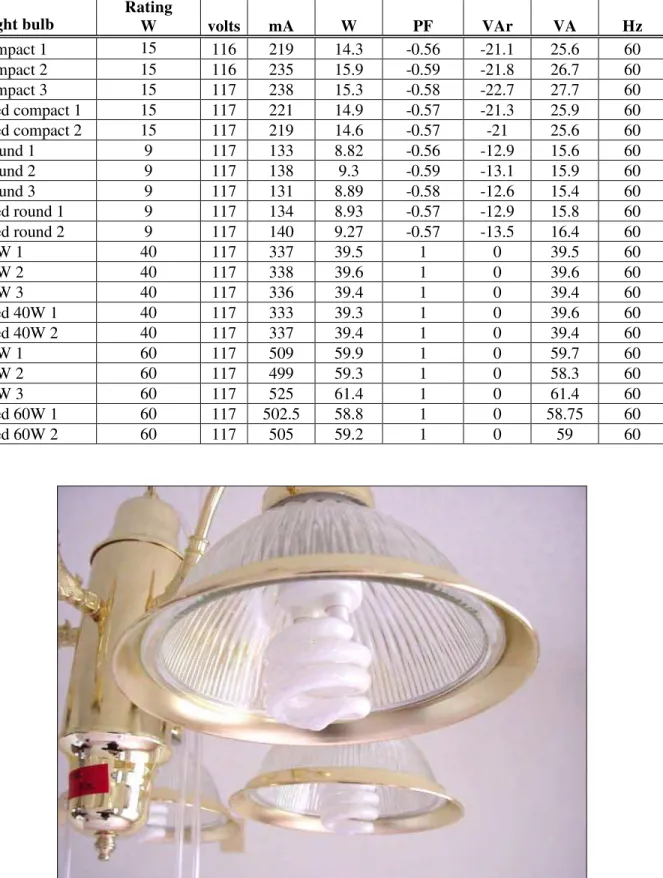
Using the information provided in Table 2 and Table 3, the following are typical observations:
• The manufacturers’ ratings of the power demand for lamps were good and reliable for energy modelling purposes. The difference in published rating and measured wattages of the compact fluorescent and conventional incandescent lamps ranged by about ±1.2 W or about ±4%.
• The power factor of the compact fluorescent lamps ranged from 0.56 to 0.59. The incandescent lamps had a power factor of 1.0.
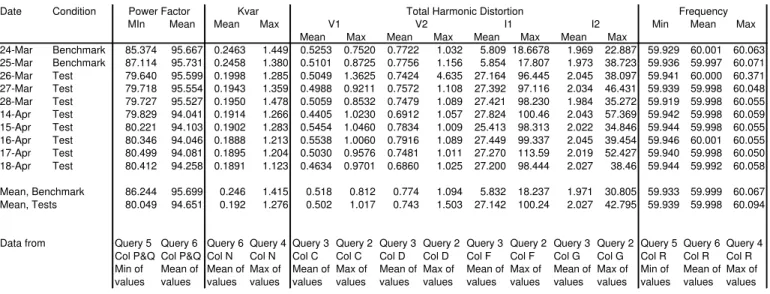
• Table 3 shows some interesting power factor measurements for the whole house. The mean values of the power factor for the Reference and Test houses are close – indicating that overall, the power factor is not an issue. However, when observed, the minimum value of PF differs significantly by about 0.06 or about 7% - indicating that CFL lamps do have lower PF especially when they start up. The kVAr measurements showed that the reactive power is slightly lower for CFL lighting than the conventional lighting. Therefore, the lower power factor of the CFL lamps does not appear to be an issue because their lower reactive power more than compensates for it. Measured data also showed the total harmonic distortions (THD) which are significantly higher for CFL lamps associated with the current; however, the THD associated with voltage were much less.
Table 2: Light bulbs parameters obtained with a Elcontrol VIP96 meter Measured Data Light bulb Manufacture Rating W volts mA W PF VAr VA Hz compact 1 15 116 219 14.3 -0.56 -21.1 25.6 60 compact 2 15 116 235 15.9 -0.59 -21.8 26.7 60 compact 3 15 117 238 15.3 -0.58 -22.7 27.7 60 used compact 1 15 117 221 14.9 -0.57 -21.3 25.9 60 used compact 2 15 117 219 14.6 -0.57 -21 25.6 60 Round 1 9 117 133 8.82 -0.56 -12.9 15.6 60 Round 2 9 117 138 9.3 -0.59 -13.1 15.9 60 Round 3 9 117 131 8.89 -0.58 -12.6 15.4 60 used round 1 9 117 134 8.93 -0.57 -12.9 15.8 60 used round 2 9 117 140 9.27 -0.57 -13.5 16.4 60 40W 1 40 117 337 39.5 1 0 39.5 60 40W 2 40 117 338 39.6 1 0 39.6 60 40W 3 40 117 336 39.4 1 0 39.4 60 used 40W 1 40 117 333 39.3 1 0 39.6 60 used 40W 2 40 117 337 39.4 1 0 39.4 60 60W 1 60 117 509 59.9 1 0 59.7 60 60W 2 60 117 499 59.3 1 0 58.3 60 60W 3 60 117 525 61.4 1 0 61.4 60 used 60W 1 60 117 502.5 58.8 1 0 58.75 60 used 60W 2 60 117 505 59.2 1 0 59 60
Table 3. Summary of power quality measurements for the whole house using CF and conventional lamps.
Date Condition
MIn Mean Mean Max Min Mean Max
Mean Max Mean Max Mean Max Mean Max
24-Mar Benchmark 85.374 95.667 0.2463 1.449 0.5253 0.7520 0.7722 1.032 5.809 18.6678 1.969 22.887 59.929 60.001 60.063 25-Mar Benchmark 87.114 95.731 0.2458 1.380 0.5101 0.8725 0.7756 1.156 5.854 17.807 1.973 38.723 59.936 59.997 60.071 26-Mar Test 79.640 95.599 0.1998 1.285 0.5049 1.3625 0.7424 4.635 27.164 96.445 2.045 38.097 59.941 60.000 60.371 27-Mar Test 79.718 95.554 0.1943 1.359 0.4988 0.9211 0.7572 1.108 27.392 97.116 2.034 46.431 59.939 59.998 60.048 28-Mar Test 79.727 95.527 0.1950 1.478 0.5059 0.8532 0.7479 1.089 27.421 98.230 1.984 35.272 59.919 59.998 60.055 14-Apr Test 79.829 94.041 0.1914 1.266 0.4405 1.0230 0.6912 1.057 27.824 100.46 2.043 57.369 59.942 59.998 60.059 15-Apr Test 80.221 94.103 0.1902 1.283 0.5454 1.0460 0.7834 1.009 25.413 98.313 2.022 34.846 59.944 59.998 60.055 16-Apr Test 80.346 94.046 0.1888 1.213 0.5538 1.0060 0.7916 1.089 27.449 99.337 2.045 39.454 59.946 60.001 60.055 17-Apr Test 80.499 94.081 0.1895 1.204 0.5030 0.9576 0.7481 1.011 27.270 113.59 2.019 52.427 59.940 59.998 60.050 18-Apr Test 80.412 94.258 0.1891 1.123 0.4634 0.9701 0.6860 1.025 27.200 98.444 2.027 38.46 59.944 59.992 60.058 Mean, Benchmark 86.244 95.699 0.246 1.415 0.518 0.812 0.774 1.094 5.832 18.237 1.971 30.805 59.933 59.999 60.067 Mean, Tests 80.049 94.651 0.192 1.276 0.502 1.017 0.743 1.503 27.142 100.24 2.027 42.795 59.939 59.998 60.094
Data from Query 5 Query 6 Query 6 Query 4 Query 3 Query 2 Query 3 Query 2 Query 3 Query 2 Query 3 Query 2 Query 5 Query 6 Query 4 Col P&Q Col P&Q Col N Col N Col C Col C Col D Col D Col F Col F Col G Col G Col R Col R Col R Min of Mean of Mean of Max of Mean of Max of Mean of Max of Mean of Max of Mean of Max of Min of Mean of Max of values values values values values values values values values values values values values values values
For Benchmarking, all Power Factors are Lagging.
For 26 March Test, of the 96 periods of 15 minutes, 95 periods have Lagging, 8 have Leading PFs. Other test days are similar.
THD, V2 Max for 26 March seems to have been a unique event.
For the EE Bulbs:
Power Factor: The minimum is lower, and the mean is slightly lower.
So it looks like the EE bulbs do have lower PF, perhaps especially when they start up.
VAR: The mean and max are lower. So it looks like the lower power of the EE bulbs more than compensates for their lower.PF. THD, Voltage: The mean is slightly lower, but the max is significantly higher.
THD, Current: I1: Mean and Max are significantly higher. I2: Mean is slightly higher, Max is significantly higher.
The lower power factor of the EE bulbs does not apperar to be a problem because therir lower power more than compenstates for it, producing lower VARs.
EE Bulbs do produce significantly higher THD, particulary in current.
V1 V2 I1 I2
Frequency Kvar
Power Factor Total Harmonic Distortion
2.2. Lighting Schedule
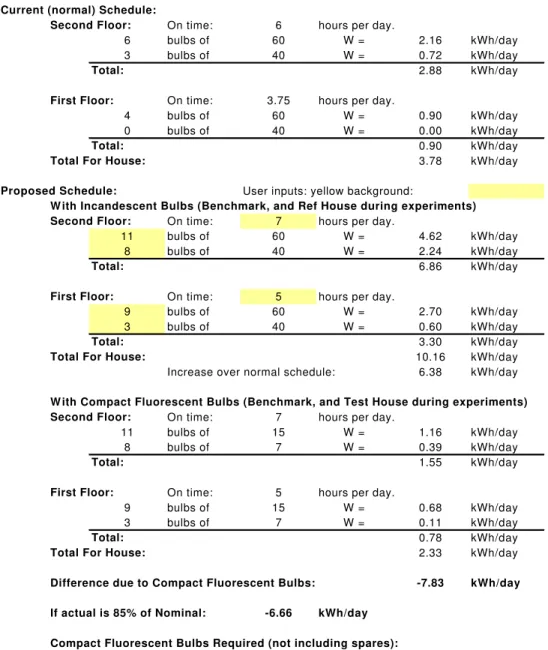
Several changes to the normal lighting schedule and test protocol were made at the CCHT houses. As shown in Figure 6, the lighting schedule was changed to enable reliable measurements of electricity demand for lighting and its implications on the space heating and space cooling energy use. The normal lighting energy use is about 3.4 kWh/day which was increased to about 10.2 kWh/day with conventional fixtures. The target was to obtain a difference of about 7.0 kWh/day with CFL lighting.
Figure 6. CCHT lighting schedule for energy efficient lighting project CCHT Lighting Schedule & Proposed Changes for Energy Efficient Lighting Project Current (normal) Schedule:
Second Floor: On time: 6 hours per day.
6 bulbs of 60 W = 2.16 kWh/day 3 bulbs of 40 W = 0.72 kWh/day
Total: 2.88 kWh/day
First Floor: On time: 3.75 hours per day.
4 bulbs of 60 W = 0.90 kWh/day 0 bulbs of 40 W = 0.00 kWh/day
Total: 0.90 kWh/day
Total For House: 3.78 kWh/day
Proposed Schedule: User inputs: yellow background:
W ith Incandescent Bulbs (Benchmark, and Ref House during experiments) Second Floor: On time: 7 hours per day.
11 bulbs of 60 W = 4.62 kWh/day 8 bulbs of 40 W = 2.24 kWh/day
Total: 6.86 kWh/day
First Floor: On time: 5 hours per day.
9 bulbs of 60 W = 2.70 kWh/day 3 bulbs of 40 W = 0.60 kWh/day
Total: 3.30 kWh/day
Total For House: 10.16 kWh/day
Increase over normal schedule: 6.38 kWh/day
W ith Compact Fluorescent Bulbs (Benchmark, and Test House during experiments) Second Floor: On time: 7 hours per day.
11 bulbs of 15 W = 1.16 kWh/day 8 bulbs of 7 W = 0.39 kWh/day
Total: 1.55 kWh/day
First Floor: On time: 5 hours per day.
9 bulbs of 15 W = 0.68 kWh/day 3 bulbs of 7 W = 0.11 kWh/day
Total: 0.78 kWh/day
Total For House: 2.33 kWh/day
Difference due to Compact Fluorescent Bulbs: -7.83 kWh/day If actual is 85% of Nominal: -6.66 kWh/day
Compact Fluorescent Bulbs Required (not including spares):
15 W bulbs (to replace 60W incandescents): 20 7 W bulbs (to replace 40 W incandescents): 11
2.3. Heating Season Tests
The heating season tests included the following:
• Benchmarking with conventional lights during March 24 and 25, 2004, and December 24 to 28, 2004.
• Testing with CF lamps in the Test House and conventional lamps in the Reference House during the following periods:
o March 26 to 28, 2004 with continuous ventilation strategy; o April 15 to 18, 2004 with continuous ventilation strategy;
o December 30 to January 5, 2005 with continuous ventilation strategy; and
o January 7 to 16, 2005 with intermittent ventilation strategy
2.3.1. Benchmarking Tests
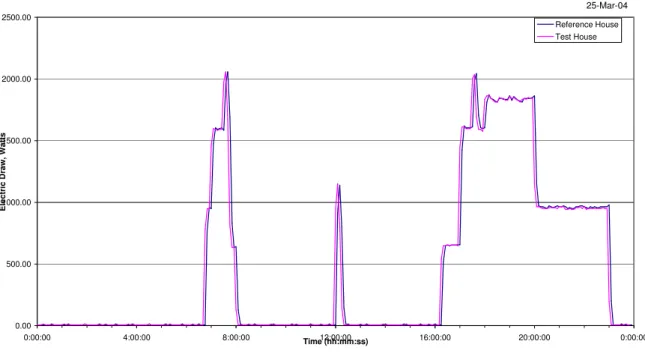
As per the CCHT test protocols, the test and research houses were set up and operated with identical conditions to develop a full profile for the reference. As shown in Figure 7, the lighting power demand for both houses followed identical patterns of power draw with less than 0.4% difference in power demand.
Figure 7. Profile of lighting power demand for Reference and Test houses.
Lights and Receptacles - Electric Power
0.00 500.00 1000.00 1500.00 2000.00 2500.00 0:00:00 4:00:00 8:00:00 Time (hh:mm:ss)12:00:00 16:00:00 20:00:00 0:00:00
Electric Draw, Watts
Reference House Test House
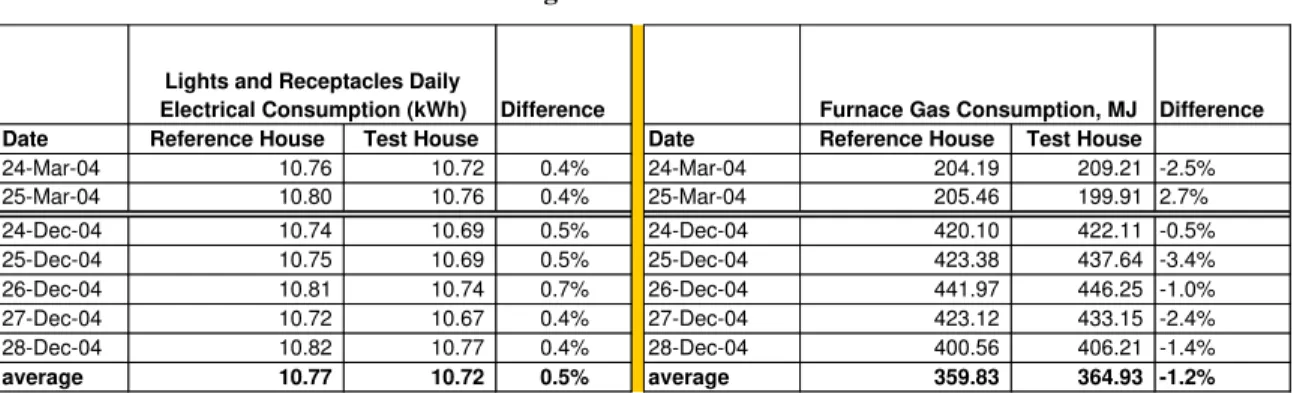
Table 4. Benchmarking results of Test and Reference houses.
Difference Difference
Date Reference House Test House Date Reference House Test House
24-Mar-04 10.76 10.72 0.4% 24-Mar-04 204.19 209.21 -2.5% 25-Mar-04 10.80 10.76 0.4% 25-Mar-04 205.46 199.91 2.7% 24-Dec-04 10.74 10.69 0.5% 24-Dec-04 420.10 422.11 -0.5% 25-Dec-04 10.75 10.69 0.5% 25-Dec-04 423.38 437.64 -3.4% 26-Dec-04 10.81 10.74 0.7% 26-Dec-04 441.97 446.25 -1.0% 27-Dec-04 10.72 10.67 0.4% 27-Dec-04 423.12 433.15 -2.4% 28-Dec-04 10.82 10.77 0.4% 28-Dec-04 400.56 406.21 -1.4% average 10.77 10.72 0.5% average 359.83 364.93 -1.2% Lights and Receptacles Daily
Electrical Consumption (kWh) Furnace Gas Consumption, MJ
Two sets of benchmarking tests were conducted prior to the evaluation of energy efficient compact fluorescent lighting. Table 4 shows the summary of the benchmarking energy use data gathered for each day. The reference data showed that daily energy consumption associated with lighting was within 0.05 kWh per day or about 0.5% and seemed to be within the measurement limits. The space heating energy use, measured in terms of furnace natural gas consumption, showed that both houses were relatively closely operating. The difference in the furnace energy consumption for two houses was about 5 MJ per day or about 1.2%. This again seemed to be within the measurement accuracy of gas flow meters.
2.3.2. CFL Tests
Once the benchmarking tests were successfully completed, all light bulbs in the Test House were replaced with appropriate compact fluorescents. Figure 6 shows the list of lamps and the operating schedule. The CFL testing was conducted during the following periods:
• for 3 days during March 26 to 28, 2004 with continuous ventilation strategy;
• for 4 days during April 15 to 18, 2004 with continuous ventilation strategy;
• for 7 days during December 30 to January 5 with continuous ventilation strategy; and
• for 10 days during January 7 to 16, 2005 with intermittent ventilation strategy.
CFL Test with Continuous Ventilation Strategy
In this test, HRV ventilation system was kept fully ‘ON’ during the heating periods. This reasonably represented the new construction where dedicated ventilation is required at all times. The ventilation system operated at full capacity (about 65 L/s) when the house required heating and the furnace was operating. In the non-heating periods, when the
furnace was ‘OFF’, the ventilation system operated at half capacity (about 30 L/s) to provide fresh air to the house. In both houses the ventilation is distributed through the main air distribution system using the furnace fan.
Figure 8 shows the profile of lighting power demand for the Reference and Test houses. In both houses, the light operating schedule was identical and provided similar profiles. Test House with CFLs showed significant reduction in the electric power demand associated with lighting. The power demand reduction was about 62%.
Table 5 shows the measured data of lighting energy use and the space heating energy requirements for the Test and Reference houses. The lighting energy use in the Reference house with conventional lighting ranged from 10.74 to 10.83 kWh/ day with an average of 10.77 kWh/day. This was close to the initial benchmarking results. The lighting energy in the Test house with CFL lighting was about 3.44 to 3.49 kWh/day with an average of about 3.47 kWh/day. The lighting energy use in both houses was not dependent on indoor or ambient conditions.
Figure 8. Profile of lighting power demand for Reference and Test houses. Lights and Receptacles - Electric Power
0.00 500.00 1000.00 1500.00 2000.00 2500.00 0:00:00 4:00:00 8:00:00 Time (hh:mm:ss)12:00:00 16:00:00 20:00:00 0:00:00
Electric Draw, Watts
Reference House Test House
Table 5. Measured results of lighting energy and the space heating energy use in Test and Reference houses – continuous ventilation strategy.
Difference Difference
Date Reference House Test House Date Reference House Test House
26-Mar-04 10.80 3.45 68.0% 26-Mar-04 145.14 156.65 -7.9% 27-Mar-04 10.82 3.47 67.9% 27-Mar-04 104.74 124.96 -19.3% 28-Mar-04 10.80 3.47 67.9% 28-Mar-04 106.27 130.14 -22.5% 15-Apr-04 10.83 3.49 67.8% 15-Apr-04 95.23 112.18 -17.8% 16-Apr-04 10.75 3.46 67.8% 16-Apr-04 83.19 103.89 -24.9% 17-Apr-04 10.80 3.48 67.8% 17-Apr-04 89.74 113.34 -26.3% 18-Apr-04 10.77 3.47 67.8% 18-Apr-04 91.21 121.37 -33.1% 30-Dec-04 10.74 3.49 67.5% 30-Dec-04 359.21 389.05 -8.3% 31-Dec-04 10.78 3.49 67.7% 31-Dec-04 251.78 278.61 -10.7% 1-Jan-05 10.79 3.46 67.9% 1-Jan-05 222.99 246.23 -10.4% 2-Jan-05 10.79 3.48 67.8% 2-Jan-05 430.62 469.38 -9.0% 3-Jan-05 10.76 3.48 67.7% 3-Jan-05 281.94 315.11 -11.8% 4-Jan-05 10.75 3.49 67.5% 4-Jan-05 280.09 305.23 -9.0% 5-Jan-05 10.58 3.44 67.4% 5-Jan-05 342.36 372.36 -8.8% average 10.77 3.47 67.8% average 206.03 231.32 -15.7% Lights and Receptacles Daily
Electrical Consumption (kWh) Furnace Gas Consumption, MJ
The space heating energy use varied depending on the outdoor conditions. The space heating requirements ranged from 83 to 430 MJ/day representing about 15% to about full (100%) space heating load for the house. The 14-day test period covered the full range of the heating season enabling the comparison of the effects of energy efficient lighting. The data showed the following trends:
• The compact fluorescent lighting in the Test house reduced the daily electricity consumption by about 7.3 kWh. This accounted for about 67.8% of the daily lighting energy use.
• The space heating energy use increased to compensate for the reduction in the lighting energy use. The space heating energy use increased from 11.5 to 38.8 MJ/day with an average of about 25.3 MJ/day. This ranged from 8% to 33% of the daily space heating load. It was observed that the increase in the space heating load was associated with the overall heat losses.
Using the measured data, an energy balance analysis was performed to determine the utilization factor for the lighting energy use and its impact on the space heating energy requirements.
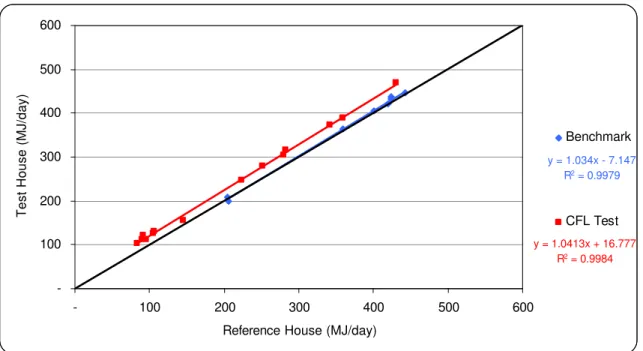
Figure 9 shows the comparison of the furnace energy consumption for the house with conventional and CF lighting. As shown, there is somewhat increase in the space heating loads in the Test house with CF lighting compared to the space heating loads in the Reference house with conventional lighting.
y = 1.034x - 7.147 R2 = 0.9979 y = 1.0413x + 16.777 R2 = 0.9984 -100 200 300 400 500 600 - 100 200 300 400 500 600
Reference House (MJ/day)
Test House (MJ/day)
Benchmark
CFL Test
Figure 9. Comparison of furnace energy consumption with conventional and energy efficient lighting. The following, Figure 10, shows a brief summary of energy analysis of energy efficient lighting at the CCHT. In this case, continuous air circulation is maintained at all times. The detailed analysis showed the following trends:
• If all of the energy used for lighting were utilizable as space heat, then the increased natural gas use due to more energy efficient lighting would be equal to the reduced energy for lighting divided by the efficiency of the furnace. For the experiments conducted at the CCHT, the conventional incandescent lights in the Reference house used an average of 10.77 kWh/day while the compact fluorescent lamps in the Test house used an average of 3.47 kWh/day. Thus, the reduced energy for lighting was 7.3 kWh/day which is about 26.27 MJ/day. The high efficiency furnace used during these tests has a rated efficiency of 92%, so the theoretical increase in natural gas consumption in the Test house should be 26.27 MJ/day / 0.92 = 28.55 MJ/day.
• The measured average natural gas consumption in the houses, averaged over the 14 days, was 231.32 MJ/day in the Test house, and 206.03 MJ/day in the Reference House with the difference at 25.29 MJ/day. The measured difference divided by the theoretical consumption is 0.886 which indicates that 88.6% of the lighting energy is an usable internal gain.
Figure 10 shows the lighting energy utilization factor for different outdoor conditions. The lighting energy utilization factor ranged from 83% to 100%. For given lighting loads, the higher the heat loads (cold temperatures), the lower the lighting energy utilization factor.
Analysis:
Lighting during benchmarking:
Average kWh/day Ref House 10.77 Test House 10.72
Difference 0.05 0.48% This difference is considered insignificant, and is not considered in further analysis.
Lighting during testing:
Average kWh/day Ref House 10.77 Test House 3.47
Difference 7.30 67.76%
Theoretical Difference in Natural Gas Consumption:
Difference in lighting during tests in MJ/day divided by Furnace Efficiency Lighting difference in MJ: 26.27 MJ/day
Difference in Furnace Gas: 28.55 MJ/day Based on 92% efficiency of furnace
Difference in Measured Furnace Gas Use: Directly from Measured Gas Use during Testing
Average MJ/day Test House 231.32 Ref House 206.03
Difference 25.29 12.27%
Percentage of Internal Gains from Lighting that are Utilized: 88.6%
Including Offset from Hi-Efficiency Benchmark:
Difference: 27.37 MJ/day
Percentage of Internal Gains from Lighting that are Utilized: 95.9%
Figure 10. Energy balance analysis of internal gains associated with lighting and the space heating loads.
0% 20% 40% 60% 80% 100% 120% 0 0.05 0.1 0.15 0.2 0.25 0.3
Lighting Internal Gains to Total Heat Loss Ratio
Lighting Energy Utilization Factor
• The data analyses showed that majority of lighting related internal gains are utilized for offsetting the need for space heating needs. The losses are mainly due to lights near windows and glazed doors where the lighting energy escaped through glazed windows.
CFL Test with Intermittent Ventilation Strategy
In this test, HRV ventilation system was “ON” only during the heating periods. When the furnace was “OFF,” there was no ventilation. This reasonably represented the ventilation and air distribution in old houses. The ventilation system operated at full capacity (about 65 L/s) when the house required heating and the furnace was operating. In both houses the ventilation is distributed through the main air distribution system using the furnace fan. Table 6 shows the measured data of lighting energy use and the space heating energy requirements for the Test and Reference houses. The lighting energy use in the Reference house with conventional lighting ranged from 10.30 to 10.79 kWh/ day with an average of 10.64 kWh/day. This was close to the initial benchmarking results. The lighting energy in the Test house with CFL lighting was about 3.37 to 3.51 kWh/day with an average of about 3.45 kWh/day. The lighting energy use in both houses was not dependent on indoor or ambient conditions. Figure 12 shows the comparison of space heating energy requirements with conventional and CF lighting.
The space heating energy use varied depending on the outdoor conditions. The space heating requirements ranged from 211 to 346 MJ/day representing about 30% to about 85% space heating load for the house. The 10-day test period covered the full range of the heating season enabling the comparison of the effects of energy efficient lighting. The data showed the following trends:
Table 6. Measured results of lighting energy and the space heating energy use in Test and Reference houses – intermittent ventilation strategy.
Testing: Testing:
Date Reference House Test House Date Reference House Test House
7-Jan-05 10.30 3.37 67.3% 7-Jan-05 305.23 343.26 -12.5% 8-Jan-05 10.35 3.38 67.4% 8-Jan-05 271.48 302.64 -11.5% 9-Jan-05 10.35 3.39 67.2% 9-Jan-05 284.58 321.39 -12.9% 10-Jan-05 10.74 3.49 67.5% 10-Jan-05 285.63 319.70 -11.9% 11-Jan-05 10.81 3.51 67.6% 11-Jan-05 308.56 341.41 -10.6% 12-Jan-05 10.77 3.50 67.5% 12-Jan-05 368.24 408.54 -10.9% 13-Jan-05 10.79 3.50 67.5% 13-Jan-05 211.80 235.88 -11.4% 14-Jan-05 10.77 3.48 67.7% 14-Jan-05 231.28 254.68 -10.1% 15-Jan-05 10.76 3.43 68.2% 15-Jan-05 304.65 343.10 -12.6% 16-Jan-05 10.79 3.47 67.8% 16-Jan-05 346.58 378.33 -9.2% average 10.64 3.45 67.6% average 291.80 324.89 -11.4%
Lights and Receptacles Daily
y = 1.034x - 7.147 R2 = 0.9979 y = 1.0959x + 5.1023 R2 = 0.9952 -100 200 300 400 500 600 - 100 200 300 400 500 600
Reference House (MJ/day)
Test House (MJ/day)
Benchmark
CFL Test
Figure 12. Comparison of furnace energy consumption with conventional and energy efficient lighting – intermittent ventilation.
• The compact fluorescent lighting in the Test house reduced the daily electricity consumption by about 7.2 kWh. This accounted for about 67.6% of the daily lighting energy use.
• The space heating energy use increased to compensate for the reduction in the lighting energy use. The space heating energy use increased from 22 to 38 MJ/day with an average of about 33 MJ/day.
Using the measured data, an energy balance analysis was performed to determine the utilization factor for the lighting energy use and its impact on the space heating energy requirements.
The measured average natural gas consumption in the houses, averaged over the 10 days with intermittent ventilation strategy, was 324.9 MJ/day in the Test house, and 291.8 MJ/day in the Reference house, so the difference is 33.1 MJ/day. The measured difference divided by the theoretical consumption is 0.908, which indicates that 90.8% of the lighting energy is an usable internal gain. Day by day analyses showed that the lighting internal gain utilization ranged from 87% to 100%.
Analysis:
Lighting during benchmarking:
Average kWh/day Ref House 10.77 Test House 10.71
Difference 0.06 0.51% This difference is considered insignificant, and is not used in further analysis.
Lighting during testing:
Average kWh/day Ref House 10.64 Test House 3.45
Difference 7.19 67.57%
Theoretical Difference in Natural Gas Consumption:
Difference in lighting during tests in MJ/day divided by Furnace Efficiency Lighting difference in MJ: 25.89 MJ/day
Difference in Furnace Gas: 29.42 MJ/day Based on 92% efficiency of furnace
Difference in Measured Furnace Gas Use: Directly from Measured Gas Use during Testing
Average MJ/day Test House 324.89 Ref House 291.80
Difference 33.09 11.34%
Percentage of Internal Gains from Lighting that are Utilized: 90.8% Including Offset from Hi-Efficiency Benchmark:
Difference: 27.37 MJ/day
Percentage of Internal Gains from Lighting that are Utilized: 93.0%
Figure 13. Energy balance analysis of internal gains associated with lighting and the space heating loads with intermittent ventilation strategy.
2.3.3. Summary of Heating Season Results
The CCHT testing of the conventional incandescent and the compact fluorescent lighting showed the following results:
• The compact fluorescent lighting can reduce electricity demand and provide significant energy savings. A typical 40 W incandescent lamp can be replaced by an equivalent 9-W compact fluorescent lamp. Based on a typical lighting schedule for the house, the daily energy savings are about 67%.
• The reduction in the lighting energy use is almost offset by increase in the space heating requirements. The lighting energy is utilized as internal gains for the house. The results showed that 83% to 100% of lighting energy consumption could contribute to the internal gains.
• It appeared that the different ventilation strategies, either continuous or the intermittent, did not have any impact on the overall energy savings associated with CF lamping.
2.4. Cooling Season Tests
The following section summarizes the results of the benchmarking tests conducted at CCHT for determining the energy savings associated with the energy efficient lighting system and its effects on the cooling loads during the summer cooling season.
CCHT houses during the summer months.
2.4.1. Set-up of Air-Conditioning System
The CCHT air-conditioning system was reconfigured recently to enable accurate measurements of the amount of energy and the amount of moisture being removed by the AC systems in both the Test and Reference houses. This new set up required two thermocouple grids, and two RH sensors. Since the air stream is no longer splitting into three ducts directly off the AC coil, only the existing airflow meter is needed. AC-coils are certified for installation on the supply side of a gas furnace, or on the return side of an electric furnace3. The set up, shown in Figure 14, provides reliable measures of power demand, energy measurements and moisture removals.
Once the air conditioning system set up was properly calibrated, we performed a week-long test to compare the air conditioning loads, temperature profiles and the energy use for both Test and Reference houses keeping all aspects identical. These test results showed the following trends:
Indoor temperature measurements: Figure 15 and Figure 16 show the return air duct temperatures for two locations. One is in the bathroom return air (passing through the HRV) and the other is from the living room area which is returned through the main return air plenum. These profiles showed that the indoor temperatures were closely analogous in Reference and Test houses. The overall difference was less than 0.2 oC, which is within the measurement accuracy.
3 We also reviewed the manufacturer’s standard recommendations for placing the AC coil. Some manufacturers
do not allow the placement of AC coil on the return side of a gas furnace. The reasoning behind the gas-furnace restrictions dates back to when gas gas-furnaces had standing pilot lights. The heat from the pilot light would cause the cold air coming off the coil to condense inside the furnace and cause corrosion problems. For the electric furnace, it was thought that if the drain pan overflows on a supply-side installation the electric furnace could short out. The Olsen furnaces in the Research Houses do not have standing pilot lights – so corrosion is less of a concern. We did confirm and clarify about this set up with the furnace manufacturer.
Return Air from House Airflow Station Furnace Filter AC Coil V T1, RH1 Q T2, RH2 Q = p * V * ( h1(@ T1, RH1) – h2(@ T2, RH2) ) Where: Q = Energy removed by AC V = Air Volumetric Flow Rate
T = Average Temperature RH = Relative Humidity h = Enthalpy of Wet Air p = Density of Air
Figure 14. Air conditioning system configuration at CCHT houses and location of sensors.
CCHT Research Houses 1st Floor Bathroom Duct Temperature
6.0 8.0 10.0 12.0 14.0 16.0 18.0 20.0 22.0 24.0 26.0 0:00:00 4:00:00 8:00:00 12:00:00 16:00:00 20:00:00 0:00:00 Time Temperature (°C) Reference House Test House 01-Jul-04
CCHT Research Houses 1st Floor Entrance Duct Temperature 6.0 8.0 10.0 12.0 14.0 16.0 18.0 20.0 22.0 24.0 26.0 0:00:00 4:00:00 8:00:00 12:00:00 16:00:00 20:00:00 0:00:00 Time Temperature (°C) Reference House Test House 01-Jul-04
Figure 16 - First Floor entrance duct temperatures profile.
Air flow measurements: The following tables contain the average of 10 manually-read airflow readings (cfm) for each of the nine points in the duct cross-section.
Table 7 - Reference House Airflow Measurements - Circulation Speed (cfm) Average: 621 cfm
Centre of duct to Average: 1.0508 Average of 10 Campbell readings after adjustment: 627 cfm
Table 8 - Reference House Airflow Measurements - AC Speed (cfm)
Average: 1230 cfm
Centre of duct to Average: 1.0558 Average of 10 Campbell readings after adjustment: 1236 cfm
Table 9 - Test House Airflow Measurements - Circulation Speed (cfm)
Average: 553 cfm
Centre of duct to Average: 1.0018 Average of 10 Campbell readings after adjustment: 530 cfm A B C 1 726 656 707 2 635 591 656 3 486 558 578 A B C 1 1419 1296 1443 2 1281 1165 1315 3 990 1057 1108 A B C 1 772 762 717 2 574 554 507 3 371 371 350
Table 10 - Test House Airflow Measurements - AC Speed (cfm)
Average: 1077 cfm
Centre of duct to Average: 1.0037 Average of 10 Campbell readings after adjustment: 1056 cfm
The Test house showed a larger range of airflows within the duct than the Reference house – reaching higher speeds at the top of the duct, and lower speeds at the bottom. However, the overall average air speed in the Test house remained lower than the average air speed of the Reference house in both circulation and cooling settings.
Relative humidity measurements: Figure 17 shows the profile of indoor humidity levels in the Reference and Test houses. Overall, test house has about 4% to 8% more humidity than the reference house. In terms of ‘moisture loads’, this can affect the air conditioning energy use by 1% to 3%.
House Relative Humidity - Summer 2004
15 20 25 30 35 40 45 50 55 60 0:00 0:00 0:00 0:00
Date & Time
RH (%)
Reference House 2nd Floor Test House 2nd Floor Reference House Main Floor Test House Main Floor Reference House Basement Test House Basement
01-Jul-04 02-Jul-04 03-Jul-04 04-Jul-04
Figure 17 - House Relative Humidity Summer 2004
2.4.2. Benchmarking AC Energy Contributions
Table 11 shows the air-conditioning system energy performance. The net energy removed by the air conditioning system in Reference and Test houses were compared. These results showed that the net energy removed is within the measurement accuracy (maximum of 4% difference – or about 8 MJ/day).
A B C
1 1508 1466 1402
2 1097 1073 989
Figure 18 shows a graph of the comparison of net energy removed by the air-conditioning system. This is as close as it gets for cooling load measurements. The co-relation coefficient is 0.997 – very close to 1.0 which is an ideal case.
Table 11 - AC Energy Contributions Energy Removed
during AC (MJ/day)
Energy Added during Circulation (MJ/day)
Net Energy Removed (MJ/day)
Date Reference Test Reference Test Reference Test
01-Jul-04 158.5 150.5 20.3 10.8 138.3 139.7
02-Jul-04 169.5 159.5 17.3 10.8 152.2 148.7
03-Jul-04 222.5 210.0 13.9 9.7 208.6 200.3
04-Jul-04 247.6 230.7 15.4 4.6 232.2 226.1
Air Conditioner Net Energy Removed Summer 2004
y = 0.9223x + 10.06 R2 = 0.997 0 50 100 150 200 250 300 0 50 100 150 200 250 300
Net Energy Removed by AC (MJ/day)
Net Energy Removed by AC (MJ/day) Benchmark 2004 Linear (Benchmark 2004)
Figure 18 - Net Energy Removed by AC system - Summer 2004
2.4.3. CFL Tests
As shown in Figure 19, the lighting schedule was changed to enable reliable measurements of electricity demand for lighting and its implications on the space heating and space cooling energy use. The normal lighting energy use is about 3.4 kWh/day which was increased to about 10.2 kWh/day with conventional fixtures. The target was to obtain a
difference of about 7.0 kWh/day with CFL lighting. This set up is similar to heating season testing of two different lighting fixtures. For the cooling season, we used all previously calibrated lamps (except for two burned out incandescent lamps) for the test period.
These tests were conducted during the August 10 to August 30, 2004 for a period of 21 days. Maximum outdoor temperatures ranged from 20 oC to 28.3 oC during the period. The air conditioning system operated from about 330 to 830 minutes per day (5.5 to 13.8 hours per day) in the Reference house and about 200 to 752 minutes per day (3.3 to 12.5 hours per day) in the Test house.
Table 12 shows the daily total of the energy consumption associated with the lighting and the air-conditioning loads.
Figure 19. CCHT lighting schedule for energy efficient lighting during the summer season.
C C H T L i g h t i n g S c h e d u l e & P r o p o s e d C h a n g e s f o r E n e r g y E f f i c i e n t L i g h t i n g P r o j e c t C u r r e n t ( n o r m a l ) S c h e d u l e : S e c o n d F l o o r : O n tim e : 6 h o u r s p e r d a y . 6 b u l b s o f 6 0 W = 2 . 1 6 k W h / d a y 3 b u l b s o f 4 0 W = 0 . 7 2 k W h / d a y T o t a l : 2 . 8 8 k W h / d a y F i r s t F l o o r : O n tim e : 3 . 7 5 h o u r s p e r d a y . 4 b u l b s o f 6 0 W = 0 . 9 0 k W h / d a y 0 b u l b s o f 4 0 W = 0 . 0 0 k W h / d a y T o t a l : 0 . 9 0 k W h / d a y T o t a l F o r H o u s e : 3 . 7 8 k W h / d a y P r o p o s e d S c h e d u l e : U s e r i n p u t s : y e llo w b a c k g r o u n d : W i t h I n c a n d e s c e n t B u l b s ( B e n c h m a r k , a n d R e f H o u s e d u r i n g e x p e r i m e n t s ) S e c o n d F l o o r : O n tim e : 7 h o u r s p e r d a y . 1 1 b u l b s o f 6 0 W = 4 . 6 2 k W h / d a y 8 b u l b s o f 4 0 W = 2 . 2 4 k W h / d a y T o t a l : 6 . 8 6 k W h / d a y F i r s t F l o o r : O n tim e : 5 h o u r s p e r d a y . 9 b u l b s o f 6 0 W = 2 . 7 0 k W h / d a y 3 b u l b s o f 4 0 W = 0 . 6 0 k W h / d a y T o t a l : 3 . 3 0 k W h / d a y T o t a l F o r H o u s e : 1 0 . 1 6 k W h / d a y I n c r e a s e o v e r n o r m a l s c h e d u le : 6 . 3 8 k W h / d a y W i t h C o m p a c t F l u o r e s c e n t B u l b s ( B e n c h m a r k , a n d T e s t H o u s e d u r in g e x p e r i m e n t s ) S e c o n d F l o o r : O n tim e : 7 h o u r s p e r d a y . 1 1 b u l b s o f 1 5 W = 1 . 1 6 k W h / d a y 8 b u l b s o f 7 W = 0 . 3 9 k W h / d a y T o t a l : 1 . 5 5 k W h / d a y F i r s t F l o o r : O n tim e : 5 h o u r s p e r d a y . 9 b u l b s o f 1 5 W = 0 . 6 8 k W h / d a y 3 b u l b s o f 7 W = 0 . 1 1 k W h / d a y T o t a l : 0 . 7 8 k W h / d a y T o t a l F o r H o u s e : 2 . 3 3 k W h / d a y D i f f e r e n c e d u e t o C o m p a c t F l u o r e s c e n t B u l b s : - 7 . 8 3 k W h / d a y I f a c tu a l i s 8 5 % o f N o m i n a l : - 6 . 6 6 k W h /d a y C o m p a c t F l u o r e s c e n t B u l b s R e q u i r e d ( n o t i n c l u d i n g s p a r e s ) : 1 5 W b u lb s ( t o r e p la c e 6 0 W in c a n d e s c e n t s ) : 2 0 7 W b u l b s ( t o r e p l a c e 4 0 W in c a n d e s c e n t s ) : 1 1
Table 12. Results of energy consumptions for the lights and the air-conditioning (plus fan). Date Reference House Test House Difference Reference House Test House Difference Apparent COP 14-Aug-04 10.8 3.4 7.3 20.8 18.1 2.6 2.8 15-Aug-04 10.7 3.4 7.3 23.8 20.5 3.2 2.3 16-Aug-04 10.7 3.5 7.2 25.7 22.4 3.3 2.2 17-Aug-04 10.8 3.4 7.4 24.7 21.3 3.4 2.2 18-Aug-04 10.7 3.4 7.3 27.0 24.1 2.9 2.5 19-Aug-04 10.8 3.4 7.4 25.7 22.7 3.0 2.5 20-Aug-04 10.8 3.4 7.3 19.7 15.8 3.8 1.9 21-Aug-04 10.7 3.4 7.3 18.9 16.7 2.1 3.4 22-Aug-04 10.8 3.5 7.4 20.2 16.7 3.6 2.1 23-Aug-04 10.7 3.4 7.3 18.8 16.4 2.4 3.0 24-Aug-04 10.8 3.4 7.4 17.4 14.9 2.5 2.9 25-Aug-04 10.7 3.4 7.3 22.6 18.8 3.8 1.9 26-Aug-04 10.8 3.4 7.3 28.1 24.8 3.3 2.2 27-Aug-04 10.7 3.4 7.3 29.7 26.0 3.7 2.0 28-Aug-04 10.8 3.4 7.4 34.8 31.5 3.3 2.2 29-Aug-04 10.8 3.5 7.3 17.2 13.9 3.2 2.3 30-Aug-04 10.7 3.4 7.3 16.6 13.3 3.3 2.2 Average 10.8 3.4 7.3 23.0 19.9 3.1 2.3 Lights and Receptacles Daily
Electrical Consumption (kWh)
A/C & Furnace Daily Elect. Consumption (kWh)
CCHT - Summer AC Benchmark 2004 and Lights and Rec. Electrical Consumption
0 5 10 15 8/10/2004 8/11/2004 8/12/2004 8/13/2004 8/14/2004 8/15/2004 8/16/2004 8/17/2004 8/18/2004 8/19/2004 8/20/2004 8/21/2004 8/22/2004 8/23/2004 8/24/2004 8/25/2004 8/26/2004 8/27/2004 8/28/2004 8/29/2004 8/30/2004 Date
Lights and Recept. Daily Electrical Consumption
(kWh)
Ref. house Test house