HAL Id: hal-00317024
https://hal.archives-ouvertes.fr/hal-00317024
Submitted on 1 Jan 2003
HAL is a multi-disciplinary open access
archive for the deposit and dissemination of
sci-entific research documents, whether they are
pub-lished or not. The documents may come from
teaching and research institutions in France or
abroad, or from public or private research centers.
L’archive ouverte pluridisciplinaire HAL, est
destinée au dépôt et à la diffusion de documents
scientifiques de niveau recherche, publiés ou non,
émanant des établissements d’enseignement et de
recherche français ou étrangers, des laboratoires
publics ou privés.
aurora
S. E. Milan, M. Lester, N. Sato
To cite this version:
S. E. Milan, M. Lester, N. Sato. Multi-frequency observations of E-region HF radar aurora. Annales
Geophysicae, European Geosciences Union, 2003, 21 (3), pp.761-777. �hal-00317024�
Annales
Geophysicae
Multi-frequency observations of E-region HF radar aurora
S. E. Milan1, M. Lester1, and N. Sato2
1Department of Physics and Astronomy, University of Leicester, Leicester LE1 7RH, UK 2National Institute of Polar Research, Tokyo 173-8515, Japan
Received: 18 July 2002 – Revised: 21 October 2002 – Accepted: 23 October 2002
Abstract. Multi-frequency observations of E-region
coher-ent backscatter from decametre waves reveal that auroral echoes tend to comprise two spectral components superim-posed, one at low Doppler shifts, below 250 m s−1, and the other Doppler shifted to near the ion-acoustic speed or above, up to 800 m s−1. The low Doppler shift component occurs at all look directions; Doppler shifts near the ion acoustic speed occur when looking at low flow angles along the direction of the electron drift in the electrojet, and Doppler shifts in ex-cess of the ion acoustic speed occur at intermediate flow an-gles. The latter population appears most commonly at radar frequencies near 10–12 MHz, with its occurrence decreas-ing dramatically at higher frequencies. The velocity of the high Doppler shift echoes increases with increasing radar fre-quency, or irregularity wave number k. The velocity of the low Doppler shift population appears to be suppressed sig-nificantly below the line-of-sight component of the electron drift. Initial estimates of the altitude from which scatter oc-curs suggest that the high Doppler shift echoes originate from higher in the E-region than the low Doppler shift echoes, cer-tainly in the eastward electrojet. We discuss these observa-tions with reference to the theories of de/stabilization of two-stream waves by electron density gradients and electrostatic ion cyclotron waves excited by field-parallel electron drifts.
Key words. Ionosphere (ionospheric irregularities)
1 Introduction
The instability mechanisms which give rise to field-aligned irregularities in the collisional plasma of the auroral E-region ionosphere have been the subject of much study over the last several decades. Other than in situ rocket measurements, the most powerful technique for investigating the nature of the irregularities is by determining the Doppler spectra of radio waves coherently scattered from the plasma density perturba-tions. The frequency of the probing radio wave determines Correspondence to: S. E. Milan ([email protected])
the irregularity scale-length from which scatter arises, with radars in the HF, VHF, and UHF bands being sensitive to scale-lengths of tens of metres, metres, and fractions of me-tres, respectively. Thus, the wavelength- or k-dependence of the instability mechanisms can be investigated by employing a range of radar frequencies.
Most work has been conducted with VHF radars. Early in these studies it was recognized that the Doppler spec-tra of echoes backscattered from the E-region fell into sev-eral broad categories, defined mainly by the spectral char-acteristics of Doppler shift and spectral width. Borrowing from earlier work conducted in the equatorial region, Bal-sley and Ecklund (1972) introduced the “type” nomencla-ture, in which there appeared two predominant classes: type I echoes, with a narrow peak Doppler-shifted to near the ion-acoustic speed, and type II spectra which are broader, with Doppler shifts below the ion-acoustic speed. These have been identified as echoes from two-stream and gradi-ent drift waves, respectively (see, for instance, Haldoupis, 1989; Sahr and Fejer, 1996; and references therein). Few echoes are observed by VHF radars with Doppler shifts in excess of the expected ambient E-region ion-acoustic speed (near 400 m s−1), and this was thought for some time to be an upper limit for the irregularity drift speed, irrespective of the background electron drift which is controlled by the con-vection electric field and can reach several km s−1. However, some work has suggested that the ion-acoustic speed is not such a limiting factor after all, e.g. Keys and Johnston (1979) in the VHF band, and Foster and Erickson (2000) at UHF. There is some debate as to whether such echoes are scattered from new irregularity types, for instance, electrostatic ion cyclotron waves, or arise in regions where the ion-acoustic speed is elevated due to heating (raising the threshold veloc-ity); one major obstacle to answering such questions is that experiments rarely measure the ion-acoustic speed within the scattering volume, and thus its value must be inferred. Over-all, the “type” nomenclature is perhaps now seen as too re-strictive and poorly-defined to allow the physics behind the generation of irregularities to be properly elucidated, and
sta-tistical approaches to classifying spectral populations can be more useful (e.g. Watermann et al., 1989).
More recent work involving HF radars has demonstrated significant similarities and also dissimilarities between the echo characteristics observed at metre and decametre wave-lengths (e.g. Villain et al., 1987, 1990; Hanuise et al., 1991; Milan and Lester, 1999, 2001; Milan et al., 2001, 2002). Chief among the dissimilarities is the frequent observation at HF of echoes with Doppler shifts considerably enhanced above the ambient ion-acoustic speed. These differences sug-gest a considerable wavelength or k dependence in the E-region irregularity characteristics. Some attempts have been made to compare echo characteristics at widely differing fre-quencies, for instance, in the HF and VHF bands (e.g. Kous-tov et al., 2002). In this study, however, we concentrate on a narrower k-range, employing the frequency-agility (8 to 20 MHz) of the SuperDARN radars (Greenwald et al., 1995) to investigate the characteristics of echoes from irregularities with wavelengths in the range 8 to 19 m. Key to this investi-gation is the new “Stereo” capability of the Iceland East Su-perDARN radar, which allows measurement of backscatter echo spectra at two radar frequencies simultaneously.
2 The Stereo CUTLASS experiment
The standard SuperDARN HF coherent scatter radar experi-mental arrangement and the “myopic” scan mode have been described in some detail before (Greenwald et al., 1995 and Milan and Lester, 2001, respectively), and only a brief sum-mary will be given here. The radars are frequency-agile be-tween 8 and 20 MHz, though for transmission license con-siderations they are constrained to operate within a few allo-cated frequency bands within this range, each typically a few hundred kHz in width. The finite width of the bands allows automatic selection of an interference-free frequency prior to each radar measurement. The radars sound along 16 beam directions, separated by ∼3.2◦of azimuth. In normal oper-ation each beam is integrated for 3 or 7 s, resulting in scan-ning periods of 1 or 2 min, and is gated into 75 range cells of 45 km in length, with a range to the first cell of 180 km. The radars transmit a 7-pulse multi-pulse scheme, which yields 17-lag autocorrelation functions, from which power, Doppler velocity, and spectral width can be determined (Hanuise et al., 1993). In addition, interferometric measurements made by a pair of antenna arrays allows the elevation angle of the return echoes to be measured, which, in turn, gives a very approximate estimate of the altitude from which the echoes originate (Milan et al., 1997, 2001; Milan and Lester, 2001). Without a detailed knowledge of the electron density pro-file of the ionosphere, the level of refraction experienced by the radar radio wave is unknown (though it is assumed that the ray is refracted to orthogonality with the magnetic field, such that backscatter can be observed). This limits the accuracy of the altitude estimates, as straight-line propaga-tion must be assumed. This results generally in an overes-timate of the scattering altitude, though the error is thought
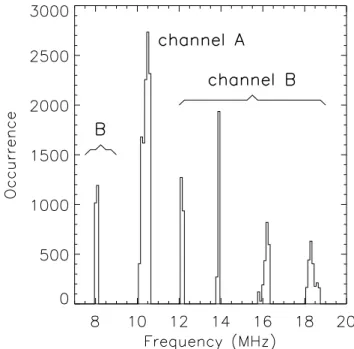
Fig. 1. Occurrence of transmission at different operating
frequen-cies by the Iceland East radar during 18:00–06:00 UT, 14–15 De-cember 2001. Channel A of the Stereo system transmitted near 10 MHz, whereas the transmissions of channel B were split between five frequency bands near 8, 12, 14, 16, and 18 MHz.
to be less than 10–20 km in the E-region (see also Milan et al., 2001). The Iceland East radar, one of the CUTLASS radars (see Fig. 12) which form the eastern-most pair of the Northern Hemisphere SuperDARN chain, has been used ex-tensively in the past for the study of E-region backscatter. As part of these studies the “myopic” mode was developed in which the range separation is decreased to 15 km, to give high spatial resolution observations of the near-range field-of-view, that portion of the field-of-view in which E-region echoes are routinely detected. Usually the myopic mode has been run with a radar operating frequency of 10 MHz and a beam dwell period of 3 s. The Iceland East radar, located at Pykkvibaer, Iceland (63.77◦N, 339.46◦E), is again
em-ployed in the present study.
Recently, the versatility of the CUTLASS radars has been enhanced by the “Stereo” upgrade, which effectively turns each radar into two. In normal SuperDARN operation only a fraction of the available transmitter duty-cycle (∼7%) is used to generate the radar pulse sequence. Stereo exploits some of the remaining unused duty-cycle by interleaving two pulse sequences at different radar frequencies. Then, employing the original plus an additional receiver system, it is possible to sound simultaneously on two radar “channels”, known as A and B. The beams of the two channels can be steered in-dependently, and in principle, the range separation or range to the first cell of each channel can also differ. Although the two channels must be separated in frequency, the minimum separation is only 15 kHz, much less than the width of a typ-ical SuperDARN frequency-band, allowing observations on both channels within the same band if desired. Routine
op-Fig. 2. (Top panels) Range-time-parameter plots of backscatter power, Doppler shift, and spectral width, from beam 15, the most
easterly-pointing beam of the radar. Positive Doppler shifts indicate motion towards the radar. (Bottom panel) H -component magnetogram from the SAMNET Hella magnetometer, co-located with the Iceland East radar.
eration of the Stereo capability of CUTLASS commenced in January 2002, though test runs were conducted in the lat-ter half of 2001. In December 2001 the myopic mode ex-ploited Stereo to make multi-frequency observations of the E-region, and it is the Stereo myopic run on the night of the 14–15 December, 18:00–06:00 UT, that is the focus of the present study. Channel A operated in myopic mode as nor-mal, at a radar frequency of 10 MHz, completing a scan of the field-of-view every 63 s. Channel B sounded each beam simultaneously, though at a different frequency; each scan of channel B was conducted at one of 5 frequencies, in the or-der 8, 12, 14, 16, and 18 MHz, with a complete cycle being completed every 315 s. In this way, truly simultaneous and common-volume measurements of E-region echoes at differ-ent frequencies were made, with 10 MHz being the reference frequency. Figure 1 shows a histogram of the frequencies sounded during the 12-h experimental interval, in 100-kHz wide bins. Division into the 6 frequency bands is clearly
ev-ident, though some bands are wider than others (the 10 and 18 MHz bands especially). Five times as many observations were made at 10 MHz on channel A as in each of the channel B frequency bands. It is the comparison of the echo charac-teristics in each of these bands to which we now turn.
3 Observations
3.1 Overview
E-region backscatter is observed throughout the night of 14– 15 December 2001. Figure 2 shows backscatter power, line-of-sight Doppler velocity and spectral width measurements from channel A (10 MHz) along beam 15, the most eastward directed beam of the Pykkvibaer radar, for the 12 h of obser-vation. Measurements were made at this frequency with a sampling interval of ∼1 min, though they are shown here for illustrative purposes at a time resolution of ∼5 min,
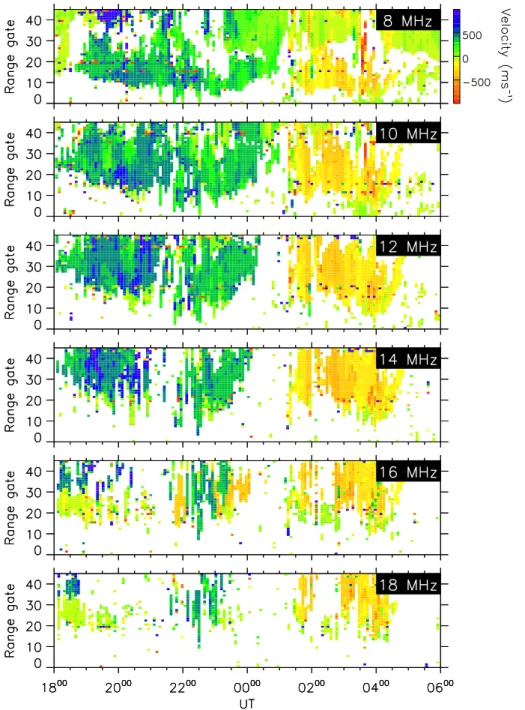
equiva-Fig. 3. Range-time-Doppler shift plots from the six frequency bands employed in the study.
lent to the resolution of measurements made in each of the five frequency bands on channel B. From the power obser-vations it is clear that the backscatter falls into two distinct regions at nearer and further ranges, a demarcation appear-ing near range gate 40 (∼800 km). Interferometric estimates of the altitude of origin of each echo allow us to attribute backscatter at nearer ranges to the E-region, and from further ranges to the F-region. Hanuise et al. (1991) also divided their data set along similar lines, using a demarcation range of ∼700 km. In the rest of this study we are interested only in backscatter from the E-region, and take great care to exclude echoes from the F-region.
As beam 15 points almost eastward, the line-of-sight ve-locity represents mainly the zonal component of the
elec-tron drift, with positive (negative) velocities corresponding to flow towards (away from) the radar, that is westward (east-ward). Prior to 01:00 UT, the measured velocity is westward, corresponding to the eastward electrojet. After this, east-ward flow, corresponding to the westeast-ward electrojet, is seen. The bottom panel of Fig. 2 shows the H component mag-netogram from the Hella SAMNET station, co-located with the Pykkvibaer radar. The positive and negative excursions of H before and after 00:00 UT are consistent with the mag-netic deflections expected from the eastward and westward electrojets, respectively.
We now turn to a comparison of the backscatter observed in the six frequency bands. Figure 3 shows range-time-velocity plots from beam 15 for each of the frequency bands,
from 8 MHz at the top to 18 MHz at the bottom. In gen-eral similar observations are made at each frequency, though some differences are noteworthy. (1) At 8 MHz F-region echoes are observed at near ranges, as close as gate 20 af-ter 23:00 UT. (2) At higher frequencies, the occurrence of E-region echoes decreases, especially above 14 MHz. (3) In addition, the minimum range at which E-region echoes are observed increases from near gate 5 at 8 MHz to gate 20 at 18 MHz. All three of these observations are thought to arise from the frequency dependence of refraction of HF ra-dio waves in the ionosphere.
In a given electron density profile, refraction decreases with increasing frequency. As a consequence, at higher fre-quencies radio waves must propagate to greater distances be-fore being refracted to orthogonality with the magnetic field, the condition necessary for observation of backscatter from field-aligned irregularities. Conversely, at lower frequencies backscatter from either the E- or F-region can be observed at nearer ranges.
3.2 Echo characteristics
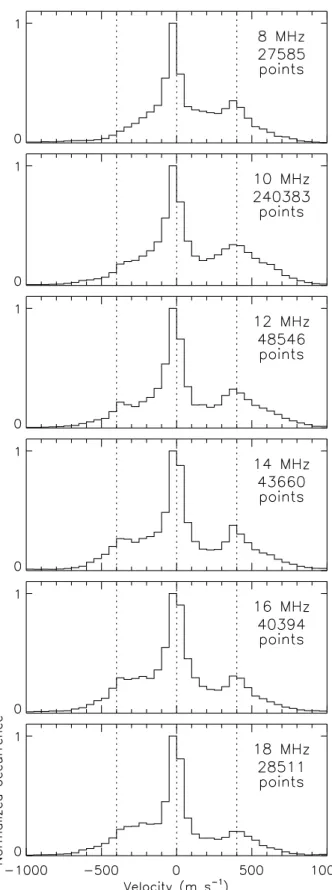
To examine the Doppler shift characteristics of the scatter, Fig. 4 shows histograms of the occurrence of different line-of-sight velocities observed within the E-region scatter in all beams of the radar, in the six frequency bands. Positive and negative velocities primarily comprise echoes from the eastward and westward electrojets, respectively, as discussed above. For guidance, vertical dotted lines at ±400 m s−1 show approximate values of the ion-acoustic speed CS in
the E-region. The distributions show a main central peak close to 0 m s−1, with wings extending to approximately
±800 m s−1, with less than 0.5% of the observations having
|ν| > 800 m s−1. Within the eastward electrojet observa-tions (positive velocities) there is a secondary peak close to
ν = CS, taken in the past as evidence for the presence of
echoes from two-stream waves (type I spectra) at either VHF frequencies (e.g. Haldoupis, 1989) or HF frequencies (e.g. Hanuise et al., 1991; Milan and Lester, 2001). In the west-ward electrojet there is less evidence for such a secondary peak, though there is clear suggestion of a shoulder in the distribution near ν = CS. Examining the occurrence
distri-butions from individual beams of the radar we find that the low-velocity peak is observed mainly in beams which look across the direction of electrojet flow, and the high-velocity peak is observed predominantly in beams which look along the electrojets. However, in all beams there is a contribution from both high and low velocity populations.
Figure 5a shows the temporal evolution of the velocity occurrence in 5-min intervals, with 10 MHz being selected as representative of all the frequency bands. The colour-coding indicates echo occurrence in velocity bins 50 m s−1 wide. The time-integrated occurrence distribution would be that shown in Fig. 4. The purpose of this figure is to show that, especially in the eastward electrojet, two distinct peaks in the velocity distribution are observed at most times; that is a peak near ν = 0 m s−1, and a second peak near ν = CS.
Fig. 4. Occurrence distributions of Doppler shift observed in the
six frequency bands. Vertical dotted lines at ±400 m s−1 approxi-mately indicate the ion-acoustic speed.
Fig. 5. (a) Five-minute occurrence distributions of Doppler shift from Channel A. (b–d) Median values of power, spectral width, and
estimated altitude of scatter, respectively, where significant numbers of echoes are recorded.
Both peaks in the distribution are quite narrow at any instant in time, though variations in the position of the high velocity peak results in this being somewhat smeared out in the inte-grated distribution. In general, when one population appears the other is present also, and this is particularly apparent in the higher frequency bands where echoes are seen more spo-radically (see Fig. 3), i.e. high and low Doppler shift echoes tend to occur together, and we refer to these as our high and low Doppler shift populations.
Figures 5b and c show the spectral characteristics of the echoes. These figures indicate, in each time and velocity bin where significant numbers of echoes (more than 10) are ob-served, the median echo power (Fig. 5b) and median spectral width (Fig. 5c). In addition, Fig. 5d indicates the median altitude from which the echoes are received. Several popula-tions of echoes are observed in these panels. After 00:00 UT, echoes of very low Doppler velocity (less than 50 m s−1),
very low width (less than 100 m s−1) and low signal-to-noise ratio (10 dB) are seen to originate from very low altitudes in the E-region, perhaps below 90 km. These we attribute to echoes from meteor trails (Hall et al., 1997), which are not of direct interest to this study. The incidence of meteor scatter is greatest in the morning local time sector due to the orbital motion of the Earth. Prior to 00:00 UT, in the eastward elec-trojet, low velocity echoes tend to be of higher backscatter power (15 dB), are broader (200 m s−1and more) and orig-inate at higher altitudes, 100 to 110 km. Such echoes are also present in the westward electrojet, but they are some-what outnumbered by the meteor echoes. These broad, low Doppler shift echoes have similar characteristics to type II spectra observed with VHF radars. This, then, is the low Doppler shift population.
At higher velocities, approaching the ion-acoustic speed near 400 m s−1, the altitude from which echoes are received
Fig. 6. Echo characteristics in the six frequency bands sounded, for the interval 18:00 UT to 20:00 UT. (Top panels) Occurrence distributions
of Doppler shift. (Middle panels) Occurrence distributions of spectral width versus Doppler shift. (Bottom panels) Occurrence distributions of backscatter power versus Doppler shift. In these distributions, red indicates greatest occurrence.
increases. Close to the ion-acoustic speed the median width of echoes is low again (150 m s−1 and less), especially in the eastward electrojet. Low spectral widths at Doppler shifts near the ion-acoustic speed are characteristic of type I spectra. At higher velocities again, above the ion-acoustic speed, the altitude from which echoes are received increases, the spectra become broader once more, and the backscatter power increases markedly. We class these echoes, with ve-locities near the ion-acoustic speed and above, as our high Doppler shift population, though we will further subdivide this into two categories, CS and super-CS echoes, as
ex-plained below. We note that the echo characteristics de-scribed here are fully consistent with those reported at greater length by Milan and Lester (2001).
To reiterate this last point, Fig. 6 presents a more detailed analysis of the echo types observed in the scatter. Here we concentrate on a limited portion of the observations, 18:00 to 20:00 UT, to avoid the smearing issues described above. For each frequency band the top panels indicate the self-normalized Doppler shift occurrence, similar to that shown in Fig. 4. Below these are occurrence distributions of echo Doppler shift versus spectral width, sometimes known as Watermann plots (Watermann et al., 1989). In these plots red indicates the greatest occurrence. Below these are sim-ilar distributions of Doppler shift versus power. In all these distributions, a clear demarcation between the low and high Doppler shift population is found near 250 m s−1. In addi-tion, it is seen that the high Doppler shift population can be further subdivided into two, with peaks near 400 and 650 m s−1, especially in the 10, 12, and 14 MHz frequency bands. As 400 m s−1 is close to the nominal ion-acoustic speed, we will refer to these two populations as the “CS” and
“super-CS” echoes in the rest of the paper. Above 14 MHz
the super-CS population becomes much less evident.
The low Doppler shift population has the broadest range of spectral widths, from near 0 m s−1up to 500 m s−1. The backscatter power in this population tends to be less than 25 dB, and decreases with increasing radar frequency. The
CS population has the lowest spectral widths, in general
below 200 m s−1, and powers up to 25 dB. Peak spectral widths in the super-CS population reach 350 m s−1. These
echoes also display the greatest backscatter power, varying between 15 and 50 dB at 10 MHz, though decreasing with increasing frequency. The echo characteristics described here, especially at 10 MHz, are just as reported by Milan and Lester (2001) and shown in their Figs. 8 and 9. Here, however, we are able to reveal the frequency dependence of the power and occurrence of the differing echo types. We separate the observations into three Doppler shift regimes corresponding to the low, CS, and super-CS populations:
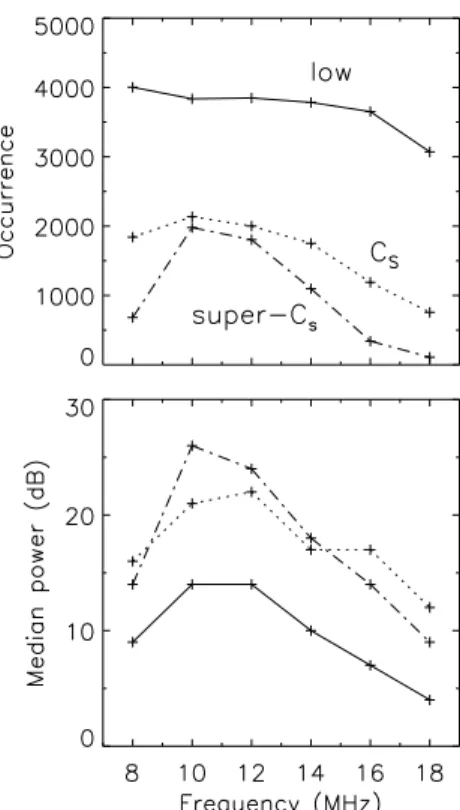
|ν| <250 m s−1,250 < ν < 550 m s−1,and ν > 550 m s−1. Figure 7 presents the frequency dependence of the relative occurrence of echoes and the median power for each of these populations, where the occurrence in the 10 MHz frequency band has been divided by 5, to account for sampling dif-ferences. The low Doppler shift echoes are the most pop-ulous, with only a slight decrease in occurrence with increas-ing frequency, down 75% over the frequency range. About half as common are the CS echoes, though their occurrence
drops to 35% of their peak as frequency increases. At 10 and 12 MHz super-CS are almost as common as CS echoes.
However, their occurrence is greatly reduced in the other fre-quency bands, and they are almost nonexistent at 18 MHz. The median powers of all three populations increase between 8 and 10 MHz, after which there is a tendency for power to decrease with increasing frequency. The depressed
pow-Fig. 7. Frequency variation of occurrence (top panel) and median
power (bottom panel) of the low Doppler shift, CS and super-CS echo populations.
ers at 8 MHz are probably related to the high absorption of the radar signals in the D-region, which falls as the in-verse square of the radar frequency. On the other hand, the large decrease in the super-CS echo occurrence and power
at 8 MHz suggests perhaps that this down-turn is also due to a decrease in backscatter cross section of this population. The variation of power with frequency of the low Doppler shift population is similar to that of the CS echoes, though
the latter are greater by approximately 8 dB. Between 10 and 14 MHz, the super-CS echoes are of the greatest power of
all three populations, though the decrease with frequency is the steepest of all. Overall, the occurrence and power varia-tion of the super-CSpopulation would appear to explain the
dearth of such echoes at VHF frequencies. 3.3 Two-component echoes (TWOPEEs)
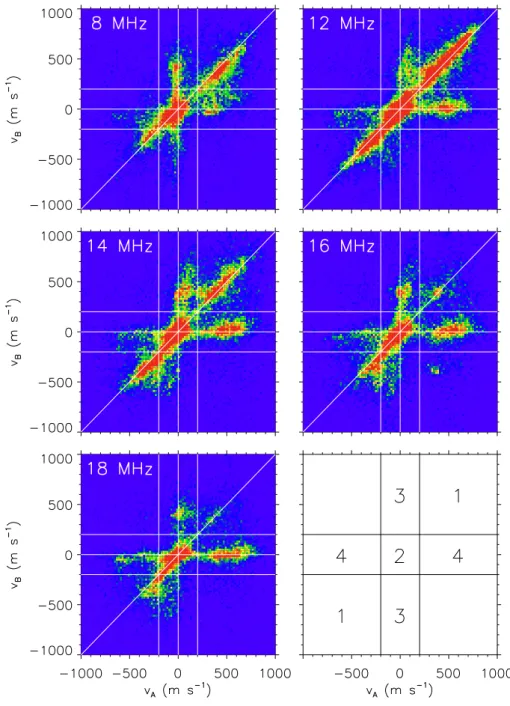
We now turn to a direct comparison of Doppler shifts ob-served at different frequencies. By comparing simultaneous and co-located measurements of echo characteristics in the two stereo channels, we can form occurrence distributions of the Doppler shift at 10 MHz compared with the Doppler shift in the other frequency bands. These distributions are shown in Fig. 8, one panel for each frequency band sounded by channel B. The colour-coding shows the density of points within the distribution plane, with red representing the great-est density. To aid discussion, regions of the distribution plane are labeled in the bottom right-hand corner of Fig. 8. Several populations of points are seen in the distributions.
The majority of points reveal a close association between ve-locities measured in the two channels, that is fall in regions 1 and 2 of the distributions. However, a significant propor-tion of the points fall in regions 3 and 4 of the distribupropor-tion, that is where a high Doppler shift is measured on channel B and a low Doppler shift on channel A (region 3) or vice versa (region 4). That these points form distinct populations in re-gions 3 and 4 mirrors the distinction between high and low Doppler shift echoes found in Fig. 4. Although these pop-ulations are most apparent in the eastward electrojet (posi-tive velocities), they are present in the westward electrojet as well. In Fig. 8 we have superimposed horizontal and verti-cal lines to draw a distinction between high and low Doppler shifts, employing a threshold of 200 m s−1. We now make a further distinction between regions 1 and 2: although these points show a rough equality of velocity, region 1 represents high Doppler shift echoes measured on both channel A and B, and region 2 represents low Doppler shifts measured on the two channels.
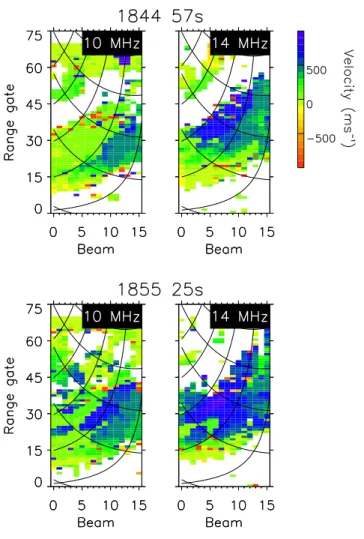
To demonstrate more clearly how the two channels can observe high and low Doppler shift echoes simultaneously in the same location, Fig. 9 presents backscatter observations from two scans starting at 18:44:57 UT and 18:55:25 UT, when channel A was sounding at 10 MHz and channel B at 14 MHz. Lines which curve from the bottom-left to top-right represent lines of geomagnetic latitude from 66◦ to 74◦ in steps of 2◦and lines which curve from top-left to bottom-right represent lines of geomagnetic longitude in steps of 5◦. E-region backscatter features are those which occur below a latitude of 70◦. The echo regions curve from bottom-left to top-right, indicating that they are roughly L-shell aligned, as discussed previously by Milan and Lester (2001). In both scans, both channels A and B observe backscatter in the same locations, though the Doppler shift characteristics depend on frequency. During the first scan indicated, both channel A and B observed a very similar pattern of line-of-sight veloc-ities in the lower portion of the E-region backscatter, that is between approximately 66◦and 68◦latitude. However, pole-ward of this, between 68◦and 70◦latitude, considerable dif-ferences are observed: at 10 MHz on channel A Doppler ve-locities below 200 m s−1are measured, whereas on channel B at 14 MHz Doppler velocities in excess of 400 m s−1are seen. In other words, there are two distinct regions within the backscatter, in one of which observations are broadly similar at the two frequencies, and in the other of which the low Doppler shift population is observed at 10 MHz and the high Doppler shift population at 14 MHz. Close examina-tion of the observaexamina-tions indicates that there are also regions where low Doppler shifts are seen on channel B and high Doppler shifts on channel A. Figure 10 shows the compari-son of Doppler shifts observed in the two channels from this scan, in a similar format to Fig. 8. The grouping of points in the regions described above is clear. In the second exam-ple shown in Fig. 9, the pattern and mix of Dopexam-pler shifts in the two channels are more complicated. However, Fig. 10 demonstrates that exactly the same relationship between high and low Doppler shift populations exists.
Fig. 8. Occurrence distributions showing the relationship between Doppler shift measured on channel A(νA)at 10 MHz with Doppler shift
measured on channel B(νB)in each of the five channel B frequency bands. Red indicates greatest occurrence. The bottom right-hand panel numbers different regions of the distribution plane to aid discussion.
Our observations suggest that throughout the electrojet re-gions the E-region ionosphere is stratified into two altitude regimes. Low Doppler shift echoes are scattered from the lower stratum, and high Doppler shift echoes from the up-per stratum. Different radar frequencies can pick out scatter from one or the other of the strata, depending on the alti-tude at which the orthogonality condition is met, which, in turn, depends upon the level of refraction in the ionosphere. This raises the possibility that, if the orthogonality condition is met over a range of altitudes, then high and low Doppler shift components should be observed in the same echo spec-trum, and this is indeed found to be the case. Figure 11 shows
the echo spectra from the first scan, 18:44:57 UT, of Fig. 9. Here we concentrate solely on range gates 25 to 32, that por-tion of the field-of-view in which some of the most signif-icant differences between channels A and B are observed. The spectra are shown self-normalized, in the Doppler shift range 1000 m s−1, vertical lines indicating 0 m s−1. Exami-nation of the channel A spectra indicate that they comprise, in general, only a single main peak. To the left of the field-of-view, they display a small Doppler shift, though to the right the Doppler shift approaches the ion-acoustic speed, CS. In
contrast, the channel B spectra to the left of the field-of-view tend to show two components, one at low and the other at
Fig. 9. (Top panels) Doppler shift measurements on channel A and B (10 and 14 MHz, respectively) from the scan starting 18:44:57 UT. Superimposed curves show constant geomagnetic lon-gitude (top-left to right) and latitude (top-right to bottom-left). Latitudes are 66◦, 68◦, 70◦, 72◦and 74◦. (Bottom panels) Similar to above, though for the scan starting 18:55:25 UT.
high Doppler shifts. To the right of the field-of-view, pre-dominantly single-peaked, high Doppler shift spectra are ob-served similar to channel A, though in some radar cells there is again evidence for a low Doppler shift component.
Thus, even at a single frequency, two components can be observed in each spectrum, indicating that backscatter is ob-served from a range of altitudes. The relative intensity of the two components will depend on the altitudes at which the orthogonality condition is met (keeping in mind that scat-ter may also occur from slightly off-orthogonal irregulari-ties), on the backscatter cross section of the irregularities at each altitude, and on the amount of focusing the radar beam has experienced at each altitude. The first and last of these will depend greatly on radar frequency and propagation path, leading to the variations observed between channels in Fig. 9. Comparing Figs. 9 and 11 it is clear that when two peaks are present in the echo spectra the SuperDARN ACF anal-ysis technique picks out the velocity of the component with the highest power. The spectral width parameter that is
de-Fig. 10. Similar to de-Fig. 8, showing a comparison of Doppler shifts
measured on channels A and B for the two scans presented in Fig. 9.
duced, however, tends to be related to the separation of the peaks, and not of the width of the main peak. Thus, great care must be taken when interpreting HF radar spectral width in the context of instability mechanisms. Re-examination of other myopic campaign observations indicates that such two-component spectra are a common and characteristic fea-ture of E-region echoes, and for this reason we give them the name “two-peak E-region echoes” or TWOPEEs.
Returning to Fig. 10 (and also Fig. 8), there is some sug-gestion in the region 3 and 4 populations that there exists a relationship between νA and νB. This is not surprising, as
the instability mechanisms giving rise to the irregularities re-sponsible for both the high and low Doppler shift echoes will be in part driven by the background electric field, which is in-dependent of altitude. To a first approximation, in region 3:
νA ≈0.1νB; in region 4: νB ≈0.1νA. However, the two
re-gions are not exactly symmetrical, and in region 4 it appears that νB can be negative when νAis positive, and vice versa
in region 3. This implies that there may be an angular offset in the preferred directions of irregularity phase propagation at different altitudes.
Next we investigate the flow angle characteristics of the observed Doppler shifts, that is the variation of Doppler shift with the angle between the radar look-direction and the elec-tron drift, assuming that the elecelec-tron drift in the electrojet regions is approximately zonal. In Fig. 12, for the two scans of Fig. 9, the Doppler shift is shown as a function of L-shell angle, φ, the angle between the radar beam and the local L-shell at each point within the radar field-of-view. Low values of φ, where the radar beams are directed along L-shells, cor-respond to the eastern portion of the field-of-view; in more westerly beams φ tends to higher values, i.e. the beams look across the electrojet flow. Several echo populations are found in the distributions, consistent with previous studies, and readers are directed to Milan and Lester (2001) for a preliminary discussion of such figures. In channel A, both low and high Doppler shift echoes are seen, the high Doppler shifts clustering near values of CS(∼ 400 m s−1)and being
present only at lower L-shell angles (φ < 30◦). In channel B, fewer low Doppler shift echoes are observed, but a new higher Doppler shift population is present at high L-shell
an-Fig. 11. Doppler spectra of echoes observed on channel A (top panel) and B (bottom panel) for the scan starting 18:44:57 UT, as shown at
the top of Fig. 9. Each spectrum is shown self-normalized, in the velocity range ±1000 ms−1.
gles (φ > 30◦). Arrows indicate those points which have low Doppler shifts in channel A but high Doppler shifts in channel B.
As before, we can separate our high Doppler shift observa-tions into two categories, those with Doppler shifts near the ion-acoustic speed at low flow angles and those with Doppler shifts in excess of the ion-acoustic speed at higher flow an-gles, the CS and super-CS populations, respectively. These
latter echoes tend to be seen when looking significantly across the electrojet flow. Milan and Lester (2001) showed, as do our Figs. 5 and 6, that those echoes with Doppler shifts near CShave narrow spectra (type I); those with higher
Doppler shifts are broader and of higher backscatter power. In addition to these echoes, the low Doppler shift popula-tion is seen across all flow angles, and tends to have broader spectra (type II).
3.4 Frequency dependence of Doppler shift
Finally, we turn to the frequency-dependence of the high Doppler shift echoes. Examination of Fig. 8 shows that when high Doppler shift echoes are observed in both channels A and B simultaneously (region 1 of the distributions), echoes recorded by the higher frequency channel tend to be of higher velocity. This effect is relatively small, but can be seen most clearly by comparing the 8 and 12 MHz panels of Fig. 8. To quantify the effect, we select all points from region 1 and form occurrence distributions of the ratio νB/νA, as shown
in Fig. 13. Although the distributions are quite broad, there is a clear offset from νB/νA = 1 at each frequency.
Best-fit Gaussian curves are superimposed on each distribution to help identify the offset, which is shown as a function of frequency in the bottom right-hand panel. This reveals that the velocity of the high Doppler shift population tends to in-crease as a function of radar frequency, or in other words, with increasing irregularity k.
4 Discussion
Original studies of the spectral shapes of VHF radar backscatter echoes from the E-region found two dominant forms (e.g. Balsley and Ecklund, 1972; Haldoupis, 1989; Sahr and Fejer, 1996; and references therein): type I spectra, narrow with Doppler shifts close to the ion-acoustic speed, believed to be echoes from two-stream waves; and broader, slower type II echoes, thought to be scattered from gradient drift waves. Types III (ν ≈ 0.5CS)and IV (ν > CS)were
also identified, but these are much rarer. More recent exper-iments conducted at HF frequencies (Hanuise et al., 1991; Villain et al., 1987, 1990; Milan and Lester, 1999, 2001; Milan et al., 2001, 2002) indicate that similarities and dis-similarities exist for echoes from E-region irregularities with decametre wavelengths. For instance, both type I and type II spectra can be identified, but also a significant proportion of echoes with Doppler shifts in excess of the ion-acoustic
speed are observed. Differences are to be expected for two main reasons. First, theory predicts this. For instance, elec-tron density gradients are expected to influence the irregu-larity characteristics more at decametre wavelengths than at metre wavelengths, modifying the threshold conditions for irregularity generation (e.g. Fejer et al., 1984). Second, re-fraction of HF radar signals in the ionosphere means that orthogonality with the magnetic field can be achieved over a range of altitudes, whereas VHF radars are constrained to almost line-of-sight geometries. If HF radars can access different heights within the E-region, then different ambi-ent conditions and possibly instability mechanisms will be probed. Reflecting this range of possible effects, the super-ion-acoustic echoes identified in HF radar observations have been widely interpreted as electrostatic ion cyclotron waves in the upper E-region (Villain et al., 1987, 1990) or gradient-stabilized two-stream waves (St.-Maurice et al., 1994). One way to distinguish between these interpretations is to inves-tigate the k-dependence of the echo characteristics and com-pare with theory. An obvious method of achieving this is to conduct multi-frequency observations of E-region backscat-ter, which was the aim of the present experiment.
The present study confirms previous findings, that is backscatter echoes fall into three distinct populations, mainly defined by their Doppler shift: (a) a low Doppler shift popu-lation, in which the Doppler shift rarely exceeds 200 m s−1; (b) echoes with Doppler shifts close to the nominal ion-acoustic speed CS ≈400 m s−1, which we term CS echoes;
(c) echoes with Doppler shifts in excess of the nominal ion-acoustic speed, up to 800 m s−1, which we term the super-CS
population. The first two categories were labeled popula-tions ii and i, respectively, in the classification scheme of Milan and Lester (2001). The super-CS echoes were further
subdivided into populations iii and iv by Milan and Lester based on their flow angle dependence, which essentially rec-ognizes that super-CSechoes occur at intermediate flow
an-gles, neither looking along the electrojet flow nor across it. We take care to state that CS echoes appear at the nominal
ion-acoustic speed, as in fact we do not measure this. It is possible that super-CSechoes arise in regions where the
ion-acoustic speed is elevated above its usual value. However, we feel that the flow-angle dependence of the occurrence of super-CSechoes argues against this.
A major finding of the present study is that while low Doppler shift and CS echoes are observed across the
fre-quency range probed (8 to 18 MHz), the occurrence and backscatter power of the super-CS echoes peaks near 10 and
12 MHz. (This frequency dependence again argues against super-CSechoes being associated with elevated CS.) The
ob-vious conclusion is that this is due to a k-dependence of the scatter cross section of the irregularities responsible for the super-CS echoes, though propagation variations (refraction,
focusing, absorption, etc.) must always be kept in mind when working in the HF band. This is especially true as it appears that different echo populations originate from different alti-tudes within the E-region. This conclusion arises from our second major finding that high and low Doppler shift echoes
can be observed at the same location at different frequencies, or indeed can be simultaneously present in a single spec-trum (hence, two-peak E-region echoes or TWOPEEs). This co-location suggests that the irregularities from which these echoes scatter must be stratified. Interferometer observations in the eastward electrojet indicate that the high Doppler shift population originates at a higher altitude in the topside E-region (Fig. 5); though in the westward electrojet the obser-vations are less clear-cut. In the past, using radar measure-ments at a single frequency, Villain et al. (1987, 1990) and Milan et al. (2001, 2002) observed small, irregular patches of high Doppler shift echoes superimposed on a background of lower Doppler shift backscatter. Milan et al. (2001) re-ported interferometric measurements which suggested that the lower Doppler shifts originated from altitudes near the peak of the E-region, and higher Doppler shifts some 20 km higher, and showed echo spectra in which both high and low Doppler shift components were present. (To avoid confu-sion, Milan et al. also discussed a lower D-region population of scatterers, but these appear rare and are not of concern to the present study.) However, it was not clear from these studies that the stratified echoes co-existed over extensive re-gions of the electrojets. In principle, every echo received from the E-region can contain two velocity components aris-ing from different altitudes, but that which dominates de-pends on the radar ray-path through the ionosphere, which in turn, depends on the operating frequency. In some regard this idea is similar to the proposal of Uspensky et al. (1994, 2001) that echo characteristics are determined by the con-volution of radar propagation and irregularity characteristics integrated over a range of altitudes.
Villain et al. (1987, 1990) also observed low and high Doppler shift populations. Comparison of our Fig. 10 with Figs. 3, 4 and 6 of Villain et al. (1987) indicates very close accord in the flow angle characteristics observed: a low Doppler shift population in which velocity decreases with increasing flow angle, a population of echoes with Doppler shifts near CS at low flow angles, and a population of
super-CS echoes at intermediate flow angles. Milan and Lester
(2001) showed that this pattern is reproduced in almost all HF radar E-region observations. Villain et al. (1987, 1990) attributed the low Doppler shift population to gradient drift waves, and the CS and super-CS echoes to two-stream and
electrostatic ion cyclotron waves, respectively. In this inter-pretation, the velocity of the low Doppler shift echoes should be close to the line-of-sight component of the electron drift in the electrojet, that is (E/B) cos θ , where θ is the flow an-gle, which is equal to the L-shell angle φ defined above if the flow is zonal. In regions where this exceeds the ion-acoustic speed two-stream waves should be generated, in which case the line-of-sight velocity should saturate at CS(such regions
are said to be within the “cone of instability”). However, in neither our example, nor those of Villain et al. does the velocity of the low Doppler shift echoes approach the ion-acoustic speed (suggesting convection electric field of the or-der of 10 mV m−1and less), and hence, no points within the radar field-of-view should be within the cone of instability.
Fig. 12. Doppler shift as a function of L-shell angle, φ, for the scans shown in Fig. 9. Superimposed are dashed curves indicating νlos =
1100 cos(φ − 15◦).
For this reason Villain et al. suggested that the two-stream and ion cyclotron waves were generated in regions of sub-critical electric field, and postulated that field-aligned elec-tron drifts must be present to drive the E-region unstable.
However, it seems doubtful to us that the electric field should always be so low during these measurements (and the much more extensive data set of Milan and Lester, 2001), as electrojet electric fields of many 10 s of mV m−1 are com-mon. Consequently, it seems sensible to suggest that the velocity of the low Doppler shift echoes is depressed sig-nificantly below the line-of-sight component of the elec-tron drift. As CS echoes are only observed at low flow
angles these may indeed be within the cone of instabil-ity. If this is the case, it is straightforward to place a lower threshold on the background electric field: looking to Fig. 12, CS echoes are observed for φ < 30◦,
suggest-ing that E/B ≥ 400/ cos 30◦ ≈ 500 m s−1, corresponding to E ≈ 25 mV m−1. With this electric field, however, the
super-CS echoes still have Doppler shifts in excess of the
line-of-sight component of the electron drift. Unless field-parallel drifts are to be invoked to drive these, they also place a lower threshold on the electric field, though in this case of the order of 50 mV m−1.
Clearly, a knowledge of the background electric field is desirable. Unfortunately, electric field measurements co-located with the E-region backscatter are difficult to acquire due to a lack of suitable instrumentation within the Iceland East radar field-of-view. Overpassing satellites could provide such information, and this we intend to feature in a future study. For the present, however, we can estimate the elec-tric field from measurements made nearby, by the Finland leg of the CUTLASS system. Figure 14a shows the Finland and Iceland East radar fields-of-view at 18:45 UT (see also Fig. 9) in a magnetic latitude and local time coordinate sys-tem. The Finland radar is operating with the normal range resolution of 45 km and a scan time of 1 min. All backscatter
Fig. 13. Occurrence distributions of the ratio νB/νAfor high-Doppler shift echoes of Fig. 8 (region 1). Superimposed on each is a
best-fit Gaussian (dashed curve). (Bottom right) The variation of νB/νAwith radar frequency (solid curve and crosses). Superimposed is the
expected variation for electrostatic ion cyclotron waves (dot-dashed curve).
observed by the Finland radar at this time is scattered from the F-region, and as a consequence, provides an accurate measure of the line-of-sight component of the plasma drift velocity E/B. Throughout the field-of-view the Doppler shifts are consistent with westward return convection flow, as expected in the eastward electrojet region, that is plasma drift towards and away from the radar in eastward- and westward-pointing beams, respectively. Here we concentrate on the flow measured below 70◦latitude, at similar latitudes to the E-region backscatter observed by the Iceland radar. Fig-ure 14b shows the line-of-sight velocity for all echoes be-low 70◦ latitude plotted as a function of L-shell angle. In addition, Fig. 14a shows a small patch of F-region echoes in the far ranges of the eastward-pointing beams of the Iceland radar field-of-view (purple patch). These eastward-pointing beams should measure almost the full magnitude of the
re-turn flow, and indeed these echoes have Doppler shifts of the order of 1100 m s−1 (see also Fig. 14b). If the convection flow is uniform across this region, then a cosine dependence in the line-of-sight velocities is expected, as demonstrated by the fit-by-eye cosine curve (dashed line). This fit suggests a flow speed near 1100 ms−1, rotated from the L-shell direc-tion by approximately 15◦. Hence, we can be quite confi-dent that the electric field in the return flow region is in ex-cess of 50 mV m−1. In this case, field-aligned plasma drift is not necessary for the generation of CS or super-CSE-region
echoes. Dashed curves in Fig. 12 indicate the line-of-sight component of E/B, demonstrating that all E-region echoes have Doppler shifts below this. This further shows that the Doppler shifts of the super-CSechoes appear to follow a
sim-ilar cosine dependence, but are depressed below it by a few hundred m s−1.
Fig. 14. (a) Magnetic latitude and MLT plot of Doppler shift observed in channel A of the Iceland East radar for the scan starting 18:44:57 UT
(top left), and simultaneous observations from the Finland radar (bottom left). Dashed lines show the extent of the statistical auroral oval. (b) Doppler shift as a function of L-shell angle for the Finland and Iceland East F-region observations below 70◦magnetic latitude. Superimposed is a dashed curve indicating νlos=1100 cos(φ − 15◦).
Even so, other problems emerge with the ion cyclotron wave interpretation of the super-CS echoes. The velocity
of these echoes shows a distinct flow angle dependence, but the dispersion relationship of ion cyclotron waves, ω2r = 2i +k2CS2(where ωr is the real part of the wave frequency
and i is the gyrofrequency of the relevant ion species),
sug-gests that their phase speed (ωr/ k) should be independent
of look-direction. It is also not clear why the maximum in the velocity of these high Doppler shift echoes always ap-pears at intermediate flow angles, as in the present obser-vations and those of Villain et al. (1987, 1990) and Milan and Lester (2001). Furthermore, the dispersion relationship suggests that the phase velocity of the EIC waves should
de-crease with increasing k (see curve superimposed on Fig. 13), whereas the present observations suggest the opposite depen-dence.
Interpretation of these echoes in terms of gradient-stabilized or gradient-degradient-stabilized two-stream waves is also problematic. Depending on the orientation of gradients in electron density with respect to the magnetic and electric fields, the threshold electric field for generation of two-stream waves (and hence also their phase velocity) can be significantly enhanced or depressed (e.g. Fejer et al., 1984). Horizontal and vertical electron density gradients were im-plicated in this process by St.-Maurice et al. (1994) and Hal-doupis et al. (2000), respectively. The latter case is
espe-cially attractive as a strong upward vertical electron density gradient is always present at the bottom of the E-layer and a downward gradient is often present at the top of the layer (Haldoupis et al., 2000). This could automatically explain the altitude-stratification of the echoes observed. In the east-ward electrojet, where the convection electric field points northwards, the gradient in the bottomside E-region should destabilize the ionosphere such that irregularities are gener-ated at threshold velocities significantly below CS. In the
topside E-region the gradient should stabilize the ionosphere, and threshold velocities above CS are necessary to produce
irregularities. This is perhaps consistent with the observa-tions in the eastward electrojet on the night of 14–15 De-cember. In the westward electrojet, where the electric field points southwards, the situation should be reversed such that the top- and bottom-sides of the E-region are destabilized and stabilized, respectively. We have no clear evidence for this reversed stratification, and previous studies have always shown high Doppler shifts to originate from higher altitudes (Milan et al., 2001). Two additional problems arise. The effect of the gradient on the instability threshold should de-crease with increasing k (for this reason it is not expected to be significant for VHF observations), opposite to the depen-dence observed. Also, the exact geometry of magnetic field, electric field, radar wave vector, and electron density gradi-ent which gives rise to the observed flow angle dependence of Doppler shift is difficult to envisage as the de/stabilization is expected to maximize for radar look-directions along the electrojet flow, inconsistent with the observations. This has been discussed with specific attention to horizontal gradients by Milan and Lester (2001), though the argument equally ap-plies to vertical gradients.
An alternative cause for the low Doppler shift echo pop-ulation, significantly depressed below the line-of-sight com-ponent of the electron drift, is that they appear at lower alti-tudes than suggested by our interferometric measurements. The dispersion relationship of gradient drift waves gives
ωr = kVdcos θ/(1 + 9) , where Vd is the relative drift
between electrons and ions (we assume ions are station-ary), θ is the flow angle as before, and 9 depends on the ratio of the ion and electron collision and gyrofrequencies
9 = νeνi/ ei (for field-aligned irregularities). 9
in-creases with decreasing altitude, such that in the lower E-region, say near 90 km it can approach values of 10. In this case the phase speed of the irregularities (ωr/ k)would be
suppressed to approximately 10% of the electron drift, as ob-served. Further work would be required to understand why we should receive echoes so frequently from so low in the E-region. Alternatively, 9 also increases at high aspect angles, that is for irregularities that are not exactly aligned along the magnetic field.
Finally, we note one last possible explanation for the increase in Doppler shift with radar frequency: at higher frequencies the scatter may originate from higher altitudes within the E-region, that is at altitudes where the ambi-ent ion-acoustic speed is greater. Radar backscatter is ob-served where the radar beam approaches orthogonality with
the magnetic field. As the magnetic field points essentially vertically at polar latitudes, the radar beam must be refracted to close to its reflection criterion at the point where scatter is detected. As discussed by Milan and Lester (2001), ground scatter is frequently observed at twice the range of E-region ionospheric, supporting this assertion. It is well known that the altitude of reflection within the ionosphere depends on radio frequency, such that higher frequencies are reflected at higher altitudes where the electron density is greater. Thus, the altitude from which backscatter is received could tend to be somewhat greater at the higher frequencies, probing alti-tudes where the ambient ion-acoustic speed is also higher. In this case, the trend to higher Doppler shifts at higher frequen-cies could be due more to propagation considerations than a
k-dependence of the plasma instabilities.
5 Summary and conclusions
Multi-frequency HF radar observations of backscatter from the E-region within the auroral electrojets show that echo spectra tend to contain both a low and a high Doppler shift component, though often one or the other component dom-inates. We term such spectra two-peak E-region echoes or TWOPEEs. In the eastward electrojet high Doppler shift echoes appear to originate from a higher altitude than low Doppler shift echoes; the situation is less clear in the west-ward electrojet. At low flow angles, when the radar is pointing roughly zonally along the direction of electrojet flow, echoes are narrow and Doppler shifted to near the ion-acoustic speed, the characteristics of type I waves observed by VHF radars. At greater flow angles, though still within the “cone of instability” of two-stream waves, two echo pop-ulations are seen, both broader, and with high (greater than
CS) and low (generally less than 200 m s−1) Doppler shifts.
The former would be identified as type IV and the latter a mixture of types II and III in VHF nomenclature. The max-imum Doppler shifts observed in electrojet backscatter, the super-CSechoes, do not occur when looking along the
direc-tion of electron drift, but at intermediate flow angles near 45◦ (see also Milan and Lester, 2001). At 10 and 12 MHz these echoes have the greatest backscatter power of all electrojet returns, though their cross section appears to fall off steeply at higher and lower frequencies. This frequency dependence argues against such echoes arising in regions where the ion-acoustic speed is elevated due to heating, an effect which should not depend on the wavelength of the diagnostic ra-dio wave. Plasma drift measurements from the Finland radar suggest that the background electric field is sufficient to ac-count for the high Doppler shifts observed, and field-aligned electron motions are not required.
It has previously been postulated that the low Doppler shift population, as type II echoes scattered from gradient drift waves, give the line-of-sight component of the electron drift velocity or E/B from which the background electric field can easily be estimated (e.g. Villain et al., 1987, 1990). How-ever, our present observations suggest that they give a gross
underestimate of the electric field. We speculate that these echoes may arise in the destabilizing electron density gradi-ent presgradi-ent at the bottom of the E-layer in the eastward elec-trojet, in a manner similar to that described by Haldoupis et al. (2000), or may arise at low altitudes where 9 is large. A stabilizing gradient, giving rise to super-CS echoes could
also be present at the top of the E-layer. It is not clear why these echoes should only appear at intermediate flow angles unless they are secondary waves of some sort. Also, the
k-dependence of the Doppler shift of the super-CS echoes,
an increase in velocity with increasing k, seems inconsistent with the expected wave characteristics.
To fully resolve this issue, co-located measurements of the electric field are necessary. We propose to employ low-Earth orbit satellites such as FAST and DMSP to provide electric field measurements over the electrojet regions and within the field-of-view of the Iceland East radar, and thus to determine the true relationship between E and Doppler shift.
Acknowledgements. CUTLASS is supported by the Particle
Physics and Astronomy Research Council (PPARC grant no. PPA/R/R/1997/00256), UK, the Swedish Institute for Space Physics, Uppsala, and the Finnish Meteorological Institute, Helsinki.
The Editor in Chief thanks M. Uspensky and another referee for their help in evaluating this paper.
References
Balsley, B. B. and Ecklund, W. L.: VHF power spectra of the radar aurora, J. Geophys. Res, 77, 4746–4760, 1972.
Fejer, B. G., Providakes, J., and Farley, D. T.: Theory of plasma waves in the auroral E-region, J. Geophys. Res., 89, 7487–7494, 1984.
Foster, J. C. and Erickson, P. J.: Simultaneous observations of E-region coherent backscatter and electric field amplitude at F-region heights with the Millstone Hill UHF radar, Geophys. Res. Lett., 27, 3177–3180, 2000.
Greenwald, R. A., Baker, K. B., Dudeney, J. R., Pinnock, M., Jones, T. B., Thomas, E. C., Villain, J.-P., Cerisier, J.-C., Senior, C., Hanuise, C., Hunsucker, R. D., Sofko, G., Koehler, J., Nielsen, E., Pellinen, R., Walker, A. D. M., Sato, N., and Yamagishi, H.: DARN/SuperDARN: A global view of the dynamics of high-latitude convection, Space Sci. Rev., 71, 761–796, 1995. Haldoupis, C.: A review on radio studies of the auroral E-region
ionospheric irregularities, Ann. Geophysicae, 7, 239–258, 1989. Haldoupis, C., Schlegel, K., and Hussey, G.: Auroral E-region elec-tron density gradients measured with EISCAT, Ann. Geophysi-cae, 18, 1172–1181, 2000.
Hall, G. E., MacDougall, J. W., Moorcroft, D. R., St.-Maurice, J.-P., Manson, A. H., and Meek, C. E.: Super Dual Auroral Radar Network observations of meteor echoes, J. Geophys. Res., 102, 14 603–14 614, 1997.
Hanuise, C., Villain, J.-P., Cerisier, J.-C., Senior, C., Ruohoniemi, J. M., Greenwald, R. A., and Baker, K. B.: Statistical study of high-latitude E-region Doppler spectra obtained with the SHERPA
HF radar, Ann. Geophysicae, 9, 273–285, 1991.
Hanuise, C., Villain, J.-P., Gresillon, D., Cabrit, B., Greenwald, R. A., and Baker, K. B.: Interpretation of HF radar ionospheric Doppler spectra by collective wave scattering theory, Ann. Geo-physicae, 11, 29–39, 1993.
Keys, J. G. and Johnston, P. V.: Radio aurora dynamics as seen by Doppler radar, Geophys. Res. Lett., 6, 97–100, 1979.
Koustov, A. V., Danskin, D. W., Uspensky, M. V., Ogawa, T., Jan-hunen, P., Nishitani, N., Nozawa, S., Lester, M., and Milan, S.: Velocities of auroral coherent echoes at 12 and 144 MHz, Ann. Geophysicae, 20, 1647–1661, 2002.
Milan, S. E., Jones, T. B., Robinson, T. R., Thomas, E. C., and Yeoman, T. K.: Interferometric evidence for the observation of ground backscatter originating behind the CUTLASS coherent HF radars, Ann. Geophysicae, 15, 29–39, 1997.
Milan, S. E. and Lester, M.: Spectral and flow angle characteristics of backscatter from decametre irregularities in the auroral elec-trojets, Adv. Space Res., 23, 1773–1776, 1999.
Milan, S. E. and Lester, M.: A classification of spectral populations observed in HF radar backscatter from the E-region electrojets, Ann. Geophysicae, 19, 189–204, 2001.
Milan, S. E., Lester, M., Sato, N., and Takizawa, H.: On the al-titude dependence of the spectral characteristics of decametre-wavelength E-region backscatter and the relationship with opti-cal auroral forms, Ann. Geophysicae, 19, 205–217, 2001. Milan, S. E., Sato, N., Lester, M., Yeoman, T. K., Murata, Y.,
Doi, H., and Saemundsson, T.: The spectral characteristics of E-region radar echoes co-located with and adjacent to visual au-roral arcs, Ann. Geophysicae, 20, 795–805, 2002.
Sahr, J. D. and Fejer, G. F.: Auroral electrojet plasma irregularity theory and experiment: A critical review of present understand-ing and future directions, J. Geophys. Res., 101, 26 893–26 909, 1996.
St.-Maurice, J.-P., Prikryl, P., Danskin, D. W., Hamza, A. M., Sofko, G. J., Koehler, J. A., Kustov, A., and Chen, J.: On the origin of narrow non-ion-acoustic coherent radar spectra in the high-latitude E-region, J. Geophys. Res., 99, 6447–6474, 1994. Uspensky, M. V., Koustov, A. V., Eglitis, P., Huuskonen, A., Milan,
S. E., Pulkkinen, T., and Pirjola, R.: CUTLASS HF radar obser-vations of high-velocity E-region echoes, Ann. Geophysicae, 19, 411–424, 2001.
Uspensky, M. V., Kustov, A. V., Sofko, G. J., Koehler, J. A., Villain, J.-P., Hanuise, C., Ruohoniemi, J. M., and Williams, P. J. S.: Ionospheric refraction effects in slant range profiles or auroral HF coherent echoes, Radio Sci., 29, 503–517, 1994.
Villain, J.-P., Greenwald, R. A., Baker, K. B., and Ruohoniemi, J. M.: HF radar observations of E-region plasma irregularities produced by oblique electron streaming, J. Geophys. Res., 92, 12 327–12 342, 1987.
Villain, J.-P., Hanuise, C., Greenwald, R. A., Baker, K. B., and Ruohoniemi, J. M.: Obliquely propagating ion acoustic waves in the auroral E-region: Further evidence of irregularity produc-tion by field-aligned electron streaming, J. Geophys. Res., 95, 7833–7846, 1990.
Watermann, J., McNamara, A. G., Sofko, G. J., and Koehler, J. A.: Distribution of mean Doppler shift, spectral width, and skewness of coherent 50-MHz auroral radar backscatter, J. Geophys. Res., 94, 6979–6985, 1989.