HAL Id: inserm-02461791
https://www.hal.inserm.fr/inserm-02461791
Submitted on 30 Jan 2020HAL is a multi-disciplinary open access archive for the deposit and dissemination of sci-entific research documents, whether they are pub-lished or not. The documents may come from teaching and research institutions in France or abroad, or from public or private research centers.
L’archive ouverte pluridisciplinaire HAL, est destinée au dépôt et à la diffusion de documents scientifiques de niveau recherche, publiés ou non, émanant des établissements d’enseignement et de recherche français ou étrangers, des laboratoires publics ou privés.
Which modifiable prenatal factors mediate the relation
between socio-economic position and a child’s weight
and length at birth?
Morgane Ballon, Jérémie Botton, Anne Forhan, B de Lauzon-Guillain,
Blandine Lauzon-guillain, Maria Melchior, Fabienne El Khoury, Aurelie
Nakamura, Marie Aline Charles, Sandrine Lioret, et al.
To cite this version:
Morgane Ballon, Jérémie Botton, Anne Forhan, B de Lauzon-Guillain, Blandine Lauzon-guillain, et al.. Which modifiable prenatal factors mediate the relation between socio-economic position and a child’s weight and length at birth?. Maternal and Child Nutrition, Wiley, 2019, 15 (4), pp.e12878. �10.1111/mcn.12878�. �inserm-02461791�
1 Which modifiable prenatal factors mediate the relation between socioeconomic position 1
and a child’s weight and length at birth? 2
M Ballon1,2, J Botton1,2,3, A Forhan1,2, B de Lauzon-Guillain1,2,4, M Melchior5, F El 3
Khoury5, A Nakamura5, MA Charles1,2, S Lioret1,2*, B Heude1,2* 4
Author affiliations 5
1
Paris Descartes University, Paris, France
6
2
U1153 Centre of Research in Epidemiology and StatisticS (CRESS), EArly life Research on
7
later Health (EARoH), Villejuif, France
8
3
Faculty of pharmacy, université Paris-Sud, université Paris-Saclay, 92296
Châtenay-9
Malabry, France
10
4
INRA, U1125 Epidemiology and Biostatistics Sorbonne Paris Cité Center (CRESS), Early
11
life research on later health Team (EARoH), Paris, France
12
5
INSERM, Sorbonne Université, Pierre Louis Institute of Epidemiology and Public Health,
13
Department of Social Epidemiology, Paris, France
14
Corresponding author: Morgane Ballon, INSERM, UMR1153 Center of Epidemiology and 15
StatisticS (CRESS), Early life Research on later Health (EARoH), Bat Inserm, 16, avenue
16
Paul Vaillant Couturier, 94807 Villejuif Cedex France. morgane.ballon@inserm.fr; +033 1
17
45 59 51 78
18
* S Lioret and B Heude contributed equally to this work.
19
Short running title: Mediators of the social gradient in birth size 20
Words count for the abstract: 212
21
Words count for the main body: 3,173
22
Number of references: 37
2
Number of tables: 3 Number of figures: 2
24
ACKNOWLEDGEMENTS 25
We are extremely grateful to all the families who took part in this study, the midwives and
26
psychologists who recruited and followed them, and the whole EDEN team, including
27
research scientists, engineers, technicians and managers and especially Josiane Sahuquillo and
28
Edith Lesieux for their commitment and their role in the success of the study. We also
29
acknowledge the commitment of the members of the EDEN Mother-Child Cohort Study
30
Group: I. Annesi-Maesano, J.Y. Bernard, J. Botton, M.A. Charles, P. Dargent-Molina, B. de
31
Lauzon-Guillain, P. Ducimetière, M. de Agostini, B. Foliguet, A. Forhan, X. Fritel, A. Germa,
32
V. Goua, R. Hankard, B. Heude, M. Kaminski, B. Larroque†, N. Lelong, J. Lepeule, G.
33
Magnin, L. Marchand, C. Nabet, F Pierre, R. Slama, M.J. Saurel-Cubizolles, M. Schweitzer,
34
O. Thiebaugeorges. We thank Jo Ann Cahn for her help in preparing the manuscript.
35
CONTRIBUTORS 36
MB, SL, BH and JB conceived and designed the work, with advice from MAC. MB analyzed
37
the data with advice from BH, JB and SL. MB, BH and SL drafted and revised the
38
manuscript. All authors interpreted the data and criticized the manuscript for important
39
intellectual content. MAC and BH designed and led the EDEN mother-child cohort. AF is
40
responsible for the EDEN data management. All authors have read and approved the final
41
version of the manuscript. This article is the work of the authors. MB serves as guarantor for
42
the contents of this article. All authors had full access to all of the data (including statistical
43
reports and tables) in the study and take the responsibility for the integrity of the data and the
44
accuracy of the data analysis. All researchers are independent of the funding bodies. All
45
members in the EDEN mother-child cohort study group designed the study.
46
SOURCE OF FUNDING 47
- Fondation pour la Recherche Médicale
3
- French Ministry of Research
49
- Institut Fédératif de Recherche and Cohort Program
50
- INSERM Nutrition Research Program
51
- French Ministry of Health Perinatal Program
52
- French Agency for Environment Security (AFFSET)
53
- French National Institute for Population Health Surveillance (INVS)
54
- Paris-Sud University
55
- French National Institute for Health Education (INPES)
56
- Nestlé
57
- Mutuelle Générale de l'Éducation Nationale
58
- French Speaking Association for the Study of Diabetes and Metabolism (Alfediam)
59
- National Agency for Research (ANR nonthematic program)
60
- National Institute for Research in Public Health (IRESP TGIR Cohorte Santé 2008
61
Program)
62
The study sponsors were not involved in the study design, data collection, or data analyses.
63
CONFLICT OF INTEREST 64
None of the authors had a conflict of interest.
65 66
Abbreviations: Body Mass Index (BMI) 67 68 69 70 71 72
4 Abstract
73
Although several studies have shown a positive association between socioeconomic position
74
and size at birth, not enough is known about the modifiable factors that may be involved. We
75
aimed to investigate whether maternal prepregnancy body mass index (BMI), smoking, diet,
76
and depression during pregnancy mediate the positive association between maternal education
77
and birth size. Weight and length z-scores specific for gestational age and sex were calculated
78
for 1,500 children from the EDEN mother-child cohort. A mediation analysis of the
79
associations between maternal education and birth size was conducted with a counterfactual
80
method, adjusted for recruitment center, parity, maternal height, and age.In the comparison of
81
children of mothers with low vs. intermediate education levels, maternal smoking during
82
pregnancy explained 52% of the total effect of education on birth weight. Similar findings
83
were observed with birth length z-score (37%). The comparison of children of mothers with
84
high vs. intermediate education levels yielded a non-significant total effect, which masked
85
opposite mediating effects by maternal BMI and smoking during pregnancy on both birth
86
weight and length. Prepregnancy BMI and maternal smoking during pregnancy mediate the
87
positive association between maternal education and birth weight and length z-scores. These
88
mediators, however, act in opposite directions, thereby masking the extent to which healthy
89
prenatal growth is socially differentiated.
90
Key words: birth weight, birth length, maternal education, smoking, BMI, mediation analysis 91
92
93
5 INTRODUCTION
95
The existence of social inequalities in growth and childhood overweight in high-income
96
countries has been highlighted in recent years (Ballon et al., 2018; Barriuso et al., 2015;
97
Howe et al., 2012; McCrory et al., 2017). These inequalities are observed as early as the first
98
day of life, since positive associations have been described between socioeconomic position
99
and both weight and length at birth (Ballon et al., 2018; Howe et al., 2012; Jansen et al., 2009;
100
Mortensen, Helweg-Larsen, & Andersen, 2011). It is also well known that a lower birth
101
weight, a marker of suboptimal fetal growth, is associated with a range of short- and
long-102
term health issues, such as cardiovascular disease, diabetes, and obesity (D. J. Barker,
103
Osmond, Forsen, Kajantie, & Eriksson, 2005; Jornayvaz et al., 2016; Shenkin, Starr, & Deary,
104
2004; Zanetti et al., 2018). These findings suggest intergenerational transmission of health
105
inequalities between the mother and her offspring (Aizer & Currie, 2014; D. Barker, Barker,
106
Fleming, & Lampl, 2013). The development of interventions to prevent or reduce these social
107
inequalities in health programming requires that the modifiable factors mediating the positive
108
association between socioeconomic position and birth weight be identified.
109
Some studies have shown that prepregnancy body mass index (BMI) and smoking during
110
pregnancy mediate the association between socioeconomic position and birth weight (Gissler,
111
Merilainen, Vuori, & Hemminki, 2003; Jansen et al., 2009; van den Berg, van Eijsden,
112
Vrijkotte, & Gemke, 2012), but only one study has investigated the joint effects of both
113
factors on this birth outcome (Mortensen, Diderichsen, Smith, & Andersen, 2009). To our
114
knowledge, only one study has examined factors involved in the association between
115
socioeconomic position and length or height (Galobardes et al., 2012). This study described
116
social inequalities for both prenatal and postnatal growth within a single longitudinal model.
117
However they did not seek to identify mediators of the association between socioeconomic
118
position and birth length specifically. Although weight and length at birth are strongly
6
correlated, their separate associations with socioeconomic position may differ by age and sex
120
(Ballon et al., 2018) and thus involve different mediators. Moreover, other prenatal factors
121
remain to be studied. Indeed, healthy dietary patterns during pregnancy have been shown to
122
be positively associated with birth weight (Chia et al., 2019; Emmett, Jones, & Northstone,
123
2015). Conversely, unhealthy dietary patterns and maternal depression during pregnancy
124
have been shown to be associated with lower birth weight (Chia et al., 2019; Field, 2011).
125
One study also reported a negative association between maternal depression and birth length
126
(Field, 2011). Given that social inequalities have been described for these three factors
127
(Emmett et al., 2015; Hein et al., 2014), the latter were considered as potential mediators of
128
the relation between socioeconomic position and birth size (i.e. weight and length).
129
Recently, advanced methods for mediation analyses have been developed. In particular,
130
counterfactual approaches allow for causal inference based on observational data by
131
estimating direct and indirect effects with more power than allowed by traditional approaches
132
(Lange, Rasmussen, & Thygesen, 2013; VanderWeele & Vansteelandt, 2014). Among the
133
various existing approaches, the counterfactual method proposed by Lange et al. (Lange et al.,
134
2013) enables the simultaneous assessment of the mediating effect of several factors as well
135
as the consideration of an exposure variable in more than two categories.
136
The objective of this paper was to investigate whether any of maternal prepregnancy BMI,
137
smoking, diet, and depression during pregnancy mediate the positive association between
138
maternal education level and offspring birth size, i.e., weight and length.
139
KEY MESSAGES 140
- A positive association exists between socioeconomic position and birth weight, but less
141
research has been done on the prenatal factors involved
7
- Prepregnancy BMI and smoking during pregnancy were shown to be important mediators
143
of the positive associations between maternal education and both birth weight and birth
144
length.
145
- Other modifiable factors like dietary patterns and depressive symptoms were not shown
146
to mediate these associations.
147
- These results suggest that promoting a healthy prepregnancy weight and preventing
148
smoking during pregnancy are keys to addressing socioeconomic inequalities in healthy
149 fetal growth. 150 151 METHODS 152
Study design and participants 153
The EDEN mother-child cohort was designed to assess the pre- and postnatal determinants of
154
children’s growth, health, and development. This cohort includes 2,002 pregnant women
155
recruited in two French maternity hospitals (in Poitiers and Nancy) between 2003 and 2006.
156
Exclusion criteria were multiple pregnancies, known diabetes, illiteracy, and intention to give
157
birth elsewhere than these two university hospitals or to move outside the region within 3
158
years. Due to the mode of recruitment and the selective acceptance of participation, urban and
159
well-educated mothers are over-represented in the EDEN study compared to the national
160
population (Heude et al., 2016). Details of the study protocol have been published elsewhere
161
(Heude et al., 2016). Both parents provided written consent. The ethics committee of the
162
Kremlin-Bicêtre Hospital approved this study, which was also submitted to the national
163
commission for data protection and liberties (CNIL).
164
Measurements 165
8
Data come from obstetric and pediatric records at birth, as well as from self-reported
166
questionnaires completed by the mothers and clinical examinations undertaken at different
167
stages of follow-up.
168
Socioeconomic position
169
Maternal education level, commonly studied in relation to child birth size (Jansen et al., 2009;
170
McCrory et al., 2017; Mortensen et al., 2009) and less likely to be affected by childbearing
171
than income and occupation, was used as a proxy for socioeconomic position. Mothers were
172
asked to self-report their highest educational attainment at study inclusion. Education level
173
was categorized as low (did not complete high school), intermediate (high school diploma to
174
2-year university degree, reference category) and high (3-year university degree or more).
175
Intermediate category was chosen as the reference category in order to better disentangle the
176
mediation process when comparing one category of level education to its adjacent one.
177
Child weight and length
178
At birth, weight and length were measured by midwives with an electronic scale (Seca Ltd)
179
and a somatometer (Testut). As measurement errors are common for birth length, we used
180
predicted length at birth, obtained from growth modeling of an average of 16 measurements
181
of length/height between birth and 5 years (Botton et al., 2014; Carles et al., 2016). For
182
children without predicted data available, measured length was used instead (7%). Birth
183
weight and length z-scores specific for gestational age and sex were calculated according to
184
Audipog references (Faculté de médecine RTH Laennec Lyon, 2008).
185
Candidate mediators
186
Women self-reported their prepregnancy weight at inclusion. Maternal height was measured
187
by research midwives with a wall stadiometer (Seca 206) during clinical examinations
188
conducted between 24 and 28 weeks of gestation. Prepregnancy BMI was calculated as
189
weight (kg) divided by height (m) squared and categorized as underweight (<18.5kg/m2),
9
normal (≥18.5 and <25kg/m2), overweight (≥25 and <30kg/m2) or obese (≥30kg/m2)
191
(WHO). During the first visit with research midwives (between 24 and 28 weeks of
192
gestation), mothers reported their daily cigarette consumption and smoking habits at the
193
beginning of pregnancy (smoking in the first trimester) and their smoking status at the time of
194
the visit (smoking in the second trimester). After delivery, research midwives collected
195
similar information for smoking at the end of the third trimester of pregnancy (third trimester
196
smoking status). All this information was combined into one variable categorized as
non-197
smokers, smokers only in the first trimester, and smokers throughout pregnancy. Depressive
198
symptoms during pregnancy were assessed with the 20-item Center for Epidemiology Studies
199
Depression Scale (CES-D) (Radloff, 1977). Each response was coded between 0 and 3 points,
200
then summed into a depressive symptoms score (ranging from 0-60). Different cut-offs,
201
ranging from 16 to 23 (Henry, Grant, & Cropsey, 2018; Radloff, 1977; Vilagut, Forero,
202
Barbaglia, & Alonso, 2016), have been proposed to detect individuals with probable
203
depression. We chose the threshold of 23 to define women with depressive symptoms, as
204
suggested by a validation study for the French population (Fuhrer & Rouillon, 1989).
205
Maternal diet in the last trimester of pregnancy was assessed during the maternity ward stay
206
after delivery by a validated food frequency questionnaire (FFQ) (Deschamps et al., 2009).
207
The 137 standardized items from the FFQ have previously been synthesized by principal
208
component analysis into two dietary patterns (Yuan et al., 2017): the so-called Healthy dietary
209
pattern, characterized by a high intake of fruit, vegetables, fish, and whole grains, whereas the
210
Western dietary pattern was characterized by a high intake of processed and snacking foods.
211
These variables were considered to be continuous scores reflecting adherence to each dietary
212
pattern.
213
Other variables
10
Gestational age, maternal age, and parity were collected at birth from medical records.
215
Preterm birth (yes/no) was defined by a gestational age <37 weeks of gestation.
216
Population studied 217
Of the 1,907 children included in the EDEN cohort, 407 were excluded because of missing
218
values for any of the variables of interest, (i.e., outcomes, exposure, mediators, and
219
confounders). The final sample thus included 1,500 children.
220
Statistical methods 221
Participants included in the analysis were compared to those who were not included.
222
Characteristics of the study population were described at birth according to maternal
223
education level. The bivariate statistical analyses used chi-square tests, correlations, and
224
ANOVA analyses as appropriate.
225
The counterfactual method developed by Lange et al. (Lange et al., 2013), based on marginal
226
structural models, was used to conduct the mediation analysis. This allowed us to break down
227
the total effect of maternal education level on birth size (i.e., weight and length z-scores) into
228
natural direct and indirect effects through the candidate mediators. Based on this method, the
229
total effect can be considered as the change in z-score that would be observed if, for example,
230
maternal education level could change (e.g., from intermediate to high). The natural direct
231
effect can be considered the difference in birth z-scores for a given change in education level
232
(e.g., from intermediate to high), keeping mediators at the value they naturally take when
233
maternal education is unchanged (e.g., at the intermediate level). The natural indirect effect is
234
the difference in birth z-scores when maternal education remains unmodified, but the
235
mediators change to the value they would naturally take if maternal education were to change
236
(e.g., from intermediate to high). The validity of this statistical method depends on whether or
237
not it satisfies specific hypotheses. First, for a given mediator, there should be no unmeasured
238
confounders in associations between: 1) exposure and outcome, 2) mediator and outcome, 3)
11
exposure and mediator, 4) mediator and outcome conditional on the exposure. Second, no
240
causal associations should exist between the mediators.
241
To select candidate mediators of the association between maternal education and birth
242
outcomes, we first conducted separate mediation analyses for each of the following potential
243
mediators, selected a priori as most likely to explain this relation: maternal prepregnancy
244
BMI, smoking, depressive symptoms, and maternal dietary patterns during pregnancy. We
245
checked that they were independent of each other, conditional on the exposure and the
246
confounders in our sample, by running a multiple regression model of one mediator on the
247
others, adjusting for maternal education and the confounders. When a statistically significant
248
association was observed between candidate mediators, we used the residual method to obtain
249
independent variables and verify the model’s assumptions, by generating new variables as the
250
residuals of the regression of one mediator on the others. Simple mediation analyses were
251
then conducted with these new variables. All individually significant mediators were next
252
included in two multivariable marginal structural models to assess how they jointly mediated
253
the association between maternal education and each of the birth weight and length z-scores.
254
To obtain robust 95% confidence intervals, we used a bootstrap approach with 5,000
255
replications. Analyses were adjusted for center (i.e., Nancy or Poitiers), parity, maternal
256
height, and age.
257
Because analyses were conducted on the database with no missing data for any of the five
258
mediators (Population B, Figure 1), the first sensitivity analysis used the database with no
259
missing data for the mediators selected for the final multivariable model (Population A,
260
Figure 1). A second sensitivity analysis excluded 84 preterm infants from the sample 261
(Population C, Figure 1). SAS v9.3 (SAS Institute, Cary, NC, US) was used for all but the
262
mediation analyses, which were run under R v3.4.2 as proposed by Lange et al. (Lange et al.,
12
2013). Graphs were also plotted with R v3.4.2. Statistical significance was defined at P ≤
264 0.05. 265 RESULTS 266 Population characteristics 267
Mothers excluded from the analysis (n=407) had lower education levels and were more likely
268
to have experienced depressive symptoms or to be underweight or obese than those who were
269
included (low education level: 42.0% vs. 25.5%; depressive symptoms: 13.8% vs. 7.7%;
270
underweight: 11.2% vs. 8.0%; obesity: 12.3% vs. 7.9%). No statistically significant
271
differences were observed in birth weight and length z-scores between those included and
272
excluded.
273
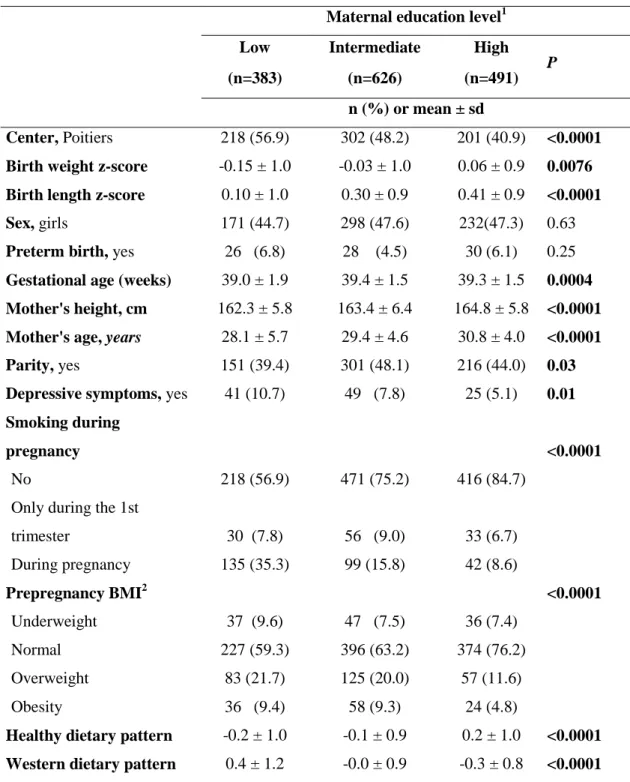
There was a positive gradient between maternal education level and both the mother’s age and
274
height and the z-scores for the child’s birth weight and length (Table 1). All candidate 275
mediators except depressive symptoms were strongly associated with both maternal education 276
level and birth size z-scores (Tables 1 & 2). 277
Simple mediation analysis 278
Prepregnancy BMI and smoking during pregnancy were mediators of the association between
279
maternal education and birth weight and length; the Western dietary pattern was a mediator of
280
the association with birth length only (Table 3). Since this dietary pattern was strongly
281
associated with prepregnancy BMI and smoking during pregnancy, we performed an
282
additional simple mediation analysis by using the residuals of its regression on BMI, smoking
283
during pregnancy, and confounders, as a new mediator. Because this new variable, which
284
assessed variability in the Western dietary pattern independent of other variables, was not
285
significant, the multiple mediation analyses used only prepregnancy BMI and smoking during
286
pregnancy.
287
Multiple mediation analyses of birth weight and length 288
13
The multiple mediation analysis of birth weight showed that the total effect of maternal
289
education level on birth weight in children of mothers with a low, compared with an
290
intermediate, education level was negative, with a -0.14 difference in z-scores (Figure 2). The
291
natural indirect effect through smoking was also negative, with a -0.07 difference. There was
292
no significant natural direct or indirect effect through prepregnancy BMI. Smoking during
293
pregnancy mediated 52% of this relation. Similar findings were observed with birth length,
294
although the percentage of mediation was lower (37%, Figure 2).
295
The comparison of children from mothers with high and with intermediate education levels
296
showed no total or direct effect of maternal education level on birth weight or length. There
297
were, however, significant natural indirect effects through smoking and BMI and they worked
298
in opposite directions for both birth weight and length (0.03 difference in z-score: positive
299
and negative, respectively); this difference explains the absence of a total effect.
300
Sensitivity analyses 301
Results were on the whole consistent when analyses were performed for the complete
302
database (Population B) for all mediators or repeated for the database with no missing items
303
on smoking and BMI only (Population A, results not shown but available on request). Results
304
remained consistent after the exclusion of children born preterm.
305
DISCUSSION 306
This study, using a validated method to assess multiple mediation, provides new and
307
comprehensive insights into modifiable prenatal mediators of the social gradient in birth size.
308
Mediators of birth weight and length 309
Dietary patterns and depressive symptoms during pregnancy did not explain the association
310
between maternal education level and birth size in this study. To our knowledge, no others
311
have investigated these two candidate mediators, although this apparent lack of literature may
312
reflect publication bias. Moreover, dietary patterns and depressive symptoms may be subject
14
to stronger measurement errors than prepregnancy BMI and smoking, which might have
314
reduced statistical power for these two candidate mediators. Indeed, CES-D measure is a
315
screening tool but not a diagnosis and dietary patterns were assessed through dietary intake
316
during the last trimester of pregnancy, which could led to a recall bias. Further research is
317
needed to confirm or infirm our findings. Perhaps stress during pregnancy, rather than
318
depression, and energy intake, rather than diet during pregnancy, explain the association
319
between maternal education and birth size.
320
Consistent with other studies (Jansen et al., 2009; Mortensen et al., 2009; van den Berg et al.,
321
2012), smoking during pregnancy mediated about 52% of the association between maternal
322
education and birth weight in the comparison of children of mothers with low, compared with
323
intermediate, education levels. The pattern of mediation was different when we compared
324
high vs. intermediate education levels: prepregnancy BMI and smoking during pregnancy
325
mediated the association of interest, but their indirect effects were in opposite directions and
326
thus cancelled each other out. Mortensen et al. also found that prepregnancy BMI and
327
smoking during pregnancy mediated in opposite directions across the entire gradient (and did
328
not differ whether low or high education levels were compared to the intermediate level)
329
(Mortensen et al., 2009). Consistent findings for mediation observed with birth length are
330
noteworthy in our study, which adds a novel and more comprehensive perspective into the
331
social patterning of birth size.
332
The method proposed by Lange et al. (Lange et al., 2013)enabled us to investigate maternal
333
education in three categories and observe differential effects in these three groups. However,
334
the lack of any mediating effect by prepregnancy BMI between the groups with low and
335
intermediate maternal education must be confirmed in cohorts with greater social variability.
336
The women in these two subgroups of the Eden cohort were very similar in terms of
337
prepregnancy BMI.
15
The fact that prepregnancy BMI and smoking during pregnancy cancelled each other out
339
should not be taken lightly. It means that a baby born to an overweight mother who smokes
340
has the same birth weight and length as another whose non-smoking mother has a normal
341
weight. In the first case, birth size would be the result of growth restriction due to exposure to
342
smoking, masked by excess growth due to maternal obesity (6% of the EDEN women
343
combined these two characteristics) and misleadingly suggests that their children's growth is
344
optimal, when it is not. For any given birth size, the distinct causes producing them are
345
expected to affect later growth, development, and health differentially. Future studies,
346
investigating metabolic biomarkers in cord blood, might provide evidence supporting (or
347
contradicting) this hypothesis.
348
Potential explanation of mechanisms involved 349
Smoking during pregnancy may affect birth size through different mechanisms. It could lead
350
to vasoconstriction and to higher maternal and fetal bloods levels of carboxyhemoglobin
351
(Wickstrom, 2007), which are responsible for fetal hypoxia. Exposure to smoking during
352
pregnancy is also suspected of modifying regulation of fetal gene expression, by altering
353
DNA methylation and microRNA expression (Knopik, Maccani, Francazio, & McGeary,
354
2012). Maternal overweight or obesity is associated with higher birth size of her offspring
355
(Gaudet, Ferraro, Wen, & Walker, 2014). Mothers with higher BMI have higher levels of
356
circulating blood glucose (Harmon et al., 2011) and lipids, so that more of these nutrients are
357
available for the fetus. Increased insulin secretion by the fetal pancreas in response to glucose
358
in turn accelerates fetal growth (Group, 2009).
359
It is noteworthy that prepregnancy BMI and smoking during pregnancy are modifiable
360
factors. As two reviews have shown, effective strategies already exist to reduce maternal BMI
361
and smoking (Johnson et al., 2016; Lancaster, Stead, Silagy, & Sowden, 2000), and the
362
consistency of our findings across birth weight and length suggests that promoting healthy
16
weight or preventing smoking during pregnancy in future mothers is likely to favorably and
364
simultaneously affect the offspring's birth weight and length.
365
Limitations and strengths 366
Study limitations include our inability to consider all potential mediators, thus we did not
367
fully explain the relation between maternal education and birth size. For example, we did not
368
take health care utilization into account, although it is hypothesized to improve fetal
369
monitoring and help prevent fetal growth anomalies. Mothers from the EDEN cohort were,
370
however, very homogeneous in this respect given the mode of inclusion at the maternity ward
371
before 24 weeks of gestation. Maternal stress during pregnancy and passive smoking (due to
372
paternal smoking), unmeasured in the current study, are other relevant mediators to explore.
373
Classification of prepregnany BMI relies on self-reported weight. Although women are likely
374
to under-estimate their prepregnancy weight, and more importantly when overweighed or
375
obese (Bannon et al., 2017), previous studies have suggested that classification of
376
prepregnancy BMI remains usually unchanged (Bannon et al., 2017; Holland, Moore Simas,
377
Doyle Curiale, Liao, & Waring, 2013). Moreover, validity of prepregnancy weight was
378
previously validated within the EDEN study using multiple pregnancy weights collected all
379
over pregnancy (Diouf et al., 2014). The presence of selection bias at inclusion, as is often the
380
case in cohort studies, has implications for the generalization of our findings. We can
381
hypothesize that a better representation of disadvantaged families at baseline would have
382
provided more variability and therefore more power to address the study objectives. Further
383
research is needed to confirm our findings on more datasets with greater social variability.
384
The method we used to conduct mediation analyses is validated and relevant. To our
385
knowledge, no dedicated codes to conduct multiple imputation have however been developed
386
to address missing data. Although there are about 20% missing data in the principal analysis,
387
sensibility analysis on Population B, which includes only 6% missing data, led to the same
17
results. Furthermore, the Lange method relies on several assumptions. Residual confounding
389
not taken into account cannot be ruled out; prepregnancy BMI and smoking during pregnancy
390
might be proxies for other factors related to unhealthy lifestyles. Our data nonetheless met the
391
principal assumption necessary for using this method: maternal smoking and prepregnancy
392
BMI were conditionally independent of maternal education level. Examining the stability of
393
estimates across the one-by-one mediation analysis, multiple mediation, and sensitivity
394
analyses shows that the results appear robust. Moreover, a clear strength of our study is that
395
data are from a prospective birth cohort and can thus identify mediators of the longitudinal
396
association between maternal education level and birth parameters. To our knowledge, this
397
study, as the first to investigate birth length, provides new insights into the existing literature.
398
Finally, unlike most mediation analyses, we investigated maternal education level in three
399
categories to examine the social gradient in birth size in more detail.
400
CONCLUSION 401
Among the modifiable factors examined, dietary patterns and depressive symptoms did not
402
mediate the positive association between maternal education and birth weight and length
403
while prepregnancy BMI and maternal smoking during pregnancy did so. The latter two
404
factors, however, act in opposite directions and thus mask the extent to which prenatal growth
405
is socially differentiated. Although these original findings need to be replicated in more
406
socially diverse samples, they suggest that promoting a healthy prepregnancy weight and
407
preventing smoking during pregnancy are keys to addressing socioeconomic inequalities in
408
healthy fetal growth and thereby attenuating the intergenerational transmission of
409
socioeconomic health inequalities.
18 REFERENCES
411
412
Aizer, A., & Currie, J. (2014). The intergenerational transmission of inequality: maternal disadvantage 413
and health at birth. Science, 344(6186), 856-861. doi:10.1126/science.1251872 414
Ballon, M., Botton, J., Charles, M. A., Carles, S., de Lauzon-Guillain, B., Forhan, A., . . . Group, E. M.-C. 415
C. S. (2018). Socioeconomic inequalities in weight, height and body mass index from birth to 416
5 years. Int J Obes (Lond), 42(9), 1671-1679. doi:10.1038/s41366-018-0180-4 417
Bannon, A. L., Waring, M. E., Leung, K., Masiero, J. V., Stone, J. M., Scannell, E. C., & Moore Simas, T. 418
A. (2017). Comparison of Self-reported and Measured Pre-pregnancy Weight: Implications 419
for Gestational Weight Gain Counseling. Matern Child Health J, 21(7), 1469-1478. 420
doi:10.1007/s10995-017-2266-3 421
Barker, D., Barker, M., Fleming, T., & Lampl, M. (2013). Developmental biology: Support mothers to 422
secure future public health. Nature, 504(7479), 209-211. 423
Barker, D. J., Osmond, C., Forsen, T. J., Kajantie, E., & Eriksson, J. G. (2005). Trajectories of growth 424
among children who have coronary events as adults. N Engl J Med, 353(17), 1802-1809. 425
doi:10.1056/NEJMoa044160 426
Barriuso, L., Miqueleiz, E., Albaladejo, R., Villanueva, R., Santos, J. M., & Regidor, E. (2015). 427
Socioeconomic position and childhood-adolescent weight status in rich countries: a 428
systematic review, 1990-2013. BMC Pediatr, 15, 129. doi:10.1186/s12887-015-0443-3 429
Botton, J., Scherdel, P., Regnault, N., Heude, B., Charles, M. A., & Group, E. M.-C. C. S. (2014). 430
Postnatal weight and height growth modeling and prediction of body mass index as a 431
function of time for the study of growth determinants. Ann Nutr Metab, 65(2-3), 156-166. 432
doi:10.1159/000362203 433
Carles, S., Charles, M. A., Forhan, A., Slama, R., Heude, B., Botton, J., & group, E. m. c. s. (2016). A 434
Novel Method to Describe Early Offspring Body Mass Index (BMI) Trajectories and to Study 435
Its Determinants. PLoS One, 11(6), e0157766. doi:10.1371/journal.pone.0157766 436
Chia, A. R., Chen, L. W., Lai, J. S., Wong, C. H., Neelakantan, N., van Dam, R. M., & Chong, M. F. 437
(2019). Maternal Dietary Patterns and Birth Outcomes: A Systematic Review and Meta-438
Analysis. Adv Nutr. doi:10.1093/advances/nmy123 439
Deschamps, V., de Lauzon-Guillain, B., Lafay, L., Borys, J. M., Charles, M. A., & Romon, M. (2009). 440
Reproducibility and relative validity of a food-frequency questionnaire among French adults 441
and adolescents. Eur J Clin Nutr, 63(2), 282-291. doi:10.1038/sj.ejcn.1602914 442
Diouf, I., Botton, J., Charles, M. A., Morel, O., Forhan, A., Kaminski, M., . . . Group, E. S. (2014). 443
Specific role of maternal weight change in the first trimester of pregnancy on birth size. 444
Matern Child Nutr, 10(3), 315-326. doi:10.1111/j.1740-8709.2012.00423.x 445
Emmett, P. M., Jones, L. R., & Northstone, K. (2015). Dietary patterns in the Avon Longitudinal Study 446
of Parents and Children. Nutr Rev, 73 Suppl 3, 207-230. doi:10.1093/nutrit/nuv055 447
Faculté de médecine RTH Laennec Lyon. (2008). AUDIPOG. 448
Field, T. (2011). Prenatal depression effects on early development: a review. Infant Behav Dev, 34(1), 449
1-14. doi:10.1016/j.infbeh.2010.09.008 450
Fuhrer, R., & Rouillon, F. (1989). La version française de l'échelle CES-D (Center for Epidemiologic 451
Studies-Depression Scale). Description et traduction de l'échelle d'auto-évaluaion. Psychiatry 452
Psychobiol, 163-166. 453
Galobardes, B., McCormack, V. A., McCarron, P., Howe, L. D., Lynch, J., Lawlor, D. A., & Smith, G. D. 454
(2012). Social inequalities in height: persisting differences today depend upon height of the 455
parents. PLoS One, 7(1), e29118. doi:10.1371/journal.pone.0029118 456
Gaudet, L., Ferraro, Z. M., Wen, S. W., & Walker, M. (2014). Maternal obesity and occurrence of fetal 457
macrosomia: a systematic review and meta-analysis. Biomed Res Int, 2014, 640291. 458
doi:10.1155/2014/640291 459
19 Gissler, M., Merilainen, J., Vuori, E., & Hemminki, E. (2003). Register based monitoring shows
460
decreasing socioeconomic differences in Finnish perinatal health. J Epidemiol Community 461
Health, 57(6), 433-439. 462
Group, H. S. C. R. (2009). Hyperglycemia and Adverse Pregnancy Outcome (HAPO) Study: associations 463
with neonatal anthropometrics. Diabetes, 58(2), 453-459. doi:10.2337/db08-1112 464
Harmon, K. A., Gerard, L., Jensen, D. R., Kealey, E. H., Hernandez, T. L., Reece, M. S., . . . Bessesen, D. 465
H. (2011). Continuous glucose profiles in obese and normal-weight pregnant women on a 466
controlled diet: metabolic determinants of fetal growth. Diabetes Care, 34(10), 2198-2204. 467
doi:10.2337/dc11-0723 468
Hein, A., Rauh, C., Engel, A., Haberle, L., Dammer, U., Voigt, F., . . . Goecke, T. W. (2014). 469
Socioeconomic status and depression during and after pregnancy in the Franconian Maternal 470
Health Evaluation Studies (FRAMES). Arch Gynecol Obstet, 289(4), 755-763. 471
doi:10.1007/s00404-013-3046-y 472
Henry, S. K., Grant, M. M., & Cropsey, K. L. (2018). Determining the optimal clinical cutoff on the CES-473
D for depression in a community corrections sample. J Affect Disord, 234, 270-275. 474
doi:10.1016/j.jad.2018.02.071 475
Heude, B., Forhan, A., Slama, R., Douhaud, L., Bedel, S., Saurel-Cubizolles, M. J., . . . group, E. m.-c. c. 476
s. (2016). Cohort Profile: The EDEN mother-child cohort on the prenatal and early postnatal 477
determinants of child health and development. Int J Epidemiol, 45(2), 353-363. 478
doi:10.1093/ije/dyv151 479
Holland, E., Moore Simas, T. A., Doyle Curiale, D. K., Liao, X., & Waring, M. E. (2013). Self-reported 480
pre-pregnancy weight versus weight measured at first prenatal visit: effects on 481
categorization of pre-pregnancy body mass index. Matern Child Health J, 17(10), 1872-1878. 482
doi:10.1007/s10995-012-1210-9 483
Howe, L. D., Tilling, K., Galobardes, B., Smith, G. D., Gunnell, D., & Lawlor, D. A. (2012). 484
Socioeconomic differences in childhood growth trajectories: at what age do height 485
inequalities emerge? J Epidemiol Community Health, 66(2), 143-148. 486
doi:10.1136/jech.2010.113068 487
Jansen, P. W., Tiemeier, H., Looman, C. W., Jaddoe, V. W., Hofman, A., Moll, H. A., . . . Raat, H. (2009). 488
Explaining educational inequalities in birthweight: the Generation R Study. Paediatr Perinat 489
Epidemiol, 23(3), 216-228. doi:10.1111/j.1365-3016.2009.01023.x 490
Johnson, M., Backman, D., Kohatsu, N., Stewart, O., Abbott, R., Yu, Z., & Lee, P. (2016). Interventions 491
for Reducing Body Mass Index and Other Weight-related Indicators: A Review of Systematic 492
Reviews. Institute for population health improvement, 10. 493
Jornayvaz, F. R., Vollenweider, P., Bochud, M., Mooser, V., Waeber, G., & Marques-Vidal, P. (2016). 494
Low birth weight leads to obesity, diabetes and increased leptin levels in adults: the CoLaus 495
study. Cardiovasc Diabetol, 15, 73. doi:10.1186/s12933-016-0389-2 496
Knopik, V. S., Maccani, M. A., Francazio, S., & McGeary, J. E. (2012). The epigenetics of maternal 497
cigarette smoking during pregnancy and effects on child development. Dev Psychopathol, 498
24(4), 1377-1390. doi:10.1017/S0954579412000776 499
Lancaster, T., Stead, L., Silagy, C., & Sowden, A. (2000). Effectiveness of interventions to help people 500
stop smoking: findings from the Cochrane Library. BMJ, 321(7257), 355-358. 501
Lange, T., Rasmussen, M., & Thygesen, L. C. (2013). Assessing natural direct and indirect effects 502
through multiple pathways. American journal of epidemiology, 179(4), 513-518. 503
McCrory, C., O'Leary, N., Fraga, S., Ribeiro, A. I., Barros, H., Kartiosuo, N., . . . Lifepath, C. (2017). 504
Socioeconomic differences in children's growth trajectories from infancy to early adulthood: 505
evidence from four European countries. J Epidemiol Community Health, 71(10), 981-989. 506
doi:10.1136/jech-2016-208556 507
Mortensen, L. H., Diderichsen, F., Smith, G. D., & Andersen, A. M. (2009). The social gradient in 508
birthweight at term: quantification of the mediating role of maternal smoking and body mass 509
index. Hum Reprod, 24(10), 2629-2635. doi:10.1093/humrep/dep211 510
20 Mortensen, L. H., Helweg-Larsen, K., & Andersen, A. M. (2011). Socioeconomic differences in
511
perinatal health and disease. Scand J Public Health, 39(7 Suppl), 110-114. 512
doi:10.1177/1403494811405096 513
Radloff, L. S. (1977). The CES-D scale: a self-report depression scale for research in the general 514
population. Applied Psychological Measurement, 1, 385-401. 515
Shenkin, S. D., Starr, J. M., & Deary, I. J. (2004). Birth weight and cognitive ability in childhood: a 516
systematic review. Psychol Bull, 130(6), 989-1013. doi:10.1037/0033-2909.130.6.989 517
van den Berg, G., van Eijsden, M., Vrijkotte, T. G., & Gemke, R. J. (2012). Educational inequalities in 518
perinatal outcomes: the mediating effect of smoking and environmental tobacco exposure. 519
PLoS One, 7(5), e37002. doi:10.1371/journal.pone.0037002 520
VanderWeele, T. J., & Vansteelandt, S. (2014). Mediation Analysis with Multiple Mediators. Epidemiol 521
Methods, 2(1), 95-115. doi:10.1515/em-2012-0010 522
Vilagut, G., Forero, C. G., Barbaglia, G., & Alonso, J. (2016). Screening for Depression in the General 523
Population with the Center for Epidemiologic Studies Depression (CES-D): A Systematic 524
Review with Meta-Analysis. PLoS One, 11(5), e0155431. doi:10.1371/journal.pone.0155431 525
WHO. Body mass index.
http://www.euro.who.int/en/health-topics/disease-prevention/nutrition/a-526
healthy-lifestyle/body-mass-index-bmi.
527
Wickstrom, R. (2007). Effects of nicotine during pregnancy: human and experimental evidence. Curr 528
Neuropharmacol, 5(3), 213-222. doi:10.2174/157015907781695955 529
Yuan, W. L., Nicklaus, S., Lioret, S., Lange, C., Forhan, A., Heude, B., . . . de Lauzon-Guillain, B. (2017). 530
Early factors related to carbohydrate and fat intake at 8 and 12 months: results from the 531
EDEN mother-child cohort. Eur J Clin Nutr, 71(2), 219-226. doi:10.1038/ejcn.2016.216 532
Zanetti, D., Tikkanen, E., Gustafsson, S., Priest, J. R., Burgess, S., & Ingelsson, E. (2018). Birthweight, 533
Type 2 Diabetes Mellitus, and Cardiovascular Disease: Addressing the Barker Hypothesis With 534
Mendelian Randomization. Circ Genom Precis Med, 11(6), e002054. 535 doi:10.1161/circgen.117.002054 536 537 538 539
21 Figure legends
540
Figure 1: Flow chart of the population included in the study. EDEN mother-child cohort 541
Figure 2: Total, direct, and mediated effects [β and 95%CI] for association between maternal 542
education level and birth weight and length z-scores, mediated by smoking during pregnancy and 543
prepregnancy BMI, adjusted for center, mother’s height, parity, and mother’s age at delivery 544
22 Table 1 Characteristics of the population at birth. The EDEN mother child cohort (N=1,500)
Maternal education level1
Low Intermediate High
P
(n=383) (n=626) (n=491)
n (%) or mean ± sd
Center, Poitiers 218 (56.9) 302 (48.2) 201 (40.9) <0.0001 Birth weight z-score -0.15 ± 1.0 -0.03 ± 1.0 0.06 ± 0.9 0.0076 Birth length z-score 0.10 ± 1.0 0.30 ± 0.9 0.41 ± 0.9 <0.0001
Sex, girls 171 (44.7) 298 (47.6) 232(47.3) 0.63
Preterm birth, yes 26 (6.8) 28 (4.5) 30 (6.1) 0.25 Gestational age (weeks) 39.0 ± 1.9 39.4 ± 1.5 39.3 ± 1.5 0.0004 Mother's height, cm 162.3 ± 5.8 163.4 ± 6.4 164.8 ± 5.8 <0.0001 Mother's age, years 28.1 ± 5.7 29.4 ± 4.6 30.8 ± 4.0 <0.0001 Parity, yes 151 (39.4) 301 (48.1) 216 (44.0) 0.03 Depressive symptoms, yes 41 (10.7) 49 (7.8) 25 (5.1) 0.01 Smoking during
pregnancy <0.0001
No 218 (56.9) 471 (75.2) 416 (84.7)
Only during the 1st
trimester 30 (7.8) 56 (9.0) 33 (6.7) During pregnancy 135 (35.3) 99 (15.8) 42 (8.6) Prepregnancy BMI2 <0.0001 Underweight 37 (9.6) 47 (7.5) 36 (7.4) Normal 227 (59.3) 396 (63.2) 374 (76.2) Overweight 83 (21.7) 125 (20.0) 57 (11.6) Obesity 36 (9.4) 58 (9.3) 24 (4.8)
Healthy dietary pattern -0.2 ± 1.0 -0.1 ± 0.9 0.2 ± 1.0 <0.0001 Western dietary pattern 0.4 ± 1.2 -0.0 ± 0.9 -0.3 ± 0.8 <0.0001 1
Low: less than high school; intermediate: high school diploma to 2-year university degree, reference category; high: 3-year university degree or more. 2 Underweight: <18.5kg/m²; Normal: ≥18.5 and <25kg/m²; Overweight: ≥25 and <30kg/m²; Obesity: ≥30kg/m²
545
23 547
Table 2 Unadjusted associations between birth size z-scores and candidate mediators. EDEN mother child cohort (N=1,500)
Birth weight z-score Birth length z-score
means ± sd P means ± sd P Depressive symptoms 0.860 0.244 No -0.03 ± 0.95 0.30 ± 0.91 Yes -0.02 ± 1.08 0.19 ± 1.03 Smoking during pregnancy <0.0001 <0.0001 No 0.05 ± 0.93 0.39 ± 0.88
Only during the 1st
trimester -0.06 ± 0.91 0.19 ± 0.87 During pregnancy -0.35 ± 1.01 -0.06 ± 0.97 Prepregnancy BMI <0.0001 <0.0001 Underweight -0.41 ± 0.92 -0.01 ± 1.00 Normal -0.06 ± 0.93 0.28 ± 0.90 Overweight 0.09 ± 1.01 0.45 ± 0.95 Obesity 0.27 ± 0.96 0.41 ± 0.84 Corr1 P Corr1 P
Healthy dietary pattern 0.06 0.013 0.05 0.006
Western dietary pattern -0.07 0.056 -0.11 <0.0001
1Pearson’s correlation 548
549
550
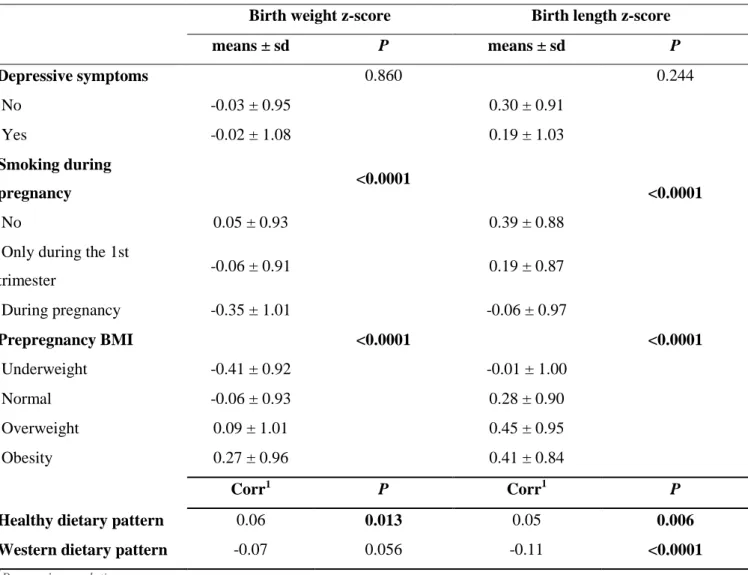
24 Table 3 Natural indirect effect [β and 95%CI] of candidate mediators of the associations between maternal education and birth z-scores
552
Birth weight z-score Birth length z-scores
Maternal education level Maternal education level
Low vs. High vs. Low vs. High vs.
Intermediate Intermediate Intermediate Intermediate
Smoking during pregnancy -0.07 [-0.11; -0.04] 0.03 [0.01; 0.05] -0.08 [-0.12; -0.05] 0.03 [0.02; 0.06] Prepregnancy BMI -0.00 [-0.03; 0.02] -0.03 [-0.06; -0.01] -0.00 [-0.02; 0.02] -0.03 [-0.05; -0.01] Depressive symptoms 0.00 [-0.01; 0.01] -0.00 [-0.01; 0.01] -0.00 [-0.01; 0.00] 0.00 [-0.00; 0.01] Healthy dietary pattern -0.00 [-0.01; 0.00] 0.01 [-0.01 ; 0.02] 0.00 [-0.00; 0.01] 0.00 [-0.01; 0.01] Western dietary pattern -0.02 [-0.04; 0.00] 0.01 [-0.00; 0.02] -0.02 [-0.05; -0.01] 0.01 [0.00; 0.02] Western dietary pattern
residuals1 - - -0.01 [-0.02; 0.00] 0.00 [-0.00; 0.01]
Adjustment for center, mother’s height, parity, and mother’s age at delivery 553
1
Residuals of the regression of the Western dietary pattern on BMI, smoking during pregnancy, and confounders 554
25 556
![Table 3 Natural indirect effect [β and 95%CI] of candidate mediators of the associations between maternal education and birth z-scores](https://thumb-eu.123doks.com/thumbv2/123doknet/14698535.564012/25.1261.99.979.138.383/table-natural-indirect-candidate-mediators-associations-maternal-education.webp)
