HAL Id: inserm-00483213
https://www.hal.inserm.fr/inserm-00483213
Submitted on 12 May 2010
HAL is a multi-disciplinary open access
archive for the deposit and dissemination of
sci-entific research documents, whether they are
pub-lished or not. The documents may come from
teaching and research institutions in France or
abroad, or from public or private research centers.
L’archive ouverte pluridisciplinaire HAL, est
destinée au dépôt et à la diffusion de documents
scientifiques de niveau recherche, publiés ou non,
émanant des établissements d’enseignement et de
recherche français ou étrangers, des laboratoires
publics ou privés.
and promotes the maturation of GABAergic synapses.
Hervé Fiorentino, Nicola Kuczewski, Diabe Diabira, Nadine Ferrand, Menelas
Pangalos, Christophe Porcher, Jean-Luc Gaiarsa
To cite this version:
Hervé Fiorentino, Nicola Kuczewski, Diabe Diabira, Nadine Ferrand, Menelas Pangalos, et al..
GABA(B) receptor activation triggers BDNF release and promotes the maturation of
GABAer-gic synapses..
Journal of Neuroscience, Society for Neuroscience, 2009, 29 (37), pp.11650-61.
�10.1523/JNEUROSCI.3587-09.2009�. �inserm-00483213�
Development/Plasticity/Repair
GABA
B
Receptor Activation Triggers BDNF Release and
Promotes the Maturation of GABAergic Synapses
Herve´ Fiorentino,
1Nicola Kuczewski,
1Diabe Diabira,
1Nadine Ferrand,
1Menelas N. Pangalos,
2Christophe Porcher,
1and Jean-Luc Gaiarsa
11Institut de Neurobiologie de la Me´diterrane´e, Inserm (Institut National de la Sante´ et de la Recherche Me´dicale), Unite´ 901, and Universite´ de La
Me´diterrane´e, 13273 Marseille Cedex 09, France, and2Wyeth Research, Discovery Research Neurosciences, Monmouth Junction, New Jersey 08852
GABA,themaininhibitoryneurotransmitterintheadultbrain,hasrecentlyemergedasanimportantsignalinnetworkdevelopment.Mostofthe
trophic functions of GABA have been attributed to depolarization of the embryonic and neonatal neurons via the activation of ionotropic GABA
Areceptors. Here we demonstrate a novel mechanism by which endogenous GABA selectively regulates the development of GABAergic synapses
in the developing brain. Using whole-cell patch-clamp recordings on newborn mouse hippocampi lacking functional GABA
Breceptors (GABA
B-Rs) and time-lapse fluorescence imaging on cultured hippocampal neurons expressing GFP-tagged brain-derived neurotrophic factor (BDNF),
we found that activation of metabotropic GABA
Breceptors (GABA
B-Rs) triggers secretion of BDNF and promotes the development of
periso-matic GABAergic synapses in the newborn mouse hippocampus. Because activation of GABA
B-Rs occurs during the characteristic ongoing
physiological network-driven synaptic activity present in the developing hippocampus, our results reveal a new mechanism by which synaptic
activity can modulate the development of local GABAergic synaptic connections in the developing brain.
Introduction
The proper development of highly organized structures in the
CNS is a complex process that determines appropriate
connec-tivity in the adult. Neurotransmitters released during
spontane-ous and experience-driven synaptic activity play a crucial role in
the formation of neuronal networks (Katz and Shatz, 1996;
Zhang and Poo, 2001). The most well documented example is
glutamate, the major excitatory transmitter in the vertebrate
CNS, which regulates nearly all aspects of neuronal network
for-mation from migration to synaptogenesis (Zhang and Poo, 2001;
Manent and Represa, 2007). Recent advances have shown that
GABA acts beyond its classical inhibitory role and also functions
as an important developmental signal by regulating proliferation,
migration, growth, and synapse formation (Ben-Ari et al., 2007).
With the observation that the activation of chloride-permeable
GABA
Areceptors (GABA
A-Rs) depolarizes developing neurons
(Cherubini et al., 1991), it was proposed that part of the trophic
action of GABA relies on membrane depolarization and
subse-quent activation of voltage-dependent calcium channels
(Ben-Ari et al., 2007). Consistent with this hypothesis, early conversion
of GABA-induced depolarization into hyperpolarization
im-paired synapse formation and dendritic development of the
tar-get neurons both in vitro (Chudotvorova et al., 2005) and in vivo
(Ge et al., 2006; Cancedda et al., 2007; Wang and Kriegstein,
2008; Reynolds et al., 2008).
In addition to ionotropic GABA
A-Rs, GABA also binds to
metabotropic GABA
B-Rs. These receptors are ubiquitously
ex-pressed at early stages of development, even before synapses are
formed (Fritschy et al., 1999; Behar et al., 2001; Lo´pez-Bendito et
al., 2002, 2004), and are activated by endogenous GABA released
during early network-driven synaptic activity (McLean et al.,
1996; Obrietan and Van den Pol, 1999; Catsicas and Mobbs, 2001;
Lo´pez-Bendito et al., 2003). Although GABA
B-R activity has been
reported to modulate cortical neuronal migration (Behar et al.,
1996, 2001; Lo´pez-Bendito et al., 2003), little attention has been
paid to the possible contribution of GABA
B-Rs in the functional
development of neuronal networks.
In the present study, we tested the ability of CA3 hippocampal
pyramidal cells to develop functional synaptic connections in the
absence of functional GABA
B-Rs. We found that activation of
GABA
B-Rs selectively promotes the development of hippocampal
GABAergic synapses via the induction of brain-derived
neurotro-phic factor (BDNF) secretion. We further show that this process
occurs during physiological patterns of synaptic activity. This study
reveals a novel role of GABA
B-Rs in regulating the self-refinement of
GABAergic synaptic connections in the developing brain.
Materials and Methods
All animal experiments were carried out according to the guidelines laid down by the Inserm animal welfare committee and the European Communities Council Directive of 24 November 1986 (86/609/EEC). Intact hippocampal formation and slice preparation. Experiments were performed on intact hippocampal formation (IHF) and hippocampal slices obtained from newborn [postnatal day 1 (P1) to P24] GABAB1
receptor subunit knock-out (GABAB1-KO) and wild-type (GABAB1
-WT) mice (Prosser et al., 2001) and BDNF-KO and BDNF-WT mice
Received July 24, 2009; accepted Aug. 8, 2009.
This work was supported by Inserm, Centre National de la Recherche Scientifique, and Agence Nationale pour la Recherche (ANR). H.F. was a recipient of a Ministe`re de la Recherche et de l’Education fellowship. N.K. was a recipient of Fondation pour la Recherche Me´dicale and ANR fellowships. We wish to thank Drs. I. Medina, R. Khazipov, and M. Phillips for critical reading of this manuscript, Dr. V. Lessmann for the generous gift of BDNF-GFP cDNA, and S. Corby and C. Pellegrino for technical help.
Correspondence should be addressed to Jean-Luc Gaiarsa, Institut de Neurobiologie de la Me´diterrane´e, Parc scientifique de Luminy, BP 13, 13273 Marseille Cedex 09, France. E-mail: gaiarsa@inmed.univ-mrs.fr.
DOI:10.1523/JNEUROSCI.3587-09.2009
(The Jackson Laboratory). The procedure for the preparation of the in-tact IHFs was similar to that previously described (Khalilov et al., 1997). Brains were removed from anesthetized (350 mg/kg chloral hydrate, i.p.) animals and immersed into ice-cold (2– 4°C) artificial CSF (ACSF) of the following composition (in mM): 126 NaCl, 3.5 KCl, 2 CaCl2, 1.3 MgCl2,
1.2 NaH2PO4, 25 NaHCO3, and 11 glucose, pH 7.4, when equilibrated
with 95% O2and 5% CO2. The hippocampi were then incubated for
12–16 h at 32°C in ACSF (oxygenated with 95% O2and 5% CO2) alone or supplemented with different drugs. After the incubation, hippocam-pal slices (600m thick) were cut with a McIlwain tissue chopper and kept in ACSF at 25°C for 60 min before use. Slices were then trans-ferred to a submerged recording chamber and perfused with ACSF (3 ml/min) at 34°C. For each experiment, half of the dissected hip-pocampi were incubated in control conditions, and the other half incubated in treated conditions. Electrophysiological recordings on slices obtained from control and treated hippocampi were performed on the same day.
Electrophysiological recordings. Whole-cell patch-clamp recordings of CA3 pyramidal neurons were performed with an Axopatch 200B ampli-fier (Molecular Devices). To record miniature activity, borosilicate mi-croelectrodes (4 – 8 M⍀) were filled with the following solution (in mM):
110 CsCl, 30 potassium gluconate, 10 HEPES, 1.1 EGTA, 0.1 CaCl2, 4
MgATP, 0.3 NaGTP, 5-(and-6)-tetramethylrhodamine biocytin (rhoda-mine, 0.5–1%), pH⫽ 7.25, osmolarity ⫽ 275 mosmol/L. Criteria for accepting a recording included a resting potential of⬍⫺55 mV, an Riof ⬎400 M⍀, and an Rsof⬍25 M⍀. Capacitance, input, and series
resis-tances were measured online with Acquis Software (Biologic). Miniature GABAAreceptor-mediated postsynaptic currents (mGABAA
-PSCs) were isolated in the presence of the ionotropic glutamater-gic receptor antagonists [10M2,3-dihydroxy-6-nitro-7-sulfonyl-benzo [f]quinoxaline (NBQX), 40 M D-2-amino-5-phosphovaleric acid (D-APV)] and tetrodotoxin (1MTTX) and recorded at a holding po-tential of⫺70 mV. Miniature glutamatergic postsynaptic currents were recorded in the presence of TTX (1M) and the GABAAreceptor
antag-onist bicuculline (10M). Neurons were clamped at⫺70 mV. The
cur-rents were stored on an Axoscope 8.1 (Molecular Devices) and analyzed off-line with the Mini Analysis program (Synaptosoft 5.1). The fact that no false events would be identified was confirmed by visual inspection for each experiment. To generate the average PSCs, multiple overlapping events were discarded, and the remaining events were aligned on their rising phase. In the figures, the histograms were constructed using min-iature PSCs recorded for 10 –30 min. To determine the probability of presence of giant depolarizing potentials (GDPs), an average of 13⫾ 6 cells (ranging from n⫽ 3 at P24 to n ⫽ 23 at P1) were recorded in GABAB1-WT slices and 14⫾ 7 cells (ranging from n ⫽ 3 at P24 to n ⫽ 27 at P2) in GABAB1-KO slices.
Peak-scaled analysis of mGABAA-PSCs was performed as described by Traynelis et al. (1993) using Mini Analysis program (Synaptosoft 5.1). For each recording, we verified the absence of correlation between the decay time course and peak amplitude of mGABAA-PSCs. For each
re-cording, we used between 50 and 200 events and eliminated all events with a decay time distorted by multiple peaks or anomalous noise. Each individual event was scaled to the peak of the mean waveform of the averaged event and subtracted. The mean variance was plotted against mean current. The plot was well fit by a parabolic function that yields the single-channel current i0and the number of channels contributing to
mGABAA-PSCs, N0. From i0, the single-channel conductance␥ can be
calculated.
Paired-pulse relationship (PPR) of GABAergic synapses impinging onto CA3 pyramidal neurons was measured using pairs of identical stim-uli at a 100 ms interval, delivered at a frequency of 0.01 Hz with a bipolar tungsten electrode placed in the CA3 stratum radiatum. The resulting pairs of postsynaptic GABAAcurrents (GABAA-PSCs) were isolated in the presence of 10MCNQX, 40MD-APV, and 5MCGP55845. PPR
was measured as the following amplitude ratio: second GABAA-PSCs/ first GABAA-PSCs. Average PPR values were calculated from 20 –30 paired stimulations.
Neuron reconstruction and morphometric analysis. Biocytin filling was done using the cell patch-clamp technique. Briefly, after
whole-cell access, biocytin (1% in internal pipette solution) filling was done for 15 min. The slices were then fixed in PFA–PBS at 4°C overnight, and the biocytin-filled neurons were visualized using the avidin– biotin method. For 3-D reconstruction, a dendritic tree was digitized directly from the sections by use of a 20⫻ objective on a Nikon microscope, equipped with a motorized stage and coupled to a computer running Neurolucida soft-ware (Microbrightfield), thereby allowing for x–z coordinates of digi-tized points to be stored and analyzed.
Immunohistochemistry. Brains from P7 mice were fixed in 4% parafor-maldehyde (overnight). Cryostat-cut hippocampal sections (30 m) were preincubated (1 h) in PBS–Triton X-100 (0.3%)– goat serum (3%) and then coincubated overnight at 4°C with antibodies to glutamic acid decarboxylase (Chemicon MAB351) and synaptophysin (Chemicon AB9272). Slices were washed with PBS, and Alexa Fluor 488 donkey antibody to mouse IgG (FluoProbes) and Cy3 donkey antibody to rabbit IgG (Chemicon) were applied (2 h). Sections were visualized with con-focal microscopy (LSM 510, Zeiss). Five areas were sampled per animal, in the stratum radiatum and the stratum pyramidale. After the recording sessions, the optical sections were displayed in the form of digital images of 1024⫻ 1024 pixels and processed using the ImageJ software (NIH, Bethesda, MD; http://rsb.info.nih.gov/ij/). All the pictures were reviewed to set a threshold to optimize the representation of puncta, and then the same threshold was applied to all images. The GAD65-labeled area frac-tion, defined as the percentage of GAD65-immunopositive pixels per field (1024⫻ 1024 pixels), and the size of GAD65 puncta were measured. The proportion of colocalized immunoreactivity (IR) was expressed as the ratio: synaptophysin and GAD65 colocalized area/synaptophysin IR area or GAD65 IR area. For each section, counts were performed blindly in slices taken from three WT and three KO animals.
Cell cultures and transfections. Neurons from postnatal day 0 rat hip-pocampus were dissociated using trypsin and plated on coverslips coated with polyethylenimine as previously described (Kuczewski et al., 2008b). Eleven days after plating, neurons were transfected with cDNAs coding for BDNF-GFP (gift from Dr. V. Lessmann, Institute of Physiology, Otto-von-Guericke University Magdeburg, Magdeburg, Germany) ac-cording to the OZ Biosciences protocol (Buerli et al., 2007). After trans-fection, the cultures were incubated at 30°C in 5% CO2. Immunostaining
confirmed that BDNF-GFP is targeted to the dendrite and packed into secretory granules of the regulated pathway of secretion (Kuczewski et al., 2008b).
Time-lapse imaging. Real-time imaging was performed as previously described (Kuczewski et al., 2008b). Fluorescence intensity was measured from dendritic regions containing clusters of BDNF-GFP with ImageJ software after subtraction of background fluorescence. Clusters in which the fluorescence intensity varied during the 5 min control period by⬎5% were discarded from the analysis. Fluorescence decreases caused by pho-tobleaching and constitutive release were corrected by subtracting the extrapolation of the fluorescence decrease in the first 5 min over the whole recording time. Values are plotted as the percentage of the fluo-rescence intensity of the last frame before stimulation. Percentage varia-tion in the text and statistical analysis were calculated by comparing the relative fluorescence of the interval⫺100 to 0 s (control) with that of 400 –500 s (after stimuli).
Surface GFP immunofluorescence staining. The procedure for surface BDNF-GFP immunostaining was similar to that previously described (Kuczewski et al., 2008b). Briefly, after being washed in ACSF, the living cultures were incubated at 4°C for 1 h in the presence of an anti-GFP antibody (10g/ml; Molecular Probes). Cultures were then washed with 0.1MPBS (4°C, pH 7.4) and fixed for 15 min with 4%
paraformalde-hyde– 4% sucrose. After fixation, the neurons were exposed to a saturat-ing concentration (10g/ml) of either anti-rabbit secondary antibody coupled to Cy3 (FluoProbes) for 1.5 h under a nonpermeabilized condi-tion. Quantifications were performed with ImageJ. Surface-bound BDNF-GFP on BDNF-GFP-expressing neurons was expressed as the fol-lowing ratio: Cy3 and BDNF-GFP colocalized area/BDNF-GFP area.
Phospho-CREB activation and immunocytochemistry. The procedure for phospho-CREB activation and immunocytochemistry was similar to that previously described (Kuczewski et al., 2008b). Briefly, 1 d before stimulation (at 13 DIV) one-half of the culture medium was changed to
MEM with 2% B27 supplement. To reduce the basal level of CREB phos-phorylation, cultures were incubated for 30 min in TTX (1M). Five
minutes before stimulation, NBQX (10M), D-APV (40M), and
bicu-culline (20M) were added to medium. The cultures were then
stimu-lated with baclofen (50M) for 10 min in the absence or presence of
TrkB-IgG (2g/ml) or CGP55845 (10 M). Five to 10 min after
stimu-lation, neurons were fixed for 15 min (4% paraformaldehyde) at 4°C and rinsed several times. Coverslips were then preincubated in PBS– Triton-100 (0.1%)– goat serum (3%) for 1 h at room temperature and incubated overnight with mouse CREB (1:1000) and rabbit anti-phospho-CREB (pCREB, 1:1000) antibodies (Cell Signaling Technol-ogy). Immunoreactivities for pCREB and CREB were detected with an Alexa 488-coupled (A488) rabbit secondary antibody (1:500; Fluo-Probes) and a Cy3-coupled mouse secondary antibody (1:500; Jackson ImmunoResearch Laboratories), respectively. All procedures were performed in phosphate-free solution containing 140 mMNaCl, 5 mM
KCl, and 10 mMHEPES-Na, pH 7.4. Images were acquired with an
LSM 510 laser scanning confocal microscope (Zeiss). The acquisition of A488 (pCREB) and then Cy3 (CREB) was sequential to avoid over-lap of excitation and emission of fluorescence. The optical sections were digitized (1024⫻ 1024 pixels) and processed using ImageJ soft-ware. The pCREB-to-CREB intensity ratio was expressed as means value ratio of the pA488 staining intensity versus the CREB-Cy3 staining intensity.
ELISA. Brains of wild-type, GABAB1-KO, and BDNF heterozygote
mice were rapidly removed from their skulls at P6. Hippocampi were rapidly dissected out, weighed, and snap frozen in liquid nitrogen and stored at⫺80°C. BDNF was extracted from hippocampi by mechanical homogenization in a buffer containing 100 mMTris–HCl, pH 7.0,
con-taining 1MNaCl, 4 mMEDTA, 2% Triton X-100, and the protease
inhib-itors 10g/ml aprotinin, 10 g/ml leupeptin, and 17 g/ml PMSF. Homogenates were centrifuged at 14,000⫻ g for 20 min. Supernatants were collected and analyzed with a commercial two-antibody sandwich ELISA (BDNF Emaximmunoassay system; Promega) according to the
protocol of the manufacturer. The total protein content of each super-natant was measured with a Bradford protein assay. The BDNF level was expressed as the ratio of BDNF to the total soluble protein concentration. There was no significant difference in the weight of GABAB1-WT and
GABAB1-KO hippocampi (9.87⫾ 0.31 mg/hippocampi vs 9.12 ⫾ 0.56
mg/hippocampi, respectively).
Drugs. NBQX, D-APV, bicuculline, and CGP55845 were purchased from Tocris Cookson. Tetrodotoxin and baclofen were purchased from Sigma. k252a was from Calbiochem. TrkB-IgG and TrkC-IgG were from R&D Systems.
Results
Miniature GABAergic synaptic activity is altered in mice
lacking functional GABA
Breceptors
To address the contribution of GABA
B-Rs to the development of
the hippocampal circuit, we recorded miniature GABA
Aand
glutamatergic-receptor-mediated postsynaptic currents (mGABA
A-PSCs and mGlu--PSCs, respectively) from hippocampal CA3
py-ramidal cells from P6 to P8 GABA
B1-KO mice, which display a
complete loss of GABA
Breceptor function (Prosser et al., 2001).
The frequency of mGABA
A-PSCs was significantly reduced in
GABA
B1-KO (0.73
⫾ 0.12 Hz in GABA
B1-KO, n
⫽ 13) when
compared with their wild-type littermates (1.61
⫾ 0.26 Hz, n ⫽
10, p
⫽ 0.03) (Fig. 1A,B). This decrease in frequency was
ob-served at all developmental stages studied (i.e., from P1 to P10)
(Fig. 1C; supplemental Fig. 1, available at www.jneurosci.org as
supplemental material). The mean amplitude, coefficient of
variation of amplitude (CVa), and kinetic properties of
mGABA
A-PSCs were unchanged (Fig. 1 B; supplemental Fig. 1,
available at www.jneurosci.org as supplemental material). In
contrast to mGABA
A-PSCs, the average frequency of
mGlu-PSCs was not different between GABA
B1-WT (0.11
⫾ 0.017
Hz, n
⫽ 10) and GABA
B1-KO (0.11
⫾ 0.016 Hz, n ⫽ 12) P6 –P8
neurons. The other parameters of mGlu-PSCs were also
un-changed (supplemental Fig. 2, available at www.jneurosci.org
as supplemental material). The membrane capacitance of the
recorded cells, an indicator of neuronal size (Colin-Le Brun et
al., 2004) (supplemental Fig. 3, available at www.jneurosci.org
as supplemental material), was not different between GABA
B1-WT
and GABA
B1-KO (Fig. 1 B; supplemental Fig. 1, available at www.
jneurosci.org as supplemental material), suggesting that the
mor-phological development of the target CA3 pyramidal cells was not
affected. This observation was confirmed by quantitative
mor-phometric analysis of intracellularly biocytin-loaded CA3
pyra-midal neurons (Fig. 1 D–G). Therefore, the development of
GABAergic synapses is selectively impaired in mice lacking
func-tional GABA
B-Rs.
Blockade of GABA
B-Rs in vitro mimics the deficit in
GABAergic transmission observed in GABA
B1-KO mice
In a previous study, we showed that the factors required for the
functional maturation of GABAergic synapses in vivo are
pre-served in the IHFs in vitro (Colin-Le Brun et al., 2004). We
there-fore used this preparation to overcome the potential pitfalls of
genetic manipulations often observed in KO animals. IHFs
ob-tained from P1 GABA
B1-WT mice were incubated at 32°C for
12–16 h in oxygenated control ACSF or with the GABA
B-R
an-tagonist CGP55845 (5
M). After the incubation period,
hip-pocampal slices were prepared to record mGABA
A-PSCs. In
slices obtained from CGP55845-treated IHFs, the frequency of
mGABA
A-PSCs was significantly lower compared with control
IHFs [0.107
⫾ 0.024 Hz (n ⫽ 11) vs 0.247 ⫾ 0.049 Hz (n ⫽ 10),
p
⫽ 0.031] (Fig. 1H). The other mGABA
A-PSC parameters were
unchanged (supplemental Fig. 4a, available at www.jneurosci.org
as supplemental material). P1 IHFs obtained from GABA
B1-KO
mice were also incubated in control ACSF. The mean frequency
of mGABA
A-PSCs (0.117
⫾ 0.026 Hz, n ⫽ 8) was significantly
lower compared with control GABA
B1-WT IHFs ( p
⫽ 0.046) but
similar to the value obtained in CGP55845-treated GABA
B1-WT
IHFs (Fig. 1 H). The other mGABA
A-PSC parameters were
un-changed (supplemental Fig. 4a, available at www.jneurosci.org as
supplemental material). Therefore, the pharmacological
block-ade of the GABA
B-Rs in vitro reproduces the deficit in GABAergic
transmission observed in GABA
B1-KO mice, showing that it
re-flects the absence of GABA
B-R activation by endogenous GABA.
Reduced perisomatic GABAergic synapses in mice lacking
GABA
Breceptors
We next asked whether the deficit in GABAergic synaptic
transmission resides in the presynaptic or the postsynaptic site.
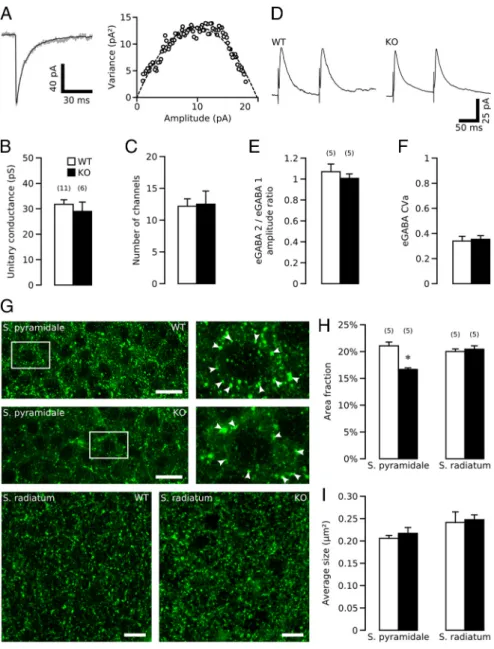
We first performed a peak-scaled variance analysis of mGABA
A-PSCs which allows an estimate of the mean unitary conductance
and the number of channels open at the peak of the synaptic
current (Traynelis et al., 1993) and found no difference between
GABA
B1-KO (n
⫽ 6) and GABA
B1-WT (n
⫽ 11) neurons (Fig.
2 A–C). To detect possible changes in the probability of GABA
release, we then measured the paired-pulse ratio and CVa of
evoked GABA
A-PSCs. We found no difference between GABA
B1-WT
and GABA
B1-KO mice (n
⫽ 5 for both) (Fig. 2D–F). Finally, to
investigate possible changes in the density of GABAergic
ter-minals, we performed immunolabeling against GAD65, the
synthetic enzyme for GABA. Double immunostaining against
GAD65 and synaptophysin confirmed that GAD65 staining
corresponds to GABAergic terminals (supplemental Fig. 5a– c,
available at www.jneurosci.org as supplemental material).
Quantitative analysis shows that, compared with the GABA
B1-WT
hippocampi, the labeled area fraction was reduced by
⬃20% in
the stratum pyramidale of GABA
B1-KO ( p
⫽ 0.001), while the
average size of GAD-positive puncta was unchanged (n
⫽ 5 pairs
of mice, 5 sections per mouse) (Fig. 2G–I ). There was, however,
no difference in the labeled area fraction and average size of
GAD65-positive puncta in the stratum radiatum of GABA
B1-KO
and GABA
B1-WT hippocampi (Fig. 2G–I ). Similar results were
obtained with synaptophysin, a presynaptic marker
(supplemen-tal Fig. 5d,e, available at www.jneurosci.org as supplemen(supplemen-tal
ma-terial). Although functional presynaptic modifications cannot be
completely excluded, together these data suggest that the deficit
in GABAergic synaptic activity observed in GABA
B1-KO mice
results at least in part from a decrease in the density of proximal
GABAergic terminals.
GABA
B-Rs are primarily activated by spontaneous
network-driven synaptic activity
We next asked whether and when GABA
B-Rs are activated during
ongoing synaptic activity. To address this point, we investigated the
effect of the GABA
B-R antagonist CGP55845 on GABA
B1-WT slices.
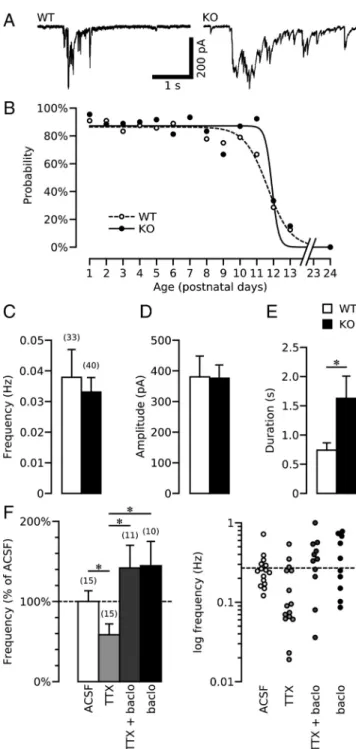
We found that the duration of GDPs, the characteristic primitive
network-driven pattern of synaptic activity (Ben-Ari et al., 1989),
was significantly increased in the presence of CGP55845 (5
M)
(from 0.757
⫾ 0.146 s to 1.738 ⫾ 0.617 s, n ⫽ 8, p ⫽ 0.0002) (Fig.
3A). However, when applied in the presence of NBQX (10
M)
and D-APV (40
M), to isolate spontaneous GABA
A-PSCs,
CGP55845 had no significant effect on the frequency, amplitude
and charge transfer of sGABA
A-PSCs in GABA
B1-WT neurons
(n
⫽ 9) (Fig. 3B,C). In agreement with previous findings that
GABA
B-Rs are activated by concomitant release of GABA from
several interneurons (Scanziani, 2000), these data show that the
activation of GABA
B-Rs by endogenous GABA required the
pres-ence of spontaneous GDPs.
The lack of GABA
B-R activation is responsible for the deficit
in GABAergic transmission
Network construction is modulated by the level and pattern of
spontaneous synaptic activity generated in the developing
ner-Figure 1. Miniature GABAergic activity is impaired in GABAB1-KO hippocampal slice. A, Representative traces of mGABAA-PSCs. Averaged mGABAA-PSCs (n⫽ 30) are shown at anexpanded time scale. B, Summary plot of the mGABAA-PSC parameters and cell capacitance in GABAB1-KO mice at P6 –P8 expressed as percentage of GABAB1-WT values. C, Summary plot
of the mGABAA-PSC frequency in recordings from GABAB1-WT (open bars) and GABAB1-KO (filled bars) mice at different postnatal developmental stages. D, Two-dimensional projection
of three-dimensional reconstruction of biocytin-filled P6 –P7 CA3 pyramidal cells. Scale bar, 100m. E, F, Summary plot of the total apical and basal dendritic length (E) and dendritic branching point (F ) of the biocytin-filled CA3 pyramidal cells of GABAB1-KO and GABAB1-WT mice. The average membrane capacitance was 35.9⫾ 3.8 pF for the GABAB1-WT pyramidal
cells and 38.2⫾ 3.1pF for the GABAB1-KO pyramidal cells. n⫽ 14 for each genotype. G, Sholl analysis of biocytin-filled CA3 pyramidal neurons obtained from GABAB1-KO and GABAB1-WT
mice. The number of intersections within each concentric ring (10m beginning from the soma) is plotted versus the distance from the soma. n ⫽ 14 for each genotype. H, Left, Summary plot of the mGABAA-PSC frequency in recordings from GABAB1-WT intact hippocampi incubated in vitro for 12–16 h in control condition (ACSF) or with CGP55845 (CGP; 5M), and from
GABAB1-KO intact hippocampi incubated in vitro for 12–16 h in control condition (ACSF). Right, Logarithmic plot of the mGABAA-PSC frequency in recordings from GABAB1-WT and
GABAB1-KO intact hippocampi incubated in the corresponding conditions. Each symbol represents the result of one single cell. The dashed line represents the mean value obtained
vous system. Thus, the deficit in
GABAer-gic synaptic transmission observed in the
GABA
B1-KO could be accounted for by
alterations in spontaneous synaptic
activ-ity resulting from the lack of functional
GABA
B-Rs. We therefore characterized
the spontaneous synaptic activity
gener-ated in the GABA
B1-KO. We found that
GDPs were present in both GABA
B1-WT
and GABA
B1-KO hippocampal slices
from P1 to P10 and progressively
disap-peared by the end of the second postnatal
week (Fig. 4 A, B). No difference in timing
of the disappearance of GDPs was
ob-served between the two groups (Fig. 4 B).
There was also no difference in the
fre-quency or amplitude of GDPs between
GABA
B1-KO (n
⫽ 33) and GABA
B1-WT
(n
⫽ 40) mice (Fig. 4C,D). However, GDP
duration was two- to threefold longer in
GABA
B1-KO slices (1630
⫾ 381 ms, n ⫽
40) compared with WT (740
⫾ 97 ms, n ⫽
33, p
⫽ 0.02) (Fig. 4A,E). The longer
GDPs in GABA
B1-KO slices are
network-driven synaptic events because they were
recorded with field electrodes and
abol-ished by TTX (1
M) (data not shown). As
expected, application of CGP55845 (5
M) had no effect on GDP duration in
GABA
B1-KO slices (1555
⫾ 72 ms in
CGP55845, n
⫽ 4). These data therefore
show that GDPs are longer in GABA
B1-KO mice and that the lengthening of
GDPs results from the lack of functional
GABA
B-R-mediated inhibition.
We next asked whether the deficit in
GABAergic transmission observed in
hip-pocampi deficient in GABA
B-Rs is due to
the lack of GABA
B-R activity per se or
is an indirect consequence of the lack of
GABA
B-R activity, i.e., the lengthening of
GDP duration. To address this point, P1
WT IHFs were incubated for 12–16 h in
the presence of TTX (1
M) to block
ac-tion potential-dependent activity and
GDPs. Since GABA
Breceptors are
acti-vated during GDPs, we hypothesized that
blockade of GDPs with TTX treatment
would reduce activation of GABA
B-R
and lead to a GABAergic deficit similar
to that observed in GABA
B-R-deficient
hippocampi. We found that mGABA
A-PSC frequency was indeed significantly reduced in TTX-treated
IHFs (0.158
⫾ 0.037 Hz, n ⫽ 15) compared with control IHFs
(0.270
⫾ 0.036 Hz, n ⫽ 15, p ⫽ 0.045) (Fig. 4F). The other
mGABA
A-PSC parameters were unchanged (supplemental Fig.
4b, available at www.jneurosci.org as supplemental material). We
next attempted to rescue the deficit induced by TTX with the
specific GABA
B-R agonist baclofen. Baclofen (5
Mfor 12–16 h)
completely rescued the TTX-induced deficit [from 0.158
⫾ 0.037
Hz (n
⫽ 15) to 0.383 ⫾ 0.076 Hz (n ⫽ 11), respectively, p ⫽
0.023] (Fig. 4 F; supplemental Fig. 4b, available at www.
jneurosci.org as supplemental material). Finally, we investigated
the consequences of treatment with baclofen alone, which also
blocked GDPs (Tosetti et al., 2004) while activating GABA
B-Rs.
We found that incubation with baclofen (5
M) had no
signifi-cant effect on mGABA
A-PSC frequency (0.390
⫾ 0.082 Hz, n ⫽
11) when compared with control WT IHFs (Fig. 4 F;
supplemen-tal Fig. 4b, available at www.jneurosci.org as supplemensupplemen-tal
mate-rial). Together, these data show that the deficit in GABAergic
synaptic transmission observed in GABA
B-R-deficient IHFs is
not a consequence of abnormal synaptic activity but rather
re-sults from the lack of GABA
B-R activation during ongoing
syn-aptic activity.
Figure 2. Presynaptic reduction in the number of perisomatic GABAergic terminals in GABAB1-KO hippocampi. A, Example of
mGABAA-PSCs superimposed to the scaled mean waveform and associated relationship between mean mGABAA-PSCs amplitude
and variance recorded from a representative GABAB1-KO neuron. B, C, Summary plot of the unitary conductance (B) and the
number of GABAAchannels at the peak of the mGABAA-PSCs (C) in GABAB1-WT (open bars) and GABAB1-KO (filled bars) mice.
D, Representative averaged (n⫽20)evokedGABAA-PSCs from GABAB1-WT and KO mice (interstimulus⫽100ms).E,F,Summary
plot of the paired-pulse ratio (E) and the coefficient of variation (F ) of evoked GABAA-PSCs in GABAB1-WT (open bars) and
GABAB1-KO (filled bars) mice. Both GABAB-R-dependent and GABAB-R independent PPRs have been reported for eGABAA-PSCs in
hippocampus. The PPR experiment were therefore performed in the presence of the GABAB-R antagonist CGP55845 (5M) in both
GABAB1-KO mice and GABAB1-WT. G, Microscopic confocal images showing GAD65-positive puncta in the strata pyramidale and
radiatum of GABAB1-WT and GABAB1-KO hippocampi at postnatal day 7. Scale bars, 10m.H,I,Summaryplotofthefractionarea
of GAD65 fluorescence (H ) and average size of GAD65 fluorescent puncta (I ) in GABAB1-WT (open bars) and GABAB1-KO (filled
GABA
B-Rs and BDNF signaling interact to regulate the
formation of functional GABAergic synapses
We next asked how activity-dependent activation of GABA
B-Rs
translates into functional development of GABAergic synapses.
Considering that BDNF is a powerful modulator of GABAergic
synapse development (Lessmann et al., 2003), the recent
obser-vation that GABA
B-R activity increases BDNF expression in
cul-tured hippocampal neurons (Ghorbel et al., 2005) prompted us
to test the possible contribution of BDNF-tropomyosin-related
kinase (TrkB) receptor signaling to this synaptic development. P1
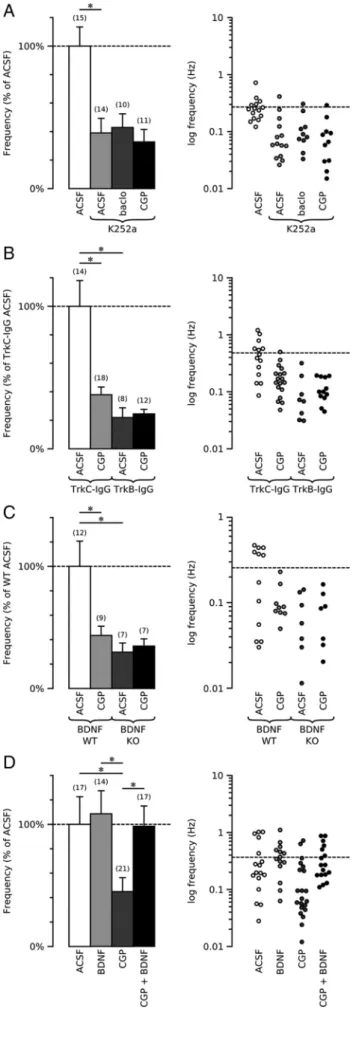
WT IHFs were incubated for 12–16 h with k252a (200 n
M), a
membrane-permeable inhibitor of protein tyrosine kinase. In
k252a-treated IHFs, the frequency of mGABA
A-PSCs was
re-duced compared with control IHFs [0.270
⫾ 0.036 Hz (n ⫽ 15) vs
0.105
⫾ 0.028 Hz (n ⫽ 14), p ⫽ 0.002] (Fig. 5A). The other
mGABA
A-PSC parameters were unchanged (supplemental Fig.
4c, available at www.jneurosci.org as supplemental material). The
deficit induced by k252a was not rescued by baclofen [0.116
⫾
0.026 Hz k252a-treated IHFs (n
⫽ 10) and 0.105 ⫾ 0.028 Hz (n ⫽
14) in k252a/baclofen-treated IHFs] (Fig. 5A; supplemental Fig.
4c, available at www.jneurosci.org as supplemental material).
Moreover, when incubated with k252a, the GABA
B-R antagonist
had no further effect on mGABA
A-PSCs [0.088
⫾ 0.024 Hz (n ⫽
11) in CGP55845/k252a-treated IHFs vs 0.105
⫾ 0.028 Hz
(n
⫽ 14) in k252a-treated IHFs] (Fig. 5A; supplemental Fig.
4c, available at www.jneurosci.org as supplemental material).
These data show that GABA
B-Rs promote the functional
mat-uration of GABAergic synapses by means of a cascade
involv-ing tyrosine kinase signalinvolv-ing.
P1 WT IHFs were then incubated with the BDNF scavenger
TrkB-IgG (1
g/ml) or with the NT3 scavenger TrkC-IgG (1
Figure 3. GABAB-Rs are primarily activated during spontaneous network-driven synapticactivity. A, Representative current traces of spontaneous GDPs recorded in GABAB1-WT
pyrami-dal neurons in control conditions and with the GABAB-R antagonist, CGP55845 (5M).
B, Representative traces of spontaneous GABAAreceptor-mediated postsynaptic currents
(sGABAA-PSCs) recorded in the presence of NBQX (10M) and D-APV (40M) with or without
CGP55845 (5M). C, Summary plot of the effect of CGP55845 on sGABAA-PSC frequency,
am-plitude, and charge transfer in GABAB1-WT neurons expressed as percentages relative to control
conditions (ACSF).
Figure 4. Characterization of synaptic activity in the developing mouse hippocampus.
A, Representative current traces of spontaneous GDPs recorded in GABAB1-WT and KO CA3
pyramidal neurons. B, Plot of the percentage of cells showing GDPs at different postnatal stages of development in GABAB1-WT (open symbols) and GABAB1-KO (filled symbols). An
average of 13⫾ 6 cells (ranging from n ⫽ 3 at P24 to n ⫽ 23 at P1) were recorded in GABAB1-WT slices, and 14⫾ 7 cells (ranging from n ⫽ 3 at P24 to n ⫽ 27 at P2) in
GABAB1-KO slices were also recorded to construct this graph. The Boltzmann fit shows that
there is no significant difference in the disappearance of GDPs between GABAB1-WT
(dashed line) and GABAB1-KO (dark line). C–E, Summary plot of GDP frequency (C),
am-plitude (D), and duration (E) in GABAB1-WT (open bars) and GABAB1-KO (filled bars).
F, Left, Summary plot of the mGABAA-PSC frequency in recordings from GABAB1-WT intact
hippocampi incubated in vitro for 12–16 h in control condition (ACSF), in the presence of TTX (1M) alone, TTX and baclofen (5M), and baclofen alone. Right, Logarithmic plot of the mGABAA-PSC frequency in recordings from GABAB1-WT and GABAB1-KO intact
hip-pocampi incubated in the corresponding conditions. Each symbol represents the result of one single cell. The dashed line represents the mean value obtained from GABAB1-WT
g/ml). The frequency of mGABA
A-PSCs was significantly
re-duced in TrkB-IgG-treated IHFs (0.105
⫾ 0.033 Hz, n ⫽ 8)
com-pared with TrkC-IgG-treated IHFs (0.481
⫾ 0.087 Hz, n ⫽ 14,
p
⫽ 0.001) (Fig. 5B). The other mGABA
A-PSC parameters were
not affected (supplemental Fig. 4d, available at www.jneurosci.
org as supplemental material). The GABA
B-R antagonist had no
further effect on mGABA
A-PSC frequency when incubated with
TrkB-IgG (0.117
⫾ 0.015 Hz, n ⫽ 12) (Fig. 5B; supplemental Fig.
4d, available at www.jneurosci.org as supplemental material) but
significantly decreased the frequency of mGABA
A-PSCs when
incubated with TrkC-IgG (0.481
⫾ 0.087 Hz, n ⫽ 14, p ⫽ 0.006
compared TrkC-IgG-treated IHF) (Fig. 5B; supplemental Fig. 4d,
available at www.jneurosci.org as supplemental material). These
data show that endogenous GABA and BDNF, acting on GABA
B-Rs
and TrkB-Rs, respectively, interact to promote the functional
maturation of hippocampal GABAergic synapses.
To confirm the requirement of GABA
B-R and BDNF
interac-tion for the funcinterac-tional maturainterac-tion of GABAergic synapses, P1
IHFs obtained from BDNF-KO and WT littermates were
incu-bated for 12–16 h in control ACSF or with CGP55845 (5
M).
Incubation with the GABA
B-R antagonist had no effect on the
frequency of mGABA
A-PSCs recorded from BDNF-KO IHFs
[0.074
⫾ 0.019 Hz in control IHF (n ⫽ 8) vs 0.082 ⫾ 0.019 Hz in
CGP55845-treated IHFs (n
⫽ 8)] but significantly decreased the
frequency of mGABA
A-PSCs recorded from BDNF-WT IHFs
[0.248
⫾ 0.052 Hz in control IHF (n ⫽ 12) vs 0.108 ⫾ 0.018 Hz in
CGP55845-treated IHFs (n
⫽ 9), p ⫽ 0.03] (Fig. 5C;
supplemen-tal Fig. 4f, available at www.jneurosci.org as supplemensupplemen-tal
mate-rial). Moreover, the frequency of mGABA
A-PSCs from IHFs
incubated in control ACSF was significantly reduced in BDNF-KO
when compared with their wild-type littermates ( p
⫽ 0.01) (Fig.
5C), showing that BDNF is required for the functional
matura-tion of hippocampal GABAergic synapses. Altogether, these data
strengthen the conclusion that GABA
B-Rs and BDNF interact to
promote the maturation of GABAergic synapses in the
develop-ing mouse hippocampus.
To better determine the interplay between GABA
B-Rs and
BDNF-TrkB signaling, we attempted to rescue the deficit induced by
CGP55845 with exogenous BDNF. P1 WT IHFs were incubated
with CGP55845 (5
M) alone or with CGP55845 (5
M) and
BDNF (50 ng/ml) for 12–16 h. BDNF rescued the deficit induced
by CGP55845. The mGABA
A-PSC frequency was 0.165
⫾ 0.042 Hz
in CGP55845-treated IHFs (n
⫽ 21) and 0.331 ⫾ 0.069 Hz in
CGP55845 and BDNF-treated IHFs (n
⫽ 17, p ⫽ 0.014) (Fig. 5D;
supplemental Fig. 4e, available at www.jneurosci.org as
supple-4
Figure 5. GABABand BDNF-TrkB signaling interact to promote the formation of functional
GABAergic synapses. A, Left, Summary plot of the mGABAA-PSC frequency in recordings from
GABAB1-WT intact hippocampi incubated in vitro for 12–16 h in control conditions (ACSF) or
with K252a alone (200 nM), K252a plus CGP55845 (5M), or K252a plus baclofen (baclo; 5M).
B, Left, Summary plot of the mGABAA-PSC frequency in recordings from GABAB1-WT intact
hippocampi incubated in vitro for 12–16 h in the presence of TrkC-IgG (1g/ml) alone, TrkC-IgG plus CGP55845 (CGP, 5M), TrkB-IgG (1g/ml) alone, or TrkB-IgG plus CGP55845 (5 M).
C, Left, Summary plot of the mGABAA-PSC frequency in recordings from BDNF-WT and BDNF-KO
intact hippocampi incubated in vitro for 12–16 h in control conditions (ACSF) or with CGP55845 (5M). D, Left, Summary plot of the mGABAA-PSC frequency in recordings from GABAB1-WT
intact hippocampi incubated in vitro for 12–16 h in control conditions (ACSF) or with BDNF (50 ng/ml), CGP55845 (CGP; 5M), or BDNF (50 ng/ml) plus CGP55845 (5M). The graphs on the
right in A–D represent the logarithmic plot of the mGABAA-PSC frequency in recordings from
the intact hippocampi incubated in the corresponding conditions. Each symbol represents the result of one single cell. The dashed line represents the mean value obtained from GABAB1-WT
mental material). Incubation with BDNF (50 ng/ml) alone,
how-ever, had no significant effect on mGABA
A-PSC frequency when
compared with control WT IHFs [0.36
⫾ 0.088 Hz in control
IHFs (n
⫽ 17) vs 0.407 ⫾ 0.038 Hz in BDNF-treated IHFs (n ⫽
14)] (Fig. 5D; supplemental Fig. 4e, available at www.jneurosci.
org as supplemental material). With the observation that
ba-clofen failed to rescue the deficit in GABAergic synaptic activity
induced by k252a (Fig. 5A), these data
show that GABA
B-Rs promote the
matu-ration of GABAergic synapses by
control-ling the amount of available extracellular
BDNF.
Activation of GABA
B-Rs triggers
BDNF release
We next asked how GABA
B-Rs control
ex-tracellular BDNF availability. GABA
B-Rs
could modulate the production and/or
se-cretion of BDNF. To determine whether
GABA
B-Rs modulate BDNF production,
we measured the level of BDNF in
hip-pocampi of GABA
B1-KO and GABA
B1-WT
by use of an ELISA and found no
signifi-cant difference (110
⫾ 7 pg/ml total
pro-tein vs 109
⫾ 10 pg/ml total protein,
respectively, n
⫽ 5 for both).
In an attempt to determine whether
GABA
B-Rs could modulate the
secre-tion of BDNF, we sought to measure the
amount of BDNF released from mouse
hippocampi in vitro upon GABA
B-R
ac-tivation using ELISA. However, levels of
BDNF in these samples were below the
threshold for detection of the assay. We
therefore examined whether activation of
GABA
B-Rs triggers BDNF release at the
cellular level. With this aim, we
trans-fected cultured hippocampal neurons
with GFP-tagged BDNF and monitored
dendritic BDNF-GFP secretion with
time-lapse fluorescent imaging in living
neurons. Using this approach,
BDNF-GFP secretion was detectable as a decrease
in intracellular GFP fluorescence intensity
(Kuczewski et al., 2008b). To exclude
in-direct effects of synaptic activity,
GABAer-gic and glutamaterGABAer-gic ionotropic receptor
antagonists were present. Baclofen (10
M) led to a significant decrease of
den-dritic BDNF-GFP fluorescence intensity
[
⫺2.6 ⫾ 0.63% change 5 min after
ba-clofen application, n
⫽ 62 regions of
in-terest (ROIs) from 14 cells, p
⫽ 0.0008
compared with control period, p
⫽ 0.01
compared with nonstimulated neurons,
n
⫽ 107 ROIs from 23 cells] (Fig. 6A–C).
The decrease in fluorescence intensity
in-duced by baclofen was prevented by
CGP55845 (10
M,
⫺0.74 ⫾ 0.53%
change 5 min after baclofen application,
n
⫽ 42 ROIs from 11 cells, p ⫽ 0.03
com-pared with baclofen alone) (Fig. 6 D) and
by nominally Ca
2⫹-free extracellular
so-lution (0.005
⫾ 0.005% change after 5 min of baclofen
applica-tion, n
⫽ 31 ROIs from 7 cells, p ⫽ 0.0006 compared with
baclofen alone) (Fig. 6 E). The baclofen-induced secretion of
BDNF-GFP was confirmed by surface-bound BDNF-GFP
im-munostaining (Kuczewski et al., 2008b). Bath-applied baclofen
(10
M, 10 min) increases GFP staining surrounding the
BDNF-GFP-expressing cell (Fig. 6 F). Quantification of surface-bound
Figure 6. GABAB-R activation triggers BDNF-GFP secretion. A, Examples of dendritic BDNF-GFP granules are shown before andafter baclofen application. Blue and red circles highlight examples of the BDNF-GFP clusters of fluorescence analyzed. The fluores-cence was enhanced to near-saturation levels to make fluoresfluores-cence variation visible. Scale bar, 5m.B–E,Averagetimecourseof dendritic fluorescence variation in control, nonstimulated neurons (B) (n⫽ 107 ROIs from 23 cells), and in baclofen-stimulated neurons in the absence (C) (n⫽ 62 ROIs from 14 cells) or presence (D) (10M, n⫽ 42 ROIs from 11 cells) of CGP35845, or in
nominally Ca2⫹-free external solution (E) (0.5 mMCa2⫹, 200MCd2⫹, n⫽ 31 ROIs from 7 cells). All experiments were performed in the presence of bicuculline (20M), NBQX (10M), and D-APV (40M). F, Surface staining confirmed the BDNF-GFP
secretion produced by baclofen. Overlapped images showing intracellular BDNF-GFP fluorescence (green) and secreted BDNF-GFP detected using anti-GFP antibody (red) under nonpermeabilized conditions in control [bicuculline (20M), NBQX (10M), and D-APV (40M)] and baclofen-treated sister cultures. Released BDNF-GFP that bound to the extracellular membrane of
BDNF-GFP-expressing neurons appears as a yellow signal. Scale bar, 20m. G, Quantitative analysis of surface-bound GFP on BDNF-GFP-expressing neurons (yellow signal/green signal) in control (n⫽ 10 cells), baclofen-treated (n ⫽ 10 cells), and baclofen (10 M) and CGP55845 (10M)-treated cultures (n⫽ 11 cells) in the presence of bicuculline (20M), NBQX (10M), and D-APV (40 M). Surface-bound BDNF-GFP on BDNF-GFP-expressing neurons was also quantified in nontreated (n⫽ 10 cells) and CGP55845
BDNF-GFP on transfected neurons shows that baclofen
signifi-cantly increased BDNF-GFP release (n
⫽ 10 cells for both, 3
cultures, p
⫽ 0.04 compared with control) (Fig. 6G). This effect
was prevented by CGP55845 (10
M, n
⫽ 11 cells, 3 cultures)
(Fig. 6G), which when applied alone had no effect on
surface-bound BDNF-GFP in control conditions (n
⫽ 5 cells, 3 cultures)
(Fig. 6G).
These data show that GABA
B-R activation can trigger
secre-tion of BDNF-GFP from hippocampal neurons in culture.
How-ever, protein overexpression could have modified the release
properties of BDNF. To determine whether GABA
B-R activation
can trigger secretion of endogenous BDNF, we used the
phos-phorylated form of the cAMP response element-binding protein
CREB (pCREB) as a sensor of endogenous BDNF release
(Kuc-zewski et al., 2008b). Once released, BDNF interacts with TrkB
receptors to activate downstream signaling pathways. One of the
most common is the ERK (extracellular signal-regulated
ki-nase) pathway, which leads to the phosphorylation of CREB
(Ghosh et al., 1994). We therefore tested whether baclofen can
induce a BDNF-dependent phosphorylation of CREB.
Hip-pocampal neuronal cultures were stimulated with baclofen (3
and 50
M) for 10 min in the presence of NBQX (10
M), D-APV
(50
M), and bicuculline (20
M). To rule out a possible effect of
baclofen treatment on CREB synthesis and to normalize the
results obtained from different cultures, the pCREB/CREB ratio
was quantified (Fig. 7 A, B). At 3
M, baclofen induced a
signifi-cant increase of the pCREB/CREB ratio [30
⫾ 11% in control
(n
⫽ 74 cells, 3 cultures) versus 43 ⫾ 7% in baclofen-treated (n ⫽
64 cells, 3 cultures) cultures, p
⫽ 0.001]. At 50
M, baclofen
induced a threefold increase of the pCREB/CREB ratio [from
27
⫾ 5% in control (n ⫽ 42 cells, 3 cultures) versus 77 ⫾ 13% in
baclofen-treated (n
⫽ 54 cells, 3 cultures) cultures, p ⫽ 0.00008]
(Fig. 7B). This increase was prevented by CGP55845 (10
M, n
⫽
43 cells; 3 cultures, p
⫽ 0.0003 compared with baclofen) (Fig. 7B),
showing that GABA
B-R activation is required. No difference in
the pCREB/CREB ratio was observed when the cultures were
stimulated by baclofen in the presence of the BDNF scavenger
TrkB-IgG (2
g/ml, n ⫽ 21 cells, 3 cultures, p ⫽ 0.0002 compared
with baclofen) (Fig. 7B). As expected, BDNF (20 ng/ml) triggered
a phosphorylation of CREB and an increase in the pCREB/CREB
ratio (n
⫽ 40 cells, 3 cultures, p ⫽ 0.0001 compared with control)
(Fig. 7B). Thus, GABA
B-R activation triggers secretion of
endog-enous BDNF.
Discussion
GABA, the main inhibitory transmitter in the adult vertebrate
brain, has recently emerged as an important signal for neuronal
development. Besides its classical role in regulating synaptic
activity, GABA modulates nearly all key steps of network
con-struction from neuronal migration to experience-dependent
re-finement of local connections (Ben-Ari et al., 2007). Most of
these effects have been attributed to the depolarizing action of
GABA, which leads to a postsynaptic rise in intracellular Ca
2⫹concentration in developing neurons via the activation of
chloride-permeable GABA
A-Rs (Ben-Ari et al., 2007). Here, we
reveal a novel mechanism by which endogenous GABA
selec-tively regulates the development of GABAergic synapses. We
found that activation of metabotropic GABA
B-Rs triggers
secre-tion of BDNF and promotes the development of GABAergic
syn-apses in the hippocampus of newborn mice. Moreover, we show
that this process occurs during ongoing physiological patterns of
activity.
Our study shows that GABA
B-R signaling plays a role in
self-regulating inhibitory synapse development. We have identified a
selective deficit in miniature GABAergic synaptic activity in
GABA
B1-KO hippocampal pyramidal cells that can be
repro-duced in vitro in wild-type hippocampi in which GABA
B-Rs were
pharmacologically blocked. Miniature GABAergic activity was
also reduced in wild-type hippocampi incubated with TTX, to
block action potential-dependent synaptic activity and
subse-quent activation of GABA
B-Rs. The TTX-induced deficit was
rescued by the selective GABA
Breceptor agonist, baclofen,
showing that GABA
B-R activation is required for the
func-tional maturation of GABAergic synapses. Although we
can-not completely rule out functional presynaptic modifications,
we provide morphological data suggesting that the reduced
GABAergic activity in GABA
B1-KO mice is at least in part due
to a decrease in the number of perisomatic GABAergic
termi-nals. This result is consistent with previous findings that
syn-aptic activity (Chattopadhyaya et al., 2004) and endogenous
GABA levels (Chattopadhyaya et al., 2007) regulate cortical
bas-ket cell axon branching and perisomatic synapse formation
through the activation of GABA
Aand GABA
Breceptors. Since
miniature activity has been proposed to originate from proximal
Figure 7. GABAB-R activation induces a BDNF-dependent phosphorylation of CREB inhip-pocampal neuronal cultures. A, Immunofluorescence signal of CREB (red, left panels) and phos-phorylated CREB (pCREB, green, middle panels) in hippocampal neuronal cultures in control conditions (top panels) or treated with baclofen in the absence (middle panels) or presence (bottom panels) of TrkB-IgG. Merged images are shown on the right. Scale bar, 10m. B, Average pCREB/CREB ratio in the different conditions. For each condition, three different sister cultures were used, and quantification was based on 7–18 cells per culture. baclo, Baclofen; CGP, CGP55845.
GABAergic synapses (Soltesz et al., 1995), a decrease in the
den-sity of those synapses will significantly affect the frequency of
mGABA
A-PSCs in GABA
B1-KO pyramidal cells.
The timing of disappearance of GDPs, whose generation
crit-ically depends on depolarizing action of GABA (Ben-Ari et al.,
2007), was not affected between GABA
B1-KO and WT mice. This
result suggests that the depolarizing-to-hyperpolarizing
develop-mental shift in GABA
Areceptor-mediated responses is not affected
in GABA
B1-KO mice. Accordingly, we found that bath-applied
isoguvacine, a selective GABA
A-R agonist, increased the spiking
activity of CA3 pyramidal neurons during the first postnatal week
of life in both GABA
B1-KO and WT mice (unpublished
observa-tions). Several studies have shown that the depolarizing and
ex-citatory action of GABA
Areceptors is an important signal for
neuronal network development (Barbin et al., 1993; Manent et
al., 2005; Cancedda et al., 2007; Wang and Kriegstein, 2008);
this might explain the lack of structural alterations or
modifi-cations in the morphology of CA3 pyramidal neurons in
GABA
B1-KO mice.
We show that the mechanism by which GABA
B-Rs promote
the formation of GABAergic synapses in vivo likely involves
BDNF secretion and subsequent activation of the TrkB signaling
pathway. k252a or TrkB-IgG mimicked and occluded the
delete-rious effect of GABA
B-R blockade, the GABA
B-R antagonist had
no effect on BDNF-KO mice, and GABA
B-R activation triggered
dendritic Ca
2⫹-dependent secretion of BDNF in hippocampal
cultures. The fact that BDNF is necessary for the maturation of
GABAergic synapses has been clearly established, but the source
and mechanism of its activity-dependent release have remained
unexplored. So far, at least three distinct signals regulating
den-dritic BDNF secretion have been directly identified in neuronal
cultures (Kuczewski et al., 2009): (1) tetanic stimulation of
pre-synaptic glutamatergic fibers (Hartmann et al., 2001), (2)
ac-tion potentials that propagate backwards into the dendrites
(Kuczewski et al., 2008b), and (3) prolonged depolarization of
the postsynaptic neuron (Magby et al., 2006). Our study provides
a novel and unexpected mechanism by which synaptic activity
can trigger a Ca
2⫹-dependent dendritic release of BDNF.
Important questions remain about the cell type and the
loca-tion of GABA
B-Rs involved in vivo. Because GABAergic
interneu-rons and glial cells do not produce neurotrophins themselves
(Ernfors et al., 1990), BDNF is likely provided by CA3 pyramidal
neurons (Brigadski et al., 2005) or the mossy fibers arising from
dentate gyrus granular cells (Danzer and McNamara, 2004).
GABA
B-R activation can increase the intracellular Ca
2⫹concen-tration in neurons (Shen and Slaughter, 1999; Hirono et al., 2001;
New et al., 2006). A recent study has shown that the
phosphory-lation of
␣-CaMKII, a critical step in BDNF secretion (Kolarow et
al., 2007), is enhanced by GABA
B-R activation in the developing
rat hippocampus (Xu et al., 2008). Thus, postsynaptic Ca
2⫹ele-vation and
␣-CaMKII phosphorylation might underlie the
GABA
B-R-induced secretion of BDNF and development of
GABAergic synapses that we found in the present study.
Alterna-tively, GABA
B-Rs can increase Ca
2⫹concentration in glial cells
(Kang et al., 1998; Meier et al., 2008) and indirectly trigger
neu-ronal secretion of BDNF (Elmariah et al., 2005). Further
experi-ments will be required to address this point.
Regulated activity-dependent release of BDNF is crucial for
many different aspects of GABAergic and glutamatergic synapse
development (Lu et al., 2005). However, because BDNF diffusion
(Horch and Katz, 2002) and Ca
2⫹rise are rather restricted
events, spatial proximity is required between the signal that
trig-gers the secretion of BDNF and the target. Synaptic activation of
ionotropic glutamatergic receptors has been previously reported
to trigger a localized dendritic release of BDNF (Hartmann et al.,
2001) and a potentiation of GABAergic synaptic activity in the
developing rat hippocampus (Kuczewski et al., 2008a). However,
glutamatergic synapses are restricted to the dendrites. Thus,
ac-tivation of somatic GABA
B-Rs might trigger the local and specific
secretion of BDNF needed for the development of perisomatic
GABAergic synapses. Such specificity in the control of BDNF
secretion might explain why perisomatic GABAergic synapses,
but not glutamatergic or dendritic GABAergic synapses, are
im-paired in GABA
B1-KO hippocampi. Thus multiple triggers of
BDNF secretion might coexist in the hippocampus. Depending
on the pattern of activity generated by the neuronal network,
BDNF could exert a selective control on the development of
dif-ferent subpopulations of GABAergic synapses. The reason why
GABA
B-R-mediated trophic action is selective for perisomatic
GABAergic synapses remains to be clarified. One likely possibility
is that the effectors linking GABA
B-R activation to BDNF
secre-tion are exclusively localized at the perisomatic level.
GABA
B-Rs are located at perisynaptic or extrasynaptic sites,
and thus GABA spillover is needed to activate them. GABA
spill-over becomes substantial during high-frequency stimulation
(Isaacson et al., 1993; Xu et al., 2008) or concomitant activation
of several interneurons or when the GABA uptake is blocked
(Scanziani, 2000). In the developing hippocampus, most of the
ongoing synaptic activity is provided by a primitive
network-driven pattern, termed GDPs, present both in vitro (Ben-Ari et al.,
1989) and in vivo (Leinekugel et al., 2002). GABAergic
interneu-rons fire synchronously during GDPs (Khazipov et al., 1997).
GDPs therefore fulfil the criteria for GABA
B-R activation
(McLean et al., 1996). Accordingly, we found that the lack of
GABA
B-R function in GABA
B1-KO neurons resulted in
length-ening of GDPs. In contrast, when GDPs were blocked in
GABA
B1-WT neurons, the GABA
B-R antagonist had no
signifi-cant effect on spontaneous GABAergic activity. Thus, the
activa-tion of GABA
B-Rs required the presence of GDPs. We therefore
propose that GDPs play an instructive role in the development of
the hippocampal GABAergic circuit, providing the critical
amount of GABA needed to activate GABA
B-Rs and trigger a
subsequent secretion of BDNF. Accordingly, a deficit in
GABAer-gic synaptic activity was observed when GDPs were blocked with
TTX, but not when GDPs were blocked with the GABA
B-R
ago-nist baclofen. Thus, baclofen substitutes for GDPs to activate
GABA
B-Rs showing that the activation of these receptors is
suf-ficient to support a proper development of at least perisomatic
GABAergic synapses. This conclusion is strengthened by the
ob-servation that the TTX-induced deficit was rescued by baclofen.
Since early spontaneous network-driven activity similar to GDPs
and subsequent activation of GABA
B-Rs appear to occur in
vir-tually every developing circuit (Obrietan and Van den Pol, 1999;
Catsicas and Mobbs, 2001), it is possible that this mechanism is
important for synaptic maturation throughout the nervous
system.
References
Barbin G, Pollard H, Gaïarsa JL, Ben-Ari Y (1993) Involvement of GABAA receptors in the outgrowth of cultured hippocampal neurons. Neurosci Lett 152:150 –154.
Behar TN, Li YX, Tran HT, Ma W, Dunlap V, Scott C, Barker JL (1996) GABA stimulates chemotaxis and chemokinesis of embryonic cortical neurons via calcium-dependent mechanisms. J Neurosci 16:1808 –1818. Behar TN, Smith SV, Kennedy RT, McKenzie JM, Maric I, Barker JL (2001)