HAL Id: hal-01190572
https://hal.archives-ouvertes.fr/hal-01190572
Submitted on 2 Sep 2015HAL is a multi-disciplinary open access archive for the deposit and dissemination of sci-entific research documents, whether they are pub-lished or not. The documents may come from teaching and research institutions in France or abroad, or from public or private research centers.
L’archive ouverte pluridisciplinaire HAL, est destinée au dépôt et à la diffusion de documents scientifiques de niveau recherche, publiés ou non, émanant des établissements d’enseignement et de recherche français ou étrangers, des laboratoires publics ou privés.
Embolism resistance of conifer roots can be accurately
measured with the flow-centrifuge method
Pauline S Bouche, Steven Jansen, Hervé Cochard, Regis Burlett, Gaelle
Capdeville, Sylvain Delzon
To cite this version:
Pauline S Bouche, Steven Jansen, Hervé Cochard, Regis Burlett, Gaelle Capdeville, et al.. Embolism resistance of conifer roots can be accurately measured with the flow-centrifuge method. Journal of Plant Hydraulics, INRA Science and Impact, 2015, 2, pp.e002. �hal-01190572�
Journal of Plant Hydraulics 2: e-‐002
© The Authors
Embolism resistance of conifer roots can be accurately
measured with the flow-centrifuge method
Pauline S. Bouche
1,2,3, Steven Jansen
1, Hervé Cochard
4, Regis Burlett
2,3, Gaelle Capdeville
2,3,
Sylvain Delzon
2,31
Institute for Systematic Botany and Ecology, Ulm University, D-89081, Ulm, Germany;
2INRA, UMR1202
BIOGECO, F-33610 Cestas, France;
3University of Bordeaux, BIOGECO, UMR 1202, F-33600 Pessac,
France;
4INRA, UMR 457 PIAF, Clermont University, F-63100 Clermont-Ferrand, France
Corresponding author: Pauline Bouche, [email protected]
Date of submission: May 7, 2015 Date of publication: September 1, 2015
Abstract
Resistance to embolism of conifer branches has commonly been studied with the flow-centrifuge technique (Cavitron) to carry out routine measurements. The aim of this study was to test the accuracy of the Cavitron for measurements on conifer roots. Based on earlier findings, it was suggested that the application of the flow-centrifuge technique to roots may not be free from artefacts due to potential torus aspiration when the pressure gradient between the sample ends is high. Here, three different protocols were used to obtain vulnerability curves in Pinus pinaster and
Pseudotsuga menziesii roots: no water pressure
gradient, and low and high water pressure gradient. In addition water extraction curves were obtained to only estimate the water released from conduits by embolism. Water extraction curves showed no water release caused by embolism before -1.3 and -2.5 MPa for P. pinaster and P. menziesii, respectively. The results illustrated discrepancies between these protocols: roots measured with the high and low pressure gradient protocols appeared erroneously more vulnerable to embolism than roots measured with no pressure gradient. In addition, pit anatomical observations of roots showed non-punctured tori and a high flexibility of the margo, which may increase the risk of torus aspiration. All together these results suggest that the early loss of hydraulic conductivity observed for the low and high pressure gradient protocols was
not due to embolism but rather to a torus aspiration artefact when the pressure gradient is too high. We conclude that the no pressure gradient protocol provides a suitable method and that high vulnerability to embolism reported in previous studies for conifer roots should be interpreted with caution in the light of our findings.
Introduction
Water uptake and its long-distance transport through the xylem tissue are essential processes for replacing the amount of water that is lost during photosynthesis by transpiration (Zimmermann 1983, Kramer & Boyer 1995). While many studies have examined water transport characteristics of branches, our insights into the whole-plant hydraulic behaviour also requires research on hydraulics of roots. Due to embolism formation, non-functional conduits may significantly affect water uptake and reduce the whole-plant hydraulic conductivity (Linton and Nobel 1999). Although plants may prevent xylem embolism at relatively high water potentials (close to zero MPa) by stomatal closure, embolised conduits may have considerable consequences for plant growth under drought stress (Jones and Sutherland 1991, Cochard et al. 2002a, Fichot et al. 2010). Ultimately, high levels of embolised conduits during severe drought may lead to desiccation and plant death (Brodribb and Cochard 2009, Brodribb et al. 2010, Urli et al. 2013).
Measurements of embolism resistance in xylem contribute significantly to our understanding of plant hydraulics (Cochard et al. 2013). Several methods
Journal of Plant Hydraulics 2: e-‐002
2
have been developed to measure embolism resistance, such as air-injection with a single-ended or double-ended pressure chamber, a dehydration method, and centrifuge techniques. The latter method allows us to produce vulnerability curves in a short period of time (Cochard et al. 2005, 2007). Both static- and flow-centrifuge techniques use a centrifugal force to create a negative xylem pressure that induces embolism in the sample (P, MPa). For the static method, hydraulic conductivity is determined gravimetrically by using a central segment of a branch after spinning it in a centrifuge (Pockman et al. 1995), or by using the whole sample if the ends are maintained under water during centrifugation (Alder et al. 1997). For the flow-centrifuge (also called the Cavitron), samples are placed in a custom-built rotor with both sample ends in reservoirs filled with water. In order to generate a pressure gradient (ΔP, MPa) across the sample and thus induce water flow through the sample, small holes are made in the reservoirs at two distances from the rotation axis (Cochard et al. 2005). The hydraulic conductivity can then be determined during centrifugation and a vulnerability curve is typically obtained in less than 20 min.
It has been shown that a high ΔP in conifers might cause sealing of the pit aperture by torus aspiration, thus preventing the water flow between two adjacent tracheids and consequently decreasing xylem hydraulic conductivity (Pappenheim 1889, Sperry and Tyree 1990). However, when using a standard rotor (27cm in diameter), vulnerability curves of conifer branches that are measured with the cavitron technique correspond well with other standard hydraulic methods (Cochard et al. 2005, Li et al. 2008) and with water extraction curves (Cochard et al. 2010, Beikircher et al. 2010), suggesting that torus aspiration is not problematic for branches. The water extraction method allows us to measure the amount of water stored in a sample, and typically includes three types of water release: 1) the elastic storage (Tyree and Yang 1990), 2) the capillary water release, which corresponds to the water held by capillary forces in the tapered ends of small embolised xylem cells or in intercellular spaces (Zimmermann 1983, Tyree and Yang 1990), and 3) the water released from conduits by embolism. Tyree and Yang (1990) suggested that elastic storage can be neglected in wood as most xylem cells have thick, lignified and inelastic walls. This may especially apply to conifers in which the tissue fraction of parenchyma is generally below 10% of the entire wood tissue. It was shown for three Pinaceae species that most capillary water is released at a relatively high xylem pressure (-0.6 MPa, Tyree and Yang 1990). Consequently, the amount of water released at higher tensions corresponds to release from embolism. As vulnerability curves of branches carried out with the cavitron method correspond well to water extraction curves (Cochard et al. 2010, Beikircher et al. 2010), this suggests that the cavitron accurately measures the loss of hydraulic conductivity due to embolism.
It has been suggested that xylem properties can widely differ between roots and branches (Martínez-Vilalta et al. 2002, Hacke and Jansen 2009, Schulte et al. 2012, Schuldt et al. 2013). While Hukin et al. (2005) and Cochard et al. (2002b) showed that roots are more resistant to embolism than stems in Populus and Juglans, respectively, studies on conifer species demonstrated that roots are more vulnerable to embolism than branches (Sperry and Ikeda 1997, Hacke et al. 2000, Martínez-Vilalta et al. 2002, Domec et al. 2004, 2006, Hacke and Jansen 2009). Moreover, a large variability of root P50 values (i.e., the xylem
pressure corresponding to 50% loss of hydraulic conductivity) has been reported for a given species (e.g., -1 to -3.8 MPa for Pseudotsuga menziesii roots). This may either indicate that various techniques produce different results for this organ or that there is considerable intra-specific variation due to environmental differences. However, this variations in P50 is unlikely to be the result of quantitative variation
in wood anatomy only. Therefore, it is important to evaluate the relevance of methods used for measuring root P50 values.
In this study, we used several centrifuge methods to measure embolism resistance of roots in two conifer species, Pinus pinaster and Pseudotsuga menziesii. The main aim was to test whether the centrifuge-flow technique provides an accurate method to measure xylem embolism resistance in roots. To achieve this goal, we compared vulnerability curves based on a method without pressure gradient with (1) vulnerability curves based on two other methods (i.e., a low and high-water pressure gradient, and (2) water extraction curves.
Materials and Methods
Plant material
Roots of Pinus pinaster Aiton and Pseudotsuga menziesii (Mirb.) Franco were collected at the INRA facility in Pierroton (Bordeaux, France) in June and October 2014, respectively. A powerful blower was used to expose the root system (radius of approximately 1.5 m and 60 cm deep from the base of the tree) without causing mechanical tension or damage to the roots (Fig. S1). Sampling was carried out on a single tree per species to minimize potential intra-specific variation. Roots were exposed late in the afternoon and sampled early next morning. Only 2 to 4-year-old roots of less than 1 cm diameter were chosen. 30 roots of Pinus pinaster and 20 roots of Pseudotsuga menziesii were sampled, wrapped in wet paper, transported to a high-throughput phenotyping platform (Caviplace, University of Bordeaux, France, http://sylvain-delzon.com/?page_id=536), and kept refrigerated at 4 °C until measurements were taken.
Vulnerability curves
Prior to measurements, root samples were cut under water to a standard length of 27 cm, and the bark was gently removed with finger nails. Xylem embolism of
Journal of Plant Hydraulics 2: e-‐002
3
roots was assessed with the centrifuge-flow technique (Cavitron) using three different protocols, all using a 27 cm rotor diameter:
The no water pressure gradient method was adapted from Beikircher et al. (2010). The pressure gradient was decreased by reducing the distance between the openings of the two water reservoirs to 3 mm (Fig. 1). The maximum hydraulic conductivity (kmax, m² MPa-1 s-1) was measured at 0.5 MPa. Then,
the rotation speed was gradually increased by 0.5 or 1 MPa. In order to maintain a negligible pressure gradient while measuring hydraulic conductivity (ki,
m² MPa-1 s-1), all k
i measurements were taken at 0.5
MPa and reservoirs were emptied afterwards to avoid water flowing in the roots when increasing the pressure again. Both sample ends are kept wet during the spinning thanks to the small amount of residual water that is left at the bottom of the emptied reservoirs. Therefore, the maximum pressure gradient (ΔPmax) as estimated based on Cochard (2002) was
never higher than 0.02 MPa (Table S1, Fig. 1) during the entire vulnerability curve process in order to eliminate the risk of torus aspiration induced by a high ΔP. This “zero risk” method was considered as the reference method in this study.
For the low water pressure gradient method (Fig 1) the distance between the openings in the two water reservoirs was kept at 3 mm similar to the no pressure gradient method. The maximum hydraulic conductivity (kmax, m² MPa-1 s-1) was measured at 0.5
MPa. Then the rotation speed was gradually increased by 0.5 or 1 MPa to lower the pressure and the corresponding hydraulic conductivity (ki, m² MPa-1 s-1)
was directly measured at this rotation speed, unlike the
no pressure gradient method. According to Cochard (2002), the ΔPmax for the low pressure gradient method
varied from 0.02 to 0.3 MPa while the xylem pressure increased from -0.5 to -7 MPa (Table S1, Fig 1).
For the high water pressure gradient method (Cochard 2002, Cochard et al. 2005), a distance of 7 mm between the openings of the two water reservoirs was used (Fig 1). This method is commonly used to estimate embolism resistance of conifer branches. However, it has been shown that this method may not be free from artefacts (Cochard et al. 2013). Thus, the impact of the high pressure gradient produced with the high pressure gradient method (ΔPmax= 0.05 to 0.7
MPa; Table S1, Fig. 1) must be tested to know whether this method is accurate to estimate embolism resistance in roots.
For all three methods, the percentage loss of conductivity (PLC) of roots was determined at each pressure step following the equation:
𝑃𝐿𝐶 = 100 1 − !!
!!"#
Eq. 1 and vulnerability curves were fitted using the equation of Pammenter and Vander Willigen (1998):
𝑃𝐿𝐶 = !""
!!!"# !"!! !!!!"
Eq.2 , where P50 (MPa) is the xylem pressure inducing 50%
loss of conductivity and S (% MPa-1) is the slope of the vulnerability curve at the inflexion point. The pressure at which 12% of conductivity is lost (P12)
corresponding to the xylem air entry (for more details, see Domec and Gartner 2001) was also calculated.
Figure 1. (a) Schematic drawing of the flow-centrifuge methods applied in this paper: the distance between the openings of the
two water reservoirs was 7 mm for the high pressure gradient method (a) and 3 mm for the low and no pressure gradient method (b). Adapted from Cochard (2002). (b) Maximum water pressure difference (MPa) between the upstream and downstream reservoir as a function of xylem pressure (MPa; corresponding to the different spinning velocities) induced by the three different centrifuge-flow method: the high pressure gradient (r =7mm; blue circles), the low pressure gradient (r =3mm; red triangles), and the no pressure gradient method (r =3mm; xylem pressure kept low at -0.02 MPa; green squares). The maximum water pressure difference for each method was calculated according to Cochard (2002). For the no pressure gradient method, in addition to the reduced distance between the openings of the two water reservoirs, the conductivity was always measured at a xylem pressure of 0.5 MPa. Therefore the maximum water pressure difference induced by the no pressure gradient method remained stationary.
Journal of Plant Hydraulics 2: e-‐002
© The Authors
Water extraction curves
Water extraction curves were made with the cavitron using two intact water reservoirs encapsulating both sample ends (Cochard et al. 2010, Herbette and Cochard. 2010, Beikircher et al. 2010). Samples were first spun at 0.25 MPa and the rotation speed of the centrifuge was gradually increased by 0.2 MPa to lower xylem pressure and to allow visualization of water extraction from both ends of the sample. The respective distances run by the air-water menisci (di)
from their initial position (do) was measured until the
two menisci in both reservoirs remained stationary. This was done by reading the number of pixels directly on the camera screen at each rotation speed chosen. The measurements were repeated until a pressure was reached at which there was no longer water extraction, i.e., the sample was entirely embolised (dmax). As these
measurements were made without a pressure gradient, torus aspiration was considered to be unlikely. The relative percentage of extracted water (PEW) was calculated as the ratio di / dmax. Curves were fitted
using a vulnerability curve equation (eq. 2), where PLC and P50 were replaced by PEW and P’50 (50% of
total water extraction), respectively. According to Cochard et al. (2010), extraction curves are typically biphasic. A variable amount of water is first extracted at relatively high pressures, representing the capillary water storage. Then a considerable increase in the amount of water that is presumably extracted by embolism is recorded when xylem pressure is further decreased. To estimate more precisely our water extraction curves caused by xylem embolism, the percentages of extracted water were corrected, taking into account only the water released during the second phase of the initial curve (Cochard et al. 2010). Curves were fitted again as described above with the corrected values.
Anatomical observations
Bordered pit anatomy of roots was investigated on samples that had been used for hydraulic measurements. The three samples that were closest to the average P50 value were selected for each species.
Electron microscopy
Standard protocols were used to prepare root samples for SEM and TEM. For SEM, samples were cut with a fresh razor blade in order to have the radial tracheid walls exposed. After drying for 24 hours in an oven at 60 °C, the samples were fixed on stubs, coated with gold using a sputter coater (108 Auto, Cressington, UK) for 40 s at 20 mA, and observed under 5 kV with a benchtop SEM (PhenomG2 pro, FEI, The Netherlands).
TEM was conducted on material that was first washed with a phosphate-buffer saline solution, fixated in a 2% aqueous osmium tetroxide solution, dehydrated through a gradual ethanol series (30%, 50%, 70%,
90%), and embedded in resin (Epon). Transverse semi-thin sections were cut with an ultramicrotome (Leica Ultracut UCT, Leica Microsystems, Vienna, Austria), stained with 0.5% toluidine blue in 0.1M phosphate buffer and mounted on microscope slides using Eukitt. Ultra-thin sections between 60 nm and 100 nm were mounted on copper grids (Athena, Plano GnbH, Wetzlar, Germany) and observed with a JEM-1210 TEM (Jeol, Tokyo, Japan) at 80 kV. Digital images were taken using a MegaView III camera (Soft Imaging System, Münster, Germany).
Pit properties
SEM images of radial sections were used to measure the horizontal pit membrane diameter (DPM; µm),
horizontal pit aperture diameter (DPA; µm) and
horizontal torus diameter (DTO). The flexibility of the
margo was defined as F = (DPM-DTO) / DPM and the
torus-aperture overlap as O = (DTO-DPA) / DTO.
Based on TEM images of transverse sections, details of tori in root samples of P. pinaster and P. menziesii were observed to measure the torus thickness (TTO;
µm) and the occurrence of punctured tori as previously observed in branches (Jansen et al. 2012).
Anatomical measurements were conducted using ImageJ (Rasband 1997-2014). Moreover, a minimum of 25 measurements were carried out for each anatomical trait and more than 15 pits were observed with TEM for each species.
Statistical analyses
Variation of hydraulic parameters between methods and anatomical characteristics were assessed using a one-way analysis of variance (ANOVA). Data and statistical analyses were conducted using SAS software (version 9.4 SAS Institute, Cary, NC, USA). Results
Vulnerability curves
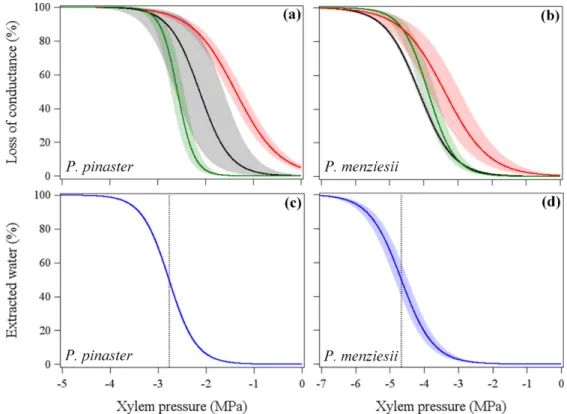
For both species, P50 values measured with the no
pressure gradient method were lower (i.e., more negative) than P50 measured with the high pressure
gradient method, but no significant difference was found in P50 between the no pressure and low pressure
gradient method (Table 1; Fig. 2a, b). However, with this latter method, we found a much higher variability of P50 values than with the no pressure gradient
method.
All vulnerability curves conducted for P. menziesii followed a sigmoidal shape (Fig. S2). In contrast, for P. pinaster, only vulnerability curves conducted with the no pressure gradient method were sigmoidal (Fig. S2). While the high pressure method only produced exponential shape curves, the low pressure method produced both sigmoidal and differently shaped curves (Fig. S2).
Journal of Plant Hydraulics 2: e-‐002
5
Table 1. Mean value (±SE) of xylem pressure at 50% loss of conductivity (P50) measured with the high pressure, low pressure and no pressure gradient method and the xylem pressure at 50% extracted water (P’50) for roots of Pinus pinaster and Pseudotsuga
menziesii, with the number of samples measured (n).
Pinus pinaster Pseudotsuga menziesii
P50 n P50 n
High pressure gradient -1.36±0.15 a 5 -3.37±0.44 a 3
Low pressure gradient -2.12±0.50 b 5 -4.13±0.05 b 5
No pressure gradient -2.58±0.13 bc 14 -3.91±0.34 b 4
P’50 n P’50 n
Water extraction -2.77±0.02 c 4 -4.67±0.21 c 4
One-way analysis of variance; bold letters (a, b, c) indicate to what extent features are significantly different between organs for a given species (p<0.05).
Figure 2. Vulnerability curves for root of two conifer species showing the percentage loss of conductivity as a function of xylem
pressure, based on 4 different cavitron methods. We applied a high pressure gradient (HP, red), a low pressure gradient (LP, black) and no pressure gradient (NP, green) between the upstream and downstream reservoir at both ends of the sample. Root water extraction curves (EW, blue) show the percentage of extracted water per xylem pressure (MPa), but were modified to include only the water released by embolism. The shaded bands represent the standard errors. Verticals lines show P50 (i.e., xylem pressure at 50% loss of conductivity) for the water extraction curves. nHP=5 and 3, nLP=5 and 5, nNP=14 and 4; nEW=4 and 4 for P.
pinaster and P. menziesii, respectively.
Water extraction curves
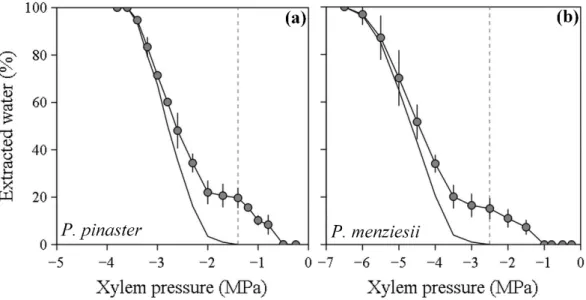
For both species, water extraction curves were biphasic (see the Materials and methods). A variable amount of water was first released before -1.3 and -2.5 MPa for P. pinaster and P. menziesii, respectively (phase 1; Fig. 3). Then, when the pressure was further
increased, a clear increase in water release was observed (phase 2; Fig 3). P’12 and P’50 values
estimated from the corrected water extraction curves, which only take into account the water released during the second phase of the initial curve, corresponded well to the P50 and P12 values measured with the no
Journal of Plant Hydraulics 2: e-‐002
6
Figure 3. Root water extraction curves showing the relative percentage of extracted xylem water as a function of xylem pressure
(MPa) in two Pinaceae species: Pinus pinaster (a) and Pseudotsuga menziesii (b). A first release of water is observed at relatively high pressure (phase 1) and then a more drastic release of water occurs when pressure is further decreased (Phase 2). The dashed line shows the transition between phase 1 and phase 2 for the water extraction curves (-1.3 and -2.5 MPa). The corrected water extraction curve that is only based on the water released by embolism formation (phase 2) is represented by the solid line.
Anatomy
Pit dimensions in roots were slightly different between the two species: while the torus diameter (DTO) was
similar in both species, the pit membrane diameter (DPM) and pit aperture diameter (DPA) were
significantly larger in P. pinaster than in P. menziesii (DPM = 26.4 ± 0.5 and 20.05 ± 0.2 µm, DPA = 9.0 ± 0.1
and 4.3 ± 0.12 µm, respectively; Table 2; Fig. 4). Consequently, P. pinaster presented both a higher
flexibility of the margo (F) and a lower torus-aperture overlap (O) than roots of P. menziesii (F= 0.61 ± 0.02 and 0.53 ± 0.01, O= 0.32 ± 0.01 and 0.43 ± 0.01, respectively; Table 2). In addition, TEM observations showed that the torus structure was similar between both species. Indeed, tori were equally thick (TTO=
1.71 ± 0.11 and 1.28 ± 0.06 µm for P. pinaster and P. menziesii, respectively) and non-punctured (Fig. 5).
Figure 4. SEM images of radial sections showing anatomical details of bordered pits of roots of Pinus pinaster (a) and
Pseudotsuga menziesii (b). The torus-margo pit is aspirated and shows the outline of the pit aperture underneath the torus. DPM, pit membrane diameter; DTO, torus diameter; DPA, pit aperture diameter.
Journal of Plant Hydraulics 2: e-‐002
7
Figure 5. TEM transverse sections showing anatomical details of aspirated tori (pressed against the pit aperture borders) in
bordered pits of roots of Pinus pinaster (a) and Pseudotsuga menziesii (b). Both species showed unpunctured tori of similar thickness (TTO= 1.71±0.11 and 1.28±0.06 µm for P.pinaster and P. menziesii, respectively).
Discussion
The vulnerability curves obtained showed different P50 values depending on the method applied. For
both species, vulnerability curves made with the no pressure gradient method (negligible ΔP) were shifted to more negative water potential values compared to the high pressure gradient curves (high ΔP), which showed a reduction of hydraulic conductivity at relatively high pressure (close to zero MPa). This discrepancy is presumably not due to embolism but to torus aspiration.
The artefact of torus aspiration has not been observed previously in branch xylem when using the high pressure cavitron technique. However, when using a 15cm rotor, Beikircher et al. (2010) highlighted that a high pressure gradient might induce artefacts due to torus aspiration in branch xylem at relatively high xylem pressure (P), causing blockage of bordered pits and consequently a decrease in the hydraulic conductivity that is independent of embolism events. In addition, Bouche et al. (2014; unpublished data) found that the pressure gradient needed to induce torus aspiration in conifer branches was strongly associated with the flexibility of the margo and thus to pit anatomy. Previous studies showed that xylem and pit anatomy differ widely between roots and branches (Sperry and Ikeda 1997, Martinez-Vilalta et al. 2002, Domec et al. 2006). Our results showed that in P. pinaster, the margo flexibility is higher in roots (Froot= 0.61) than in branches (Fbranch = 0.41;
Bouche et al. 2014). In addition, the margo flexibility of P. pinaster root is also higher than the maximum margo flexibility value reported in branches of 36 Pinaceae species by Bouche et al. (2014 and unpublished data; Fmin = 0.39, Fmax =
0.54, Fmean = 0.51 ± 0.05). These authors also
showed that the minimum theoretical water pressure gradient inducing torus deflection (PTD, i.e. torus
aspiration) in P. pinaster and P. menziesii branches, was higher (PTD = 0.18 and 0. 21 MPa, respectively)
than the water pressure gradient applied at relatively high xylem pressure when using the high and low pressure gradient method (ΔPmax = 0.05 to 0.16
MPa, corresponding to P = - 0.5 to -1.5 MPa; see Table S1). Consequently, while the pressure gradient that is produced with the high pressure method does not affect pit aspiration in branches, it may induce torus aspiration in bordered pits of root samples.
The corrected water extraction curves, which estimate more precisely the extraction of water due to xylem embolism (Cochard et al. 2010), showed results closer to vulnerability curves made with the no pressure and low pressure gradient methods than with the high pressure gradient method. This confirms that embolism events do not occur at high pressures (0 to -1.3 or -2.5 MPa for P. pinaster and P. menziesii, respectively) and consequently, that the change in the shape of vulnerability curves based on the high pressure gradient method were not due to embolism events but rather to torus aspiration.
The difference in vulnerability curves based on the three methods applied was higher in P. pinaster than in P. menziesii. The low and no pressure gradient method presented similar results for both species. However, in P. pinaster, we found a higher variability with the low pressure gradient method, which did not only produce sigmoidal curves, but also non-sigmoidal curves, suggesting the occurrence of torus aspiration with the low pressure gradient method. Consequently, the no pressure gradient method appears to offer a reliable method to avoid torus aspiration. The high pressure gradient method, however, which has proven to be accurate and fast and is commonly used to measure embolism resistance in conifer branches (Li et al.
Journal of Plant Hydraulics 2: e-‐002
8
2008, Cochard et al. 2005, 2013), may not be recommended for conifer roots.
Interestingly, the torus aspiration artefact reported in both species is in line with our anatomical observations and previous studies. While we found no evidence of pores in tori of roots for both species, the presence of punctured tori in branch material of Pinaceae was previously reported (Jansen et al. 2012; Bouche et al. 2014). It can be suggested that the absence of pores associated with tori may explain why deflection of tori easily occurs in roots, although more species should be studied to test this hypothesis. While water may flow through pores in tori in branch xylem, the absence of punctured tori in roots might create a higher resistance, thus inducing torus displacement in the pit chamber, sealing the aperture and decreasing hydraulic conductivity. Then, the higher negative shift of P. pinaster curves might be due to a combination of both the absence of pores in tori and a higher margo flexibility of bordered pits in P. pinaster. This suggests that torus aspiration might not only be affected by the flexibility of the margo, but also by the torus anatomy. Recently, based on force displacement measurements of the torus-margo in conifer branches, Zelinka (2015) showed that the torus might not be as rigid as implicitly stated in previous modelling studies (Hacke et al. 2004; Domec et al. 2006). In addition, Jansen et al. (2012) showed that tori in Pinaceae branches were on average 0.5 µm thick, whereas the torus thickness reported in this study for P. pinaster and P. menziesii roots was 1.7 and 1.3 µm, respectively. Similar results were also reported by Hacke and Jansen (2009) between roots and branches of three conifer species. Therefore, a relationship between thickness and elastic properties of the torus can be suggested. Overall it seems that thick and unpunctured tori in roots might be more prone to aspiration than the thinner punctured tori in branches.
Our results showed that roots of P. pinaster were more vulnerable to embolism than roots of P. menziesii. According to Delzon et al. 2010, embolism spreading is thought to occur due to an inefficient valve effect of the torus as result of (1) low torus-aperture overlap and (2) low flexibility of the margo, together preventing the torus to completely seal the pit aperture (seal capillary seeding hypothesis, Delzon et al. 2010). In our study, P. pinaster roots had lower torus-aperture overlap than P. menziesii, but margo flexibility was higher. The higher vulnerability in the pine roots is in line with Bouche et al. (2014), who showed that variation in embolism resistance was mainly due to the first factor, with limited influence of the second. Overall, these findings seem to suggest that air-seeding in bordered pits of conifer roots may
happen via an air-water meniscus that is pulled through minute openings between the torus and pit aperture after pit aspiration.
Acknowledgements
We thank the Experimental Unit of Pierroton, UE 0570, INRA, 69 route d’Arcachon, 33612 CESTAS (France) for providing material and technical support. The Electron Microscopy Section at Ulm University is acknowledged for the preparation of TEM samples. This work was supported by the programme ‘Investments for the Future’ (ANR-10-EQPX-16, XYLOFOREST) from the French National Agency for Research, and mobility grants from the Franco-German University (UFA).
Supplementary information
Table S1. The maximum water pressure gradient (ΔPmax, MPa) produced by the high pressure, low
pressure and no pressure gradient method in relation to a particular xylem pressure (P, MPa).
Table S2. Mean value (±SE) of the xylem pressure at 12% loss of conductivity (P12) for vulnerability
curves measured with the high pressure, low pressure and no pressure gradient method. The xylem pressure P’12 corresponds to 12% water
extraction. n= the number of samples measured. Figure S1. Root system of P. menziesii exposed after blowing away the upper soil layer. This method was applied in order to collect high number of root samples with minimal physical damage to the roots.
Figure S2. Root vulnerability curves (raw data) carried out with the low pressure gradient method (a, b) and the no pressure gradient method (c, d) showing the percentage loss of hydraulic conductivity in xylem as a function of xylem pressure (MPa) in two Pinaceae species: Pinus pinaster (a, c) and Pseudotsuga menziesii (b, d). References
Alder NN, Pockman WT, Sperry JS, Nuismer S. 1997. Use of centrifugal force in the study of xylem cavitation. Journal of Experimental Botany 48: 665-674
Beikircher B, Ameglio T, Cochard H, Mayr S. 2010. Limitation of the cavitron technique by conifer pit aspiration. Journal of Experimental Botany 61: 3385-3393
Bouche PS, Larter M, Domec J-C, Burlett R, Gasson P, Jansen S, Delzon S. 2014. A broad survey of hydraulic and mechanical safety in the xylem of conifers. Journal of Experimental Botany 65: 4419-4431
Brodribb TJ, Bowman DJMS, Nichols S, Delzon S, Burlett R. 2010. Xylem function and growth rate interact to determine recovery rates after exposure to extreme water deficit. New Phytologist 188: 533-542
Journal of Plant Hydraulics 2: e-‐002
9
Brodribb TJ, Cochard H. 2009. Hydraulic failure defines the recovery and point of death in water-stressed conifers. Plant Physiology 149: 575-584
Cochard H, Badel E, Herbette S, Delzon S, Choat B, Jansen S. 2013. Methods for measuring plant vulnerability to cavitation: a critical review. Journal
of Experimental Botany 64: 4779-4791
Cochard H, Herbette S, Hernandez E, Hölttä T, Mencuccini M. 2010. The effect of sap ionic composition on xylem vulnerability to cavitation.
Journal of Experimental Botany 61: 275-285
Cochard H, Damour G, Bodet C, Tharwat I, Poirier M, Améglio T. 2005. Evaluation of a new centrifuge technique for rapid generation of xylem vulnerability curves. Physiologia Plantarum 124: 410-418
Cochard H. 2002. A technique for measuring xylem hydraulic conductance under high negative pressures.
Plant, Cell and Environment 25: 815-819
Cochard H, Coll L, Le Roux X, Ameglio T. 2002. Unraveling the effects of plant hydraulics on stomatal closure during water stress in walnut. Plant
Physiology 128: 282-290
Delzon S, Douthe C, Sala A, Cochard H. 2010. Mechanism of water-stress induced cavitation in conifers: bordered pit structure and function support the hypothesis of seal capillary-seeding. Plant, Cell
and Environment 33: 2101-2111
Domec J-C, Lachenbruch B, Meinzer FC. 2006. Bordered pit structure and function determine spatial patterns of air-seeding thresholds in xylem of Douglas-fir (Pseudotsuga menziesii; Pinaceae) trees.
American journal of botany 93: 1588-1600
Domec J-C, Warren JM, Meinzer FC, Brooks JR, Coulombe R. 2004. Native root xylem embolism and stomatal closure in stands of Douglas-fir and ponderosa pine: mitigation by hydraulic redistribution. Oecologia 141: 7-16
Fichot R, Chamaillard S, Depardieu C, Le Thiec D, Cochard H, Barigah TS, Brignolas F. 2010. Hydraulic efficiency and coordination with xylem resistance to cavitation, leaf function, and growth performance among eight unrelated Populus deltoids x Populus
nigra hybrids. Journal of Experimental Botany 33:
1553-1568
Hacke UG, Sperry JS, Ewers BE, Ellsworth DS, Schäfer KVR, Oren R .2000. Influence of soil porosity on water use in Pinus taeda. Oecologia 124: 495-505 Hacke UG, Jansen S. 2009. Embolism resistance of three
boreal conifer species varies with pit structure. New
Phytologist 182:675-686
Herbette S, Cochard. 2010. Calcium is a major determinant of xylem vulnerability to cavitation.
Plant Physiology 153: 1932-1939
Hukin D, Cochard H, Dreyer E, Le Thiec D, Bogeat-Triboulot MB. 2005. Cavitation vulnerability in roots and shoots: does Populus euphratica Oliv., a poplar from arid areas of Central Asia, differ from other poplar species? Journal of Experimental Botany 56: 2003-2010
Jansen S, Lamy J-B, Burlett R, Cochard H, Gasson P, Delzon S.2012. Plasmodesmatal pores in the torus of bordered pit membranes affect cavitation resistance of conifer xylem. Plant, Cell & Environment 35: 1109-1120
Jones HG, Sutherland RA. 1991. Stomatal control of xylem embolism. Plant, Cell & Environment 14: 607-612
Kramer PJ, Boyer JS. 1995. Water Relations of Plants and Soils. Academic Press, San Diego, CA, USA Li Y, Sperry JS, Taneda H, Bush SE, Hacke UG. 2008.
Evaluation of centrifugal methods for measuring xylem cavitation in conifers, diffuse- and ring-porous angiosperms. New Phytologist 177: 558-568
Linton MJ, Nobel PS. 1999. Loss of water transport capacity due to xylem cavitation in roots of two CAM succulents. American Journal of Botany 86: 1538-1543
Martínez-Vilalta J, Prat E, Oliveras I, Piñol J. 2002. Xylem hydraulic properties of roots and stems of nine Mediterranean woody species. Oecologia 133: 19-29 Pammenter N, Vander Willigen C. 1998. A mathematical
and statistical analysis of the curves illustrating vulnerability of xylem to cavitation. Tree Physiology 18: 589-593
Pappenheim K. 1889. Zur Frage der Verschlussfahigkeit der Hoftüpfel in Splintholze der Coniferen. Berichte
der Deutschen Botanischen Gesellschaft. 7: 2-19
Pittermann J, Choat B, Jansen S, Stuart S, Lynn L, Dawson TE. 2010. The relationships between xylem safety and hydraulic efficiency in the Cupressaceae: the evolution of pit membrane form and function.
Plant Physiology 153: 1919-1931
Pockman WT, Sperry JS, O’Leary JW. 1995. Sustained and significant negative water pressure in xylem.
Nature 378: 715-716
Schulte PJ. 2012. Vertical and radial profiles in tracheid characteristics along the trunk of Douglas-fir trees with implications for water transport. Trees 26:421-433
Schuldt B, Leuschner C, Brock N, Horna V. 2013. Changes in wood density, wood anatomy and hydraulic properties of the xylem along the root-to-shoot flow path in tropical rainforest trees. Tree
Physiology 33: 161-174
Sperry JS, Tyree MT. 1990. Water-stress-induced xylem embolism in three species of conifers. Plant, Cell and
environment 13: 427-436
Sperry J, Ikeda T. 1997. Xylem cavitation in roots and stems of Douglas-fir and white fir. Tree Physiology 17: 275-280
Tyree M, Ewers F. 1991. The hydraulic architecture of trees and other woody plants. New Phytologist 119: 345-360
Tyree MT, Yang S. 1990. Water storage capacity of
Thuja, Tsuga and Acer stems measured by
dehydration isotherms. The contribution of capillary water and cavitation. Planta 182: 420-426
Urli M, Porté AJ, Cochard H, Guengant Y, Burlett R, Delzon S. 2013. Xylem embolism threshold for catastrophic hydraulic failure in angiosperm trees.
Tree Physiology 33: 672-683
Zelinka. 2015. Force displacement measurements of earlywood bordered pits using a mesomechanical tester. Plant, Cell & Environment doi: 10.1111/pce.12532.
Zimmermann M. 1983. Xylem structure and the ascent of