HAL Id: hal-03007999
https://hal.archives-ouvertes.fr/hal-03007999
Submitted on 7 Dec 2020HAL is a multi-disciplinary open access
archive for the deposit and dissemination of sci-entific research documents, whether they are pub-lished or not. The documents may come from teaching and research institutions in France or abroad, or from public or private research centers.
L’archive ouverte pluridisciplinaire HAL, est destinée au dépôt et à la diffusion de documents scientifiques de niveau recherche, publiés ou non, émanant des établissements d’enseignement et de recherche français ou étrangers, des laboratoires publics ou privés.
Water binding to FeIII hemes studied in a cooled ion
trap: characterization of a strong ‘weak’ ligand
Mohammad Aarabi, Satchin Soorkia, Gilles Gregoire, Michel Broquier,
Aurélien de la Lande, Benoît Soep, Reza Omidyan, Niloufar Shafizadeh
To cite this version:
Mohammad Aarabi, Satchin Soorkia, Gilles Gregoire, Michel Broquier, Aurélien de la Lande, et al.. Water binding to FeIII hemes studied in a cooled ion trap: characterization of a strong ‘weak’ ligand. Physical Chemistry Chemical Physics, Royal Society of Chemistry, 2019, 21 (38), pp.21329 - 21340. �10.1039/c9cp03608c�. �hal-03007999�
1
Water binding to Fe
IIIHemes studied in a cooled ion trap; characterization
of a strong ‘weak’ ligand
Mohammad Aarabia, Satchin Soorkiab, Gilles Grégoireb, Michel Broquier b,c, Aurélien de la Landed, Benoît Soep e, Reza Omidyana and Niloufar Shafizadeh b,*
a
Department of Chemistry, University of Isfahan, 81746-73441 Isfahan, Iran
b
ISMO, Université Paris-Sud, CNRS UMR 8214, bat 520, Université Paris-Sud 91405, Orsay Cedex, France
c
Centre Laser de l’Université Paris-Sud (CLUPS/LUMAT), Univ. Paris-Sud, CNRS, IOGS, Université Paris-Saclay, F-91405 Orsay (France)
d
Laboratoire de Chimie-Physique, Université Paris Sud, CNRS, UMR 8000. 15, rue Jean Perrin, 91405 Orsay Cedex, France.
e LIDYL, CEA, CNRS, Université Paris-Saclay, UMR 9222 CEA Saclay, F-91191 Gif-sur-Yvette,
Abstract
The interaction of a water molecule with ferric heme - iron protoporphyrin ([PP FeIII]+) has been investigated in the gas phase, in an ion trap and studied theoretically by Density Functional Theory. It is found that the interaction of water with ferric heme leads to a stable [PP-FeIII−H2O]+ complex
in the intermediate spin state (S=3/2), in the same state as its unligated [PP-FeIII]+ homologue, without spin crossing during water attachment. Using the Van’t Hoff equation, the reaction enthalpy for the formation of a Fe-OH2 bond has been determined for [PP-FeIII−H2O]+ and
[PP-FeIII−(H2O)2]+. The corrected binding energy for a single Fe-H2O bond is -12.2±0.6 kcal.mol−1,
while DFT calculations at the OPBE level yield -11.7 kcal.mol−1. The binding energy of the second ligation yielding a six coordinated FeIII atom is decreased with a bond energy of -9±0.9 kcal.mol-1, well reproduced by calculations as -7.1 kcal.mol-1. However, calculations reveal features of a weaker bond type, such as a rather long Fe-O bond with 2.28 Å for the [PP-FeIII−H2O]+ complex
and the absence of spin change by complexation. Thus despite a strong bond with H2O, the FeIII
atom does not show through theoretical modelling, a strong acceptor character in its half filled 3dz2
orbital. It is observed also that the binding properties of H2O to hemes seem strikingly specific to
ferric heme and we have shown experimentally and theoretically, that the affinity of H2O for
protonated heme [H PP-Fe]+, an intermediate between FeIII and FeII, is strongly reduced compared to that of ferric heme.
2
1-Introduction
Hemoproteins, which operate many functions in living organisms, such as molecule transport or oxydo-reduction reactions, function in aqueous media. Thus, the binding of water to their heme centers is an important factor influencing ligand fixation or their operation. More specifically, ferric hemoproteins ligate water that penetrates the globin protein pocket. In met-myoglobin (FeIII
myoglobin), a series of structural X-ray diffraction studies on various mutants, showed the tight bonding of a water molecule to the Fe atom1. Water forms a bond with the Fe atom by interaction of the (b2) lone pair of the oxygen atom with the Fe(3dz2) orbital. Within hemoproteins, this
bonding combines also with a strong interaction of a water H atom with the distal histidine by hydrogen bonding1.
Therefore, strong ligands to ferric hemeproteins need to displace the water ligand to attach the Fe atom on heme. As an example, the attachment of NO that inactivates the catalase enzyme requires removing the Fe−OH2 bond in aqueous media and the binding equilibria of NO to these proteins
cannot be established in a straightforward manner. Indeed, flash photolysis2 studies of NO binding kinetics to myoglobin have shown that NO binding is stronger than that of water to met-myoglobin. There, water dissociation has been characterized with an activation barrier of 10±0.7 kcal.mol-1. In order to explore the nature of water to ferric heme coordination in hemoproteins, it is essential to determine directly the interaction of ferric heme with water, in the absence of other ligands or solvating medium. This can achieved uniquely by thermodynamic measurements in the gas phase. Since the experiments of Dunbar et al.3, we4 and others5-7 have demonstrated that binding energy measurements in ion traps tackle the single bond interaction of a ligand with a metalloporphyrin. Indeed, we can address unambiguously the thermodynamic equilibrium with the H2O ligand of a selected species, here [PP-FeIII]+, [PP-FeIII−(H2O)]+,
[MI-PP-FeIII]+ or [H PP-Fe]+, (where [PP-FeIII]+ stands for ferric heme - iron protoporphyrin, [H PP-Fe]+ for protonated heme shown in Figure 6, and MI=methyl imidazole). Condensed phase measurements with iron porphyrins are difficult to achieve since, in solution with increasing concentrations, they tend to form µ-hydroxo dimers8, such as [(TPP)Fe−OH−Fe(TPP)]+.
The structures of aquamet-Myoglobin 9 and of the [FeIIITPP-H2O][CB11H6X6] 8 axial complex have
3
corresponds to a nearly pure S=3/2 intermediate spin state from the NMR shift of pyrrole protons. Using the magnetochemical ranking8 that analyses the S=5/2, 3/2 mixing through pyrrole proton
NMR displacement, H2O is a weak axial ligand and the intermediate spin is confirmed by
calculations for the ferric porphyrin10. The calculation of the binding energy of water is more
difficult and leads to different values for the unsubstituted FeIII porphin: -14.45kcal.mol-1
(OPBE/LaNl2dz) and -23.15 kcal.mol-1 (B3LYP/LaNl2dz) for Renger et al.10 or -13.9 kcal.mol-1
(OPBE) and -6.9 kcal.mol-1 (B3LYP/6-311+G(d,p)) for Durrant11. The same calculations applied to the full ferric heme 11 yield -11.6 (OPBE) and -3.6 (B3LYP) kcal.mol-1. These discrepancies
show the importance of the comparison with direct experimental measurements, which can be achieved in a low pressure temperature controlled ion trap using the van’t Hoff equation. Experimentally, the van’t Hoff equation relates directly the temperature variations of the equilibrium constant between complexed and free heme with the enthalpy of complexation. This enthalpy can be extrapolated to 0 K providing the binding energy of the ion complex under study.
We present here a precise measurement of the [PP-FeIII−H2O]+ and [PP-FeIII−(H2O)2]+ bond
energies and compare the values with detailed DFT calculations investigating the structures, the energies and the electronic distribution within the Fe-O bond. Action spectra of the [PP-FeIII−H2O]+ complex reveal a structure in good agreement with calculations with an intermediate
spin complex S=3/2. Furthermore, we find that the strong binding energy of a water molecule is specific to the fifth coordination of ferric heme, by comparing the affinity of protonated heme [H PP-Fe]+ (of mixed ferrous/ferric character) and that of ferric heme with H
2O.
2-Experimental Setup
The experimental setup has been described in details previously4, 12. The setup is composed of three parts: an electrospray ionization source (ESI), a quadrupole ion trap (QIT, Jordan ToF Inc.) and a linear time-of-flight mass spectrometer (TOF). Hemin (Sigma-Aldrich) is dissolved in methanol, at a concentration of ~100 µM. Protonated Heme [H PP-FeII]+ is obtained from in-source collision induced dissociation of the microenzyme Microperoxydase 11 in the chamber following electrospray13. This process leads to a partial transformation into protonated heme and ferric heme,
4
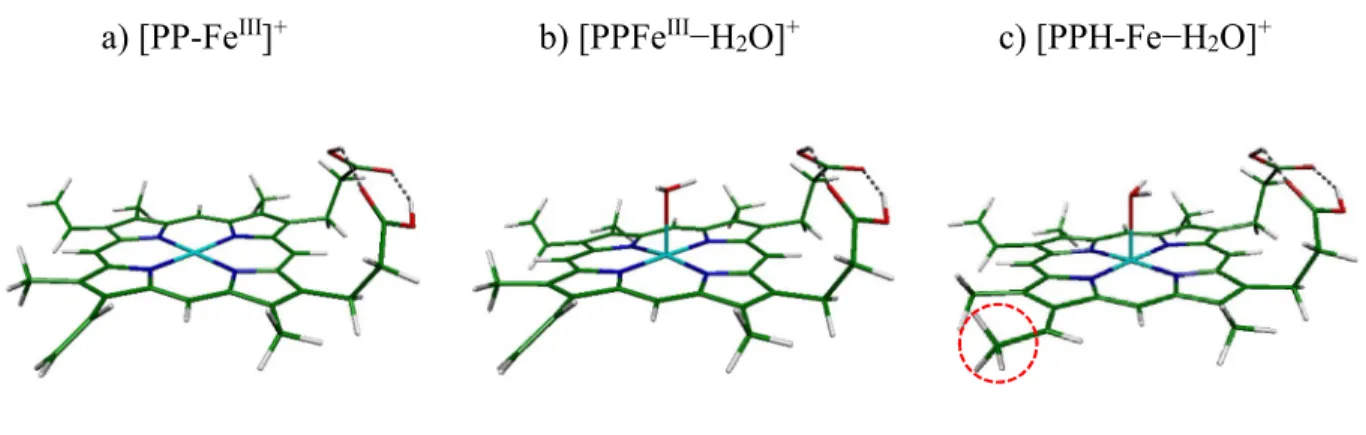
in ratios that can be detected by mass spectrometry and adjusted by the collision energy in the high pressure region of the ESI source. Protonated heme has been characterized with the fixation of a proton on the vinyl C=C bond in C7 of Fe prototporhyrin IX14 , represented in Figure 6c.
At the exit of the skimmer, ions are stored in an octopole trap for ~100 ms. They are extracted by applying a negative voltage pulse and are further accelerated by a second pulsed voltage, applied just after the exit electrode. This time sequence produces ion packets. The ions are driven by a couple of electrostatic lenses toward the QIT, biased at ~200 V, which matches the energy of the incoming ions. A mass gate placed before the entrance of the QIT allows the selection of the parent ion. The QIT is cooled by a compressed helium cryostat at ~10 K (CH-204S, Sumitomo). The temperature of the trap can be precisely monitored over the 10-310 K temperature range by a cartridge heater and a couple of temperature sensors interfaced to a temperature controller (Lake Shore model 335).
The ions are trapped and thermalized through collisions with the helium buffer gas, which is injected by a pulsed valve 1-2 ms before the ions enter the trap. The photodissociation laser for excitation spectra, is triggered after a variable storage delay, in the 40-80 ms time range. Ions are then synchronously extracted to a linear TOF mass spectrometer and detected on a microchannel plate detector (Z-Gap MCP, Jordan ToF Inc.).The one-color spectrum of the [PP-FeIII−ligand]+
ions is obtained by scanning the laser frequency and recording the signal of the fragment [PP-FeIII]+ ion.
The helium water mixtures: water vapor is premixed with helium prior to its introduction. Helium
is flowed at 2 bar over a water vessel at 20°C providing a ~20 mbar maximum partial pressure. This ensures a maximum 1% concentration of water in the mixture, which accords with the necessary concentrations to achieve - more than one average collision of water with heme in the collision chamber per 80 ms, the duration of the preparation of the equilibrium with its water complex. The water-helium mixture is directed by a small tubing from the general valve into the cold ion trap where thermalization of the gas mixture takes place through collisions with its walls. There, the local transient pressure never exceeds 10-2 mbar, therefore the local water vapor pressure
amounts to 10-4 mbar at maximum, which corresponds to a solid-vapor equilibrium temperature of
5
temperature, the H2O pressure will no longer be controlled by the pumping speed but will be
partially decreased by condensation of H2O molecules on its walls, as temperature is decreased.
We use pressures at the highest values (total corrected time averaged value of~2.10-5 mbar) to reach the largest number of collisions and maintain the temperature dependent equilibria at the highest values. Typically equal concentrations between [PP-FeIII−H2O]+ and[PP-FeIII]+ is reached in the
270-240 K domain at a value labeled as T1. We shall be plotting
Ln I[ ] I
[ ] =Ln(Kp(T)*p), therefore this plot rises linearly with the
Logarithm (base e) of the water vapor pressure, (Ln(p)). I[x] represents the surface of the relevant
mass peaks of species X, since there is a mass distribution over 5 isotopologues for heme compounds of 0.6 amu width.
We have operated in 3 different regimes, depending upon the desired equilibrium: i) [PP-FeIII−H
2O]+ /[PP-FeIII]+, 10-5 mbar helium average pressure to achieve the formation of the complex
but minimize [PP-FeIII−(H
2O)2]+. The latter is obtained with ii) 2.10-5 mbar for [PP-FeIII−(H2O)2]+
/ [PP-FeIII−H
2O]+ since this requires the prior formation of the [PP-FeIII−(H2O)]+ complex. iii) For
the equilibrium between protonated heme [H PP-Fe]+ and H
2O, i.e. [H PP-Fe−H2O]+ /[H PP-Fe]+,
different conditions are needed since a ~1/1 mixture of [PP-FeIII]+ and [H PP-Fe]+is formed, differing by 1 amu. Then mass resolution is essential to discriminate [PP-FeIII]+ from [H PP-Fe]+ and this has required lower average pressures (~0.5 10-5 mbar). Low temperatures typically (170-150 K) are thus required to compensate the pressure decrease and the lower affinity of [H PP-Fe]+ for H2O as observed below.
Action spectra were recorded with a tunable OPO laser (mode-locked picosecond Nd:YAG laser EKSPLA-SL300 LT-02300 pumping an optical parametric amplifier (EKSPLA-PG411) to obtain tunable visible light. The tunable laser (500µJ/pulse over 5 mm2 and 8 cm-1resolution) was scanned through the absorption bands of the heme complex while recording the intensity of the free heme ions. As the depletion of complexed ions is important a normalization by the total number of ions (complexed + uncomplexed) is accomplished. The spectra are recorded in complete complexation conditions.
6
3-Computational details:
In this work, the geometry optimizations for the heme-FeIII systems were performed using the deMon2k16 suite of programs in the framework of Auxiliary DFT (A−DFT).
We used the OPTX exchange functional proposed by Cohen and Handy, coupled to the Perdew– Becke–Ernzerhof (PBE) correlation functional (OPBE). A double- valence polarization basis set calibrated for Generalized Gradient Approximation (GGA) functionals has been used (DZVP-GGA) on all atoms. All calculations have been performed within the unrestricted Kohn–Sham (UKS) formalism. Auxiliary electron densities were expanded with the automatically generated GEN-A2 auxiliary basis set on C, H and the larger GEN-A2* basis set (including functions with f and g angular momentum) on the Fe, O and N atoms involved in interaction. Therefore, the choice of the more flexible GEN-A2* auxiliary basis set for Fe, O and N atoms permits an accurate description of metal–ligand bonding. Dispersion effect corrections 17 were also considered by an empirical expression during geometry optimizations. To integrate the XC energy and potential, an adaptive grid of fine accuracy has been used (10-6 Ha). SCF iterations and geometry optimizations were also performed with convergence criteria of 10-7 Ha and 10-5 Ha.Bohr−1 respectively (Ha
stands for Hartree).
We performed single point calculations on the OPBE/DZVP-GGA optimized structures using large cc-pVTZ (for C and H) and aug-cc-pVTZ basis sets (for Fe, N and O atoms) to determine the binding energy of water to heme systems. Binding energies were also corrected for the zero-point vibrational energy (ZPE), as well as for the long-range dispersion by considering a semi-empirical approach developed by Grimme (GD3) with Becke−Johnson damping factors (GD3BJ)17 to OPBE
functional. The frequency analysis confirms that the considered structures are minima, owing to all the real vibrational frequency modes. It should be noted that for most of the studied complexes of this work, the calculated S2 values were in excellent agreement with the theoretically expected
values for the high-spin and intermediate-spin states except for some low-spin complexes for which an approximate spin projection correction technique was applied 18 as described in ESI.
On the basis of the OPBE/DZVP-GGA optimized geometries, we have also determined a full analysis of topological parameters based on the Quantum Theory of Atoms in Molecules19
7
(QTAIM) as well as the Electron Localization Function20 (ELF) to study the nature of [PP-FeIII−H2O]+ bonding. The optimized geometries were employed to obtain suitable wave function
files using the deMon2k software based on which the AIM and ELF calculations were performed using AIMAll21 and TopMoD programs22 respectively. The spin density values were also determined from the population analysis of the DFT electronic densities based on the iterative Hirshfeld scheme23 (HI) as implemented in deMon2k. Moreover, the Turbomole (version 6.3)
program suite24 has been employed for the determination of electronic transition energies and
oscillator strengths of the considered systems at the TD-DFT/B3LYP level using cc-pVDZ and TZVP basis sets for (C, H, N, O) and Fe respectively.
In order to determine the nature of the interaction between the iron atom and the oxygen atom of water in the ligation of ferric heme, we have used the Bader Quantum Theory of Atoms in Molecules (QTAIM) approach based on the analysis of the electron density ( ) along the bond under scrutiny. This allows with the determination of the Laplacian of the density 2
BCP, the
electronic kinetic energy density (GBCP), and the energy density HBCP, a characterization of the
nature of the bond at the critical point (BCP) as follows.
The line of the greatest electron density connecting the two atoms is named Atomic Interaction Line (AIL ) and the point which corresponds to the extremum of the electron density within this line (AIL) is the Bond Critical Point (BCP). The sign of the Laplacian of the electron density at BCP, ∇ ( ) determines an accumulation (maximum) of charge density or a depletion (minimum) in the region of atom-atom interaction. For a covalent interaction there is a concentration of the electron charge at the BCP and hence the Laplacian of the electron density is negative ∇ ( ) < 0 . On the other hand, with ∇ ( ) > 0 a depletion of electron charge indicates an ionic or a non covalent interaction. In this way, some non covalent bonds have been well typified. 19, 25, 26
8
4-Results
4-1- Experimental results
4-1-1- Penta- and hexa-coordination of water to ferric Heme
Water vapor easily attaches ferric heme with a total pressure of 1.10-5 mbar, with a ratio of complexed to free ferric heme of 12 at 232 K and the single ligation of water to ferric heme is represented in Figure 1a. Between 300 and 220K and 10-5 mbar total pressure, no bi-ligated complex with water was detected, showing a lower affinity for the second complexation. Otherwise, once the first complexation is completed, a collision of [PP-FeIII-H2O]+ with water
would lead to the formation of [PP-FeIII-(H2O)2]+.
The van’t Hoff equation, ( ( )) =∆ determines the slope −∆ /R of the variation of ( ) the association constant, as a function of the inverse temperature 1/T. Thus, the ratio of the ion intensities, Ln I[ ] I
[ ] is traced here as a function of the
inverse temperature 1/T. It is found linear over the whole temperature range. The absolute value of the binding enthalpy |rH| can be obtained from the slope of the plot in Figure 1a, as
4500±220 cm-1. This value can be extrapolated at 0 K 4 to 4250±210 cm-1 (12.2±0.6 kcal.mol-1 ) to derive the absolute value of the binding energy (hereafter labeled as binding), by taking into account the kinetic energy of H2O at 260 K (3/2 kT, k=Boltzmann constant), the average
temperature in the explored range.
It is possible to derive a correlation between two similar equilibria by comparing the equal intensities of the heme complex and that of the free heme. Equal ion intensities of heme and its complex are obtained at T1, the crossing with the abscissae of the van’t Hoff plot, as in Figure 1b,
at 255 K. At T1, Ln
I[ ]
I[ ] =0. Considering now two equilibria 1,2 with two similar entropy changes by ligation S, one obtains at the crossing temperatures T1,2:
−∆ { , }
, + Ln(p) + C , = 0 [1]. Then, assuming C1≈C2 ( similar S for the two
9
equations for T1 and T2 . This relation allows a correlation of the rH1,2 of the two equilibria
through T1,2. 610 620 630 640 T=313 K T=292 K T=280K T=272K T=264 K T=252 K T=244 K T=232 K Mass (amu) [PP FeIII]+ [ PP FeIII - H2O]+ a) 0.0032 0.0034 0.0036 0.0038 0.0040 0.0042 0.0044 -3 -2 -1 0 1 2 3310 300 290 280 270 260 250 240 230 Ln ( I[PP-Fe III -H2O ] + /I [PP-Fe III ] +) 1/T (Kelvin-1) b) T (K)
Figure 1: a)Mass spectra showing the evolution between [PP-FeIII−H
2O]+ and [PP-FeIII]+ as a function
of temperature between 290 and 230K ; b)Van’t Hoff plot of the [PP-FeIII−H
2O]+ / [PP-FeIII]+ equilibrium
in the ion trap. Fitting slope*R= 4500 cm-1.
Bi-ligated water complexes
The formation of doubly ligated [PP-FeIII−(H2O)2]+ can be observed in Figure 2a, through its
equilibrium with [PP-FeIII−H2O]+. More severe conditions are employed, a higher H2O number
density, obtained with 2.10-5 mbar total pressure and at equilibrium temperatures below 220 K. Then, the van’t Hoff slope (Figure 2 b) is 3350±300 cm-1, yielding a binding of 3140±310 cm-1
(9±0.9 kcal.mol-1) after kinetic energy correction. This value of the energy of this sixth
10 620 630 640 650 660 T=220 K T=210 K T=200 K T=190 K T=180 K T=170 K T=160 K [PP-FeIII -(H2O)2]+ [PP-FeIII -H2O]+ Mass( amu) [PP-FeIII]+ a) 0.0044 0.0048 0.0052 0.0056 0.0060 0.0064 -6 -4 -2 0 2 4 220 210 200 190 180 170 160 Ln ( I[PP-Fe III -( H 2O ) 2 ] + /I [ PP-Fe III -( H 2O )] +) 1/T (Kelvin-1) b)
Figure 2: a)Mass spectra showing the evolution between [PP-FeIII−(H2O)2]+ and [PP-FeIII− H2O]+ as a
function of temperature between 220 and 150 K at 2.10-5 mbar total pressure; b) Van’t Hoff plot of the equilibrium of doubly ligated, versus simply ligated species [PP-FeIII−(H2O)2]+ / [PP-FeIII−H2O]+, fitting
slope*R= 3350 cm-1.
Water ligation to [MI-PP-FeIII]+
When penta-coordinated protoporphyrin with methylimidazole, [MI-PP-FeIII]+ is cooled with an helium water mixture, the sixth coordinated complex [MI-PP-FeIII−H2O]+ is formed in extreme
conditions at 155 K, where the equilibrium water pressure has decreased below 10-6 mbar, as shown
in figure S0 in ESI. Thus tracing a Van’t Hoff plot is not realistic. However, in the same pressure conditions, this sixth coordination of H2O to [MI-PP-FeIII]+ can be correlated with the equilibrium
of [H2O-PP-FeIII−H2O]+ / [H2O-PP-FeIII]+ + H2O at T1=195 K in Figure 2b, with
|rH|=(9±0.9 kcal.mol-1). If [ ] would equal [ ] at the temperature of
155 K in the same experimental conditions, using relation [2] would yield a binding of ~9*155/195=7.1 kcal.mole-1. Indeed, as represented in Fig S0 of ESI, the ratio of [MI-PP-Fe III-H2O]+, to [MI-PP-FeIII]+ is ≈1/20 at 155 K. Taking into account the vapor pressure reduction at 155
K with respect to the 180 K limit can increase this ratio to 1/1.Thus, the Fe-H2O binding of
11
Methylimidazole in 5th coordination of ferric heme has diminished strongly the FeIII–water binding, as it is the case for ligands such as O2 and CO)27.
4-1-2 Specificity of the ligation of water to ferric heme
It can be shown that ligation of water is specific to ferric heme by comparing its ligation to water with that of protonated heme. Protonated heme is intermediate between ferric and ferrous heme, thus bears some of its properties14, 28 since protonation occurs at the periphery of the heme cycle and leaves a FeII / FeIII intermediate core. Indeed, when using a mixture of ferric heme and protonated heme as in reference13, we obtain a strikingly different affinity of H2O for ferric and
protonated hemes. In presence of a mixture of ferric heme and protonated heme, one obtains in pure helium containing water at 155 K, the mass spectrum shown in Figure 3. This has the advantage of comparing the affinity of ferric heme and protonated heme with H2O in the same
experimental conditions. 610 615 620 625 630 635 640 0 50 Intensity (A.U.) [H PP Fe-H 2 O] + Mass (amu) [H PP Fe] + [P P Fe III ] + [PP Fe III -H 2 O] +
Figure 3: Black, mass spectrum obtained at 155 K for a mixture of ferric heme and protonated heme around m=616 amu and their 1:1 water complexes at ~634 amu. Using the isotope distribution of [PP-FeIII]+ and
of [HPP-Fe]+, the mass spectrum is deconvoluted into the contributions of ferric and protonated
12
The mass spectrum in Figure 3 shows a separation of 17 amu between the main peaks, free and complexed, showing that they belong to protonated and non protonated species. The spectrum is fitted with a superposition of the isotopic distributions of free and complexed ferric heme [PP-FeIII]+ (blue) or those of protonated heme [H PP-Fe]+ (green) with a convolution width of 1 amu
(full width half maximum, Gaussian), using a least square fitting routine. The fit is good, however for masses 620-625 amu, an impurity is contributing to the mass distribution of the free systems. Two other equivalent fits have been traced for T=189 and 160 K in figure S1 of ESI.
While the ratio of water complexed to free ferric heme is 1 in Figure 3 (T=155K), that of water complexed to free protonated heme is less than 0.75/57, as one sees in Figure 3 only a negligible contribution of protonated heme to the ligated species in green. This shows in the same temperature and pressure conditions a lower affinity of protonated heme for water present in the same concentration. The temperature can be varied for this mixture and a plot similar to a van’t Hoff one can be traced in Figure 4 for both ferric heme and protonated heme. It shows in two plots, in blue
for [ − − ] [ − ] and in green for [ − − ] [ − ] .
In Figure 4, the variation of [ ]
[ ] with 1/T has a smaller slope
compared to the equivalent for ferric heme. This is due to the decrease of the water vapor pressure with temperature below 175K. Nevertheless the slopes of the non protonated equilibrium (blue) and that of the protonated (green) differ by a ratio of 4. Since the fitted concentration of the protonated water complex varies in a constant manner, it ensures that the presence of a protonated complex is necessary to the fit. This allows placing an upper limit to the binding of [H PP-Fe-H2O]+ as ≈12.2/4=3.1 kcal.mol-1, a fourfold decrease in binding, however biased by the
13 0.0052 0.0054 0.0056 0.0058 0.0060 0.0062 0.0064 -4.0 -3.5 -3.0 -2.5 -2.0 -1.5 -1.0 -0.5 0.0 0.5 1.0 1.5 2.0 190 185 180 175 170 165 160 Ln (Icomple x /Ifree ) 1/T (Kelvin-1) T (Kelvin)
Figure 4: Simultaneous plots of [PP-FeIII−H
2O]+/ [PP-FeIII]+ (blue)and [H PP-Fe−H2O]+/ [H PP-Fe]+(green).
4-1-3 Excitation spectrum of the water ferric Heme complex
The excitation spectrum of the [PP-FeIII−H2O]+ can be obtained after tunable laser excitation by
monitoring the loss of H2O. Through the 420-800 nm wavelength domain, a broad band is found
as for other ferric porphyrins at ~520 nm, corresponding to the vibronic Qv bands and a weaker broad band appears around 617 nm (see Figure 5a). This latter band, although weak, is located in the same region as the charge transfer band found in the action spectrum of [PP-FeIII−N
2]+
represented in Figure 5 at 610 nm (Figure 5b). No intense extension of the [PP-FeIII−H 2O]+
spectrum was detected beyond 650 nm. This water complex spectrum is compared in Figure 5b with that of ferric heme complexed with dinitrogen, a very weak ligand acting as a molecular tag29
and yielding a similar spectrum to that of free ferric heme. It appears that both spectra have a similar shape in this wavelength domain, but the lower spectrum is narrower; this could be related with the much lower temperature at which it was recorded , 22 K4.
14 450 500 550 600 650 700 750 800 [PP FeIII N 2] + 617 nm [PP FeIII H2O]+ Intensit y (arbitrary unit) 450 500 550 600 650 700 750 800 [PP FeIII]+ nm 610 nm a) b)
Figure 5a): Action spectrum of the [PP-FeIII−H2O]+ complex observed by [PP-FeIII]+ detection obtained at
TTrap = 155K (black). Calculated absorption spectrum, blue (see text). b) Action spectrum of the weakly
bound [PP-FeIII−N2]+ complex at TTrap=22K (black) and the calculated spectrum of [PP-FeIII]+(blue). The
comparison is made assuming a negligible perturbation by N2 of [PP-FeIII]+.
4-2-Theoretical Results:
4-2-1: Optimized geometries and Binding Energies:
In addition to global heme structures, several conformers may arise from the different orientations of carboxyl groups and other side-chains with respect to the core porphyrin ring. Thus, we have investigated different orientations of side-chain branches and carbocyclic moieties. In agreement with previous studies of Dillinger et al.7, it has been predicted that the cis conformer presented in
Figure 6 is the most stable structure, stabilized by two strong hydrogen bonds between the carboxyl groups.
15
Figure 6: Optimized structures for the most stable spin state of ferric heme complexes. a) Free ferric heme, b H2O ligated to ferric heme and c) ligated to protonated ferric heme. The red circle shows the most
probable location of the excess proton in c). All structures have been determined at the OPBE level of theory. All three complexes are in their intermediate spin state either 3/2 for ferric heme or 1 for protonated heme.
In addition to the geometry of the free [PP-FeIII]+ systems, we have investigated the H2O heme
complexes [PP-FeIII H2O]+ in their optimized geometries, considering the three possible spin states;
S=1/2 (doublet), S=3/2 (quartet) and S=5/2 (sextet). The relative spin state energies at the OPBE level are summarized in Table S1, ESI file. The quartet spin state of [PP-FeIII−H2O]+ was found to
be the lowest energy state, the same as that of free [PP-FeIII]+ (Figure 6, b). The resulting stabilization energy after water binding energy was calculated to be −11.7 kcal.mol-1 at the OPBE
level Table 1. The doublet and sextet states are also higher in energy by 25.44 and 7.55 kcal.mol-1 respectively, compared with the most stable 3/2 spin state.
To account for the effect of the 6th coordinated ligation on the binding energy, the geometry of the doubly complexed [PP-FeIII−(H2O)2]+ and [MI-PP-FeIII−H2O]+ were also optimized in the 3/2 and
5/2 spin states respectively, by adding a second water molecule or MI to the 6th coordination site. The binding energies and the most important structural parameters are presented in Table 1 and Table 2, respectively. It is found that the strongest Fe-O bond is related to the ferric [PP-FeIII−H2O]+
singly coordinated water complex, while the second Fe−O bond is calculated as equivalent for [PP-FeIII−(H2O)2]+, -7.14 kcal.mol-1, and [MI PP-FeIII−H2O]+,-7.44 kcal.mol-1.
a) [PP-FeIII]+ b) [PPFeIII−H
16
Complex Spin
state
Theory Experiment
ε ZPE BSSE dispersion Eca E
[PP-FeIII−H2O]+ 3/2 −5.73 2.63 0.63 −9.21 −11.68 -12.2±0.6
[H PP-Fe−H2O]+ 1 −3.39 2.33 0.61 −9.17 −9.62 Weakly
formed >-3.1
[PP-FeII−H2O] 1 0.65 1.96 0.60 −9.27 −6.06 -
[PP-FeIII−(H2O)2]+ c 3/2 −1.22 2.16 0.59 −8.67 −7.14 -9±0.9
[H PP-Fe−(H2O)2]+ c 1 −0.25 1.98 0.58 −8.32 −6.01 Not observed b
[PP-FeII −(H2O)2] c 1 1.48 1.67 0.53 −8.36 −4.68 -
[MI- PP -FeIII−H2O]+ c 5/2 1.99 2.23 0.61 −12.27 −7.44 >-7 b
Table 1: Calculated and experimental electronic binding energies (ε, E) (in kcal.mol−1) for the reaction
of X + H2O [X-H2O] (X=[PP-FeIII]+,[H2O PP-FeIII]+ , [MI PP-FeIII]+ [H PP-FeIII]+), in various
ligation condition 5th ligation and 6th ligation (see text). The theoretical value has been calculated using
single point OPTX-PBE/cc-pVTZ (aug-cc-pVTZ for Fe, O and N) calculations on previously optimized structures at the OPTX-PBE/DZVP-GGA level.
a) Ec stands for the corrected binding energy with ZPE, dispersion and BSSE (see text).
b) These complexes are weakly observed in the ion trap, in our experimental conditions. The binding energy (E) of these complexes >-7 kcal.mol-1, see text.
c) six coordinated heme with two ligands H2O or MI on each porphyrin face.
Moreover, we have determined the optimized structure of protonated ferric heme [H PP-Fe]+, and
ferrous heme [PP-FeII]. In the case of [H PP-Fe]+, only the most stable protonated isomer previously assigned by Chiavarino et al.14 has been considered (i.e. where the extra proton locates
at the carbon of one vinyl group at C7, see Figure 6.c). It is also shown that for protonated ferric heme [H PP-Fe]+ and ferrous heme, the triplet state is the lowest energy isomer. We have optimized the triplet state of [H PP-Fe]+ (Figure 6-c) and [PP-FeII] at the same theoretical level as for its [PP-FeIII]+ homologue and determined the binding energy with water. As shown in Table 1, protonation of heme decreases the binding affinity of the first water molecule by 2 kcal.mol−1 while the ferrous
heme water complex is 5.6 kcal.mol−1 less stable than the ferric heme complex. Smaller
reductions by protonation or reduction to ferrous heme are calculated for doubly water-coordinated complexes.
17
We have also collected selected parameters of the optimized geometries of different systems (ligated and unligated ferric heme and protonated homologues) in Table 2. More details on the optimized structures and xyz coordinates can be found in ESI file (see Figure 6 and Table S2, S6 in ESI file). From the results, it is seen that the porphyrin ring in [PP-FeIII]+ preserves its planarity
following optimization, while the ring is slightly distorted or saddled in protonated and singly H2O
ligated systems. Also, in [MI-PP-FeIII]+, it appears that the central iron moves out of porphyrin ring
(being attracted by MI, resulting in reverse doming). Doming is predicted to be more prominent in [MI-PP-FeIII]+ (by 0.411 Å) but decreases by 6th coordination to H2O. Also, in Table 2, the larger
values predicted for doming are accompanied by longer Fe-Np bond-lengths. The related Fe−O bond lengths decreases from low- to high-spin state, in the quartet state, the H2O distance to the Fe
is 2.28 Å while the Fe-O distances is 2.43 Å for the sextet state. The structure of the [PP FeIII −H
2O]+ complex is of helicopter type, with the OH bonds not far from
parallel to the heme plane, with a FeOH angle of 109° as shown in Table 2 and Figure 6. The O atom in H2O is distant by 2.281 Å from the Fe atom. This value is larger than the results of the
X−Ray data, 2.039 Å, for [FeIII TPP−H
2O]+ (ferric tetraphenyl porphyrin water complex). The
experimental structure of [FeIII TPP−H
2O]+ exhibits the same cage parameter, the Fe atom–
N(pyrrole) atom distance, 1.979 Å as the calculated system [PP-FeIII−H
2O]+, 1.974 Å, confirming
the present theoretical structure. To account for the difference in the calculated Fe-O distance and the model crystallographic system, in Ref. 8 [PP FeIII−(H
2O)2]+ with a (CB11H6Cl6) - counter-ion,
we calculated that latter structure, which is somehow different from ours, since the ligated H2O
molecule is polarized in the crystal by a second water molecule and a large counter ion. Indeed, in these conditions with a second adjacent water molecule and the counter-ion (CB11H6Cl6) –, the
calculated Fe-O bond length is reduced by 0.15Å to 2.135 Å closer to the 2.039 Å diffraction value, as shown in Figure S2, ESI. Therefore the Fe-O bond distance is a sensitive detection of the polarization of this bond by various influences.
18
Complex S Fe−O Doming a Fe–N
Pb Fe–NMI FeOH [PP-FeIII]+ Exp.30 3/2 - -−0.006 0.000 1.963 1.950 - -- -[H PP-FeII]+ 1 - −0.011 1.973 - - [PP-FeII] 1 - −0.007 1.980 - - [PP-FeIII−H2O]+ Exp.8 3/2 2.281 2.039 +0.083 -1.974 1.979 - -109.0 -[H PP-Fe−H2O]+ 1 2.340 +0.045 1.980 - 107.0 [PP-FeII−H 2O] 1 2.478 +0.030 1.985 - 99.85 [PP-FeIII−(H2O)2]+ c) 3/2 2.368 − 1.990 - 107.4 [H PP-Fe−(H2O)2]+c) 1 2.410 −0.015 1.994 - 107.9 [PP-FeII−(H 2O)2] c) 1 2.616 +0.002 1.993 - 92.1
[MI- PP -FeIII−(H2O)]+ 5/2 2.438 −0.120d) 2.059 2.169 106.3
[MI- PP -FeIII]+ 5/2 - −0.411d 2.073 2.115 -
Table 2: Selected optimized geometry parameters (in Å and deg.) at the OPTX-PBE/DZVP-GGA level, of the heme complexes detailed in Table 1: a) doming distance of the Fe atom from the porphyrin plane, defined as the distance from the line joining two pyrrole N atoms; b) Np, pyrrole nitrogen atoms. c) six coordinated heme with H2O on each porphyrin face. d) inverse doming towards MI.
4-2-2 Fe-O bond analysis
In order to further explore the nature of the FeIII−O interaction, we performed a detailed topological analysis based on the Bader’s theory of “Quantum Theory of Atoms in Molecules” (QTAIM) and
19
also on the “Electron Localization Function (ELF)”. A brief description of ELF and AIM methods can be found in section 3.
Figure 7- The QTAIM (Quantum Theory of Atoms in Molecules) molecular graph of [PP-FeIII−H 2O]+
species in ground spin state. The larger spheres represent attractors attributed to atomic nuclei and the small green spheres show the bond critical points. Solid lines represent the bond paths. The critical point BCP for the Fe O bond is distant by 1.11 Å from the Fe atom. All values (see text) in the figure are in atomic units.
The relevant topological graph for ground spin state (S=3/2) is depicted in Figure 7, where the bond critical points are displayed as green dots. For the Fe−O bond, the values of the important parameters at BCP of 2BCP = +0.145 at BCP and the total electron energy density, H (BCP)=
-0.010 a.u.. With H(BCP) <0 the local potential electron energy dominates and the localization of the electron density at the BCP has a stabilizing impact on the bond.
4-2-3 Hirshfeld spin populations
The spin state of ferric heme characterizes the electron distributions about the Fe atom, the ligand and the pyrrole N-atoms. The calculated most stable spin states are the same for the free and H2O
complexed ferric heme, the intermediate state (S=3/2), with 3 unpaired electrons. This agrees with measurements on the homologous complex [FeTPP−H2O]+ (TPP=tetraphenyl porphyrin), where a
magnetic moment (µeff=4.1 µB) indicated a quartet state8. Together 1H-NMR shifts of the pyrrole
H-atoms characterize Fe porphyrin quartet states30. The action spectrum in Figure 5 reflects this
20
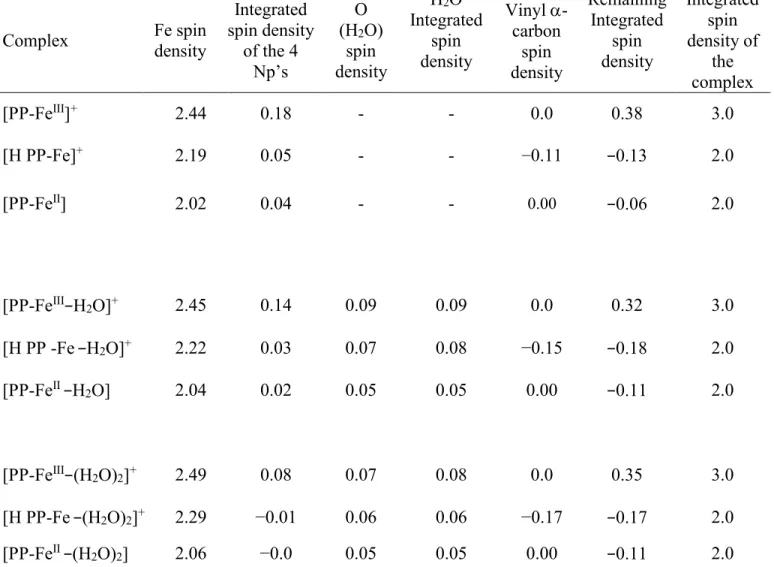
3/2 spin state by the presence of charge transfer bands in the red region of the spectrum, that are not present in low spin Fe porphyrin systems. Table 3 also collects the Hirschfeld spin densities for the most important atoms of the heme complexes under study, allowing a mapping of the unpaired electron distribution.
For comparison, we also calculated the spin densities for the corresponding ferrous hemes and included them in Table 3. It is seen that in ferric complexes, the 3 unpaired electrons are dominantly located on the Fe atom with an integrated value of 2.44, associated with a significant distribution of the spin density on four Np atoms of the pyrrolic rings and a negligible value on the H2O moiety.
A total value close to 3 for Fe and the neighboring Np atoms, points to the [PP-FeIII (S=3/2)−OH 2
(S=0)]+ electronic structure in which both interacting species preserve their spin states upon
complexation. Therefore, ligation of H2O to the ferric heme system, is accompanied only by slight
alterations of the electronic configuration of the FeIII center, hence water can be assumed as a “weak” ligand interacting with ferric heme. This also indicates the fact that ferric heme preserves its spin state following binding to H2O.
Protonated heme complexes, however exhibit a different behavior. The iterative Hirshfeld spin density distributions collected in Table 3 show that a majority of the spin density in the protonated heme complexes is distributed about the central Fe atom, while a significant excess of spin density is gained by the vinyl -carbon. This points to an ethyl radical character for the vinyl group, with a [HPP−FeIII−H
2O]+ electronic structure. Chiavarino et al. 14 have ascribed this situation to
a partial transfer of an electron from a FeII central atom to the free protonated porphyrin ring. Furthermore, comparing the spin densities on the Fe atom in protonated heme complexes with that of the ferric and natural ferrous ones (see Table 3), we found an intermediate situation between [H+PP−FeII−H
2O] and [HPP−FeIII−H2O]+ electronic structures. This result is in complete
agreement with the findings of Chiavarino et al. 14 on free protonated heme. It is worth mentioning that double ligation by water does not change this behavior. In addition, in the case of ferrous heme the same conclusions can be drawn, where ligation with H2O does not alter the spin and the number
21 Complex Fe spin density Integrated spin density of the 4 Np’s O (H2O) spin density H2O Integrated spin density Vinyl-carbon spin density Remaining Integrated spin density Integrated spin density of the complex [PP-FeIII]+ 2.44 0.18 - - 0.0 0.38 3.0 [H PP-Fe]+ 2.19 0.05 - - −0.11 −0.13 2.0 [PP-FeII] 2.02 0.04 - - 0.00 −0.06 2.0 [PP-FeIII−H2O]+ 2.45 0.14 0.09 0.09 0.0 0.32 3.0 [H PP -Fe−H2O]+ 2.22 0.03 0.07 0.08 −0.15 −0.18 2.0 [PP-FeII −H 2O] 2.04 0.02 0.05 0.05 0.00 −0.11 2.0 [PP-FeIII−(H2O)2]+ 2.49 0.08 0.07 0.08 0.0 0.35 3.0 [H PP-Fe−(H2O)2]+ 2.29 −0.01 0.06 0.06 −0.17 −0.17 2.0 [PP-FeII −(H2O)2] 2.06 −0.0 0.05 0.05 0.00 −0.11 2.0
Table 3: Iterative Hirshfeld spin populations of selected atoms obtained from the OPTX-PBE electron densities.
4-2-4 Simulation of the absorption spectra
The spectra of water complexed ferric heme [PP-FeIII−H2O]+ and of the free heme [PP-FeIII]+ have
been simulated with their optimized geometries (OPBE). The calculated spectrum of [PP-FeIII−H
2O]+ is represented in the 450-800 nm domain in Figure 5a with blue sticks. The electronic
transitions and relevant oscillator strengths have been determined at the TD-DFT/B3LYP level. The main absorption features of the experimental spectrum have been reproduced as shown in Figure 5a. The complete calculated spectrum is shown in Figure S3A of ESI and displays the most
22
intense bands close to 370 nm in the known intense experimental Soret region. The calculated spectrum of the free heme [PP-FeIII]+ is also represented in Figure 5b, together with the
experimental spectrum of [PP-FeIII−N2]+, which we deem as closest to free [PP-FeIII]+, owing to
the very weak interaction of N2 with FeIII 4, 27.
For [PP-FeIII−H
2O]+, in the 450-700 nm region, the wave function analysis shows two regions: one
with dominant porphyrin transitions between 500 600 nm and another with important porphyrin to metal transitions detailed in Table S3 in ESI file. For free heme [PP-FeIII]+, the 500 600 nm region
has a similar porphyrin character, while a strongly red shifted porphyrin to metal transition is calculated at 683 nm.
The calculated spectrum of free ferric heme and that of its N2 complex extend to 700 nm and the
band positions beyond 600 nm are red shifted from the experimental spectrum. While the experimental spectrum for [PP-FeIII−N
2]+ stops at 670 nm, there is no experimental evidence of
such intense bands at 800 nm as those shown in Figure 5b, in any of the ferric porphyrins. Indeed, bands exist in that domain but with a considerably lesser oscillator strength31, similar to that calculated for the [PP-FeIII−H
2O]+ spectrum at 850 nm (Figure S3 ESI). It may seem that the
wavefunction representation overemphasizes the metal centered oscillator strengths for free ferric heme.
5-Discussion
The [PP-FeIII-H2O]+ complex is axially ligated as shown in Figure 6 with an helicopter like
configuration for the water ligand, in agreement with crystallographic measurements on FeIII porphyrin water complexes8. This geometry is similar to that found in met-myoglobin by crystallography1 and represents the basis for the construction of water heme ligands, see Table 2.
5-1 Structure of the Heme-H2O complexes
Basic electron donating ligands are bound to ferric heme by bonds with the Fe (3dz2) orbital. In
23
backbonding from a type Fe(3dxz,yz) orbital is occurring, in contrast with other small ligands,
typically CO. Therefore the coordination of “ donors” to iron porphyrins is correlated to the Lewis basicity of the donor, the ability to share a lone pair with an acceptor molecule, ref 32 p 142. In this
view, the ligation of nitrogen bases of various strengths has been studied in the condensed phase by equilibrium measurements33. However, the difficulty of these experiments is the full control of
a single ligation, which is superseded by the axial bi-ligation in a narrow range of concentrations of the ligand and also by the formation of µ hydroxo complexes [(PP)-Fe-OH-Fe-(PP)]+ at higher concentrations of metalloporphyrins8.
In the theoretical and previous crystallographic results, [PP-Fe -H2O]+ has the water hydrogen
atoms placed in a plane quasi parallel to heme and the (b2) lone pair of the O atom is between the
O and Fe atoms. This generates in the ELF distributions a basin between these atoms, as shows in Figure S4 of ESI. This basin contains however almost no contribution of the Fe atom, hence no information on the sharing of Fe and O electrons of the Fe-O bond (covalency) can be drawn at this level. In turn, the QTAIM analysis gives additional informations on the bond, as detailed in the legend of Figure 7. The density of energy along the Fe-O path is negative at the bond critical point (HBCP=−0.010 a.u.) indicates binding, while the positive charge density Laplacian signals a
minimum of charge at this point sign of an ionic or a noncovalent bond 2526. Both values of BCP
0.043 a.u. and 2
BCP (0.14 a.u.) are significant, compared with the similar values for strong Zn–
(bipyridyl)2 complexes 34. This analysis confirms a Fe-O non-covalent bond of a certain
importance, in agreement with the sharing of the oxygen lone pair with the Fe (3dz2) orbital.
5-2 Spectra and excited states of ferric heme adducts
The comparison of calculated electronic spectra with experiment yields also interesting informations on the structure of ligated ferric heme. Both free and water complexed heme spectra have been calculated in the 300-1000 nm region. Gouterman et al.35 described first the electronic structure of porphyrins in a simple 4 electron model, that still accounts for the major features of the porphyrin spectra. There are transitions specific to the porphyrin cycle describing the Soret and Q bands but also transitions labeled as charge transfer, since they involve an electron transfer between the porphyrin and the metal 36, through electronic excitation. In a porphyrin to metal
24
ligation. This should be in principle another sensitive probe of the electronic properties of the metal water ligation.
Comparing the calculated spectra of free, N2 complexed and water complexed PP-FeIII (direct and
convoluted with a width of 40 nm) in Figure S3A of ESI, it appears that they bear a close resemblance in wavelength regions 300-600 nm, the domain of known porphyrin bands (Soret 370 and Q 500-560 nm) with the expected intensity ratios. This resemblance is confirmed in the analysis of the ground and excited wave functions, which in these regions bear a major weight over porphyrin orbitals. A more detailed account of the wave functions of ligated and free heme is given in Tables S3 of ESI.
a) b)
Figure 8-Kohn-Sham molecular orbitals involved in the 622.17 nm transition of [PP-FeIII-H
2O]+ (61%
contribution). a, and b represent respectively the HOMO-2(β) and LUMO+1(β) as the orbitals contributing most to single electron transitions. HOMO and LUMO stand for the highest occupied and lowest unoccupied single electron MO’s respectively. The metal d- contribution in panel b of the excited state, has been shown by a circle.
In difference, contributions of excited orbitals centered on the Fe atom become most important after 600 nm, as shown in Figure 8, where the 622.17 nm transition of the water complex displayed in Figure 5a shows a dominant porphyrin to metal charge transfer contribution by the population of a d orbital shown in Figure 8b. Besides this bands shifts to 680 and 690 nm respectively in the calculated spectra of the [PP-FeIII-N
2]+ complex and [PP-FeIII]+ (shown at 683.29 in
table S3B of ESI).
In Figure 5a, there is a good agreement between the calculated spectrum (blue sticks) and the experimental spectrum confirming our modelling of the [PP-FeIII-H
25
view of the convoluted spectrum of figure S3A of ESI, assign the experimental 617 nm band as a porphyrin–metal (3d) charge transfer band of the [PP-FeIII-H
2O]+ complex.
5-3 Binding energies of the complexes
The binding energy of H2O with [PP-FeIII]+ is important, since in our low partial pressure
conditions , we observe the onset of the equilibrium already at 280 K between complexed and free heme; this is a simple experimental evidence of a ‘strong‘ ligation. The resulting measured binding energy amounts to −12.2 kcal.mol-1, which is well reproduced within the present calculations, −11.7
kcal.mol-1 (Table 1, OPBE) on the ferric heme system. The attachment of a second water ligand in the 6th axial position yields a weaker bond for the second H2O, −9 kcal.mol-1, also well reproduced
by the calculations, −7.1 kcal.mol-1. The second water molecule is fixed in the 6th coordination
position of [PP-FeIII -(H2O)2]+ and not to the other water molecule. This stems from the lower
binding energy of the free water dimer, only -3.2 kcal.mol-1 37, compared to the present -9 kcal.mol-1
for sixth coordination with Fe-O binding.
Thus, in the axial coordination the two bonds counteract each other, but in a much less intense way as compared with the donor MI. Indeed, experimentally, binding to MI in 5th coordination allows in our water concentration conditions, a weak attachment of water in 6th position that places
its energy above -7 kcal.mol-1. Calculations show also a reduced energy for this 6th coordinated
complex, −7.4 kcal.mol-1 as compared with−11.7 kcal.mol-1 for the 5th coordinated water complex.
Therefore water as donor in 5th coordination competes far less strongly for the Fe (3dz2) orbital
than methylimidazole38, but has still a destabilizing effect upon the 6th coordination.
The first ligation of an H2O molecule to ferric heme appears as a moderately strong non covalent
bond involving a donation to the Fe atom.
5-4 The specific character of water bonding to ferric hemes
Small ligands CO, O2, NO, experience a dramatic reduction in their binding properties with Fe
hemes when switching from FeII to FeIII. The bonding in ferrous FeII hemes is linked to the strong donation to Fe(3dz2), consequence of a the spin change in the FeII atom that places electrons in the
26
S=0 spin state and in the lowest energy Fe(3dz2) orbitals. On the contrary, FeIII hemes have a weaker
bonding due to the absence of spin crossing to the low spin S=1/2 states This lower binding is associated to the presence of a half-filled Fe(3dz2) orbital. The case of the ligation of [PP-FeIII]+
with H2O is shown here as different experimentally, where the ferric [PP-FeIII H2O]+ is much
more strongly bound than the protonated heme [H PP-Fe H2O]+, partially ferrous. The bond
energy is low, > -3.1 kcal.mol-1 difficult to attain experimentally at temperatures above 170 K,
where water is in sufficient concentration. On the theoretical side, the same tendency to a decreased bonding by protonation is observed and examining the binding details in Table 1, one sees that in absence of dispersion (generated mostly by the heme), the bond is repulsive for [H PP-Fe−H2O]+.
Calculations on ferrous porphyrins by Strickland39 et al. at the CCSD level also found a binding energy close to zero between [FeIIP] (singlet ) and H2O. We can therefore infer that H2O, in
difference with small ligands O2 CO NO does not succeed in inducing a low spin configuration for
[PP-FeII −H
2O] and thus ferrous heme is disfavored with respect to ferric heme in its complexation
with water, as summarized in Ec and E within Table 1. The small energy of protonated and ferrous heme water complexes accords also with the absence of direct interference of H2O with
ferrous hemoproteins, whose complexes only form at low temperatures, in difference with the
ferric ones40.
6- Conclusions
The binding of isolated ferric heme with H2O has been determined with precision in the gas phase
by thermodynamic measurements in a controlled variable temperature ion trap. The van’t Hoff method has been chosen to derive the enthalpy of ligation from the measurements of the ratio of ligated heme to unligated heme as a function of temperature. In our setup, at low ligand pressures 10-6 mbar, equal concentrations of ligated vs unligated heme are observed at 255 Kthat corresponds to a deep well. The extrapolated binding energy at 0 K is −12.2±0.6 kcalmol−1. This binding energy
is important and is several times higher than that of O2 and CO to ferric heme, however inferior to
that of NO (-24.9 kcal.mol-1) 5. Therefore, in normal conditions, ferric heme shall not bind O 2 nor
CO, but easily H2O. The setup has allowed to explore sequentially the formation of more complex
27
studied the complexation of protonated ferric heme [H PP-FeII/III]+ which was only very weakly observed, while in the same conditions [PP-FeIII−H2O]+ was easily formed.
The binding characteristics of ferric heme and H2O has been investigated through high level DFT
calculations with the OPBE functional and the quartet (S=3/2) spin state has been predicted as the most stable spin state for [PP-FeIII−H2O]+ as for its unligated [PP-FeIII]+ homologue. Thus no spin
crossing is observed to occur following water ligation to [PP-FeIII]+. The OPBE calculations
reproduce the observed binding energy with an energy of -11.7 kcal.mol-1 and confirm a strong
interaction. The influence of double ligation in a sixth coordinated complex [FeIII TPP−(H2O)2]+ is
also well reproduced in calculations, where the second ligation of H2O is 20% weaker than the
first.
Nevertheless, spin density calculations show a majority of 3 unpaired electrons on the FeIII center,
the same as for a free ferric heme in the intermediate spin 3/2. This indicates a non covalent interaction of H2O with the Fe atom in the heme, also characterized in the QTAIM analysis.
The interesting fact is the strong binding energy of H2O to [PP-FeIII]+, much higher than measured
for small ligands O2, CO but smaller than NO that undergoes an electronically complex binding
scheme involving spin crossing to S=0. Here the spin state of the [PP-FeIII H2O]+ complex remains
intermediate as for free ferric heme27, even with the ligation occurring through a donation from the lone pairs to Fe(3dz2). Therefore water ferric heme occupies a striking intermediate case as Zerner36 noted as early as 1966. This value is even more striking when compared with that of protonated heme13 intermediate between ferric and ferrous-heme showing experimentally a considerably diminished binding energy with water. Theoretical calculations lead us to the conclusion that H2O does not allow spin crossing in protonated heme or ferrous heme, the source
of strong binding. It will be essential now to investigate ferrous heme binding with H2O, likely via
negative ion porphyrins6 using the present methods.
In the present investigation of the 5th and 6th coordination of water complexes, the latter coordination indicates a reduction of the H2O ligand binding through the trans-axial effect38, while
water binds met-myoglobin. This H2O affinity for the ferric heme protein containing histidine
28
measurements1. In our stepwise approach of ferric heme binding with ligands, the next experiment will bring a mimic of the presence of distal histidine in order to describe the interaction of iron with water in a hemoprotein pocket.
Acknowledgments:
This work was supported by the Center for International Scientific Studies and Collaboration (CISSC), French Embassy in Iran and the PHC Gundishapur 2016-2017 project n°35629XE RO and MA, thank the Iranian National Science Foundation (INSF, No. 97018759) and University of Isfahan for support. We are grateful to Laboratoire de Chimie Physique of CNRS and the University of Paris-Sud for supporting our computations. We thank GENCI for a generous time allocation on the CINES supercomputers (project number hcp6830)
References
1. M. L. Quillin, R. M. Arduini, J. S. Olson and G. N. Phillips, J. Mol. Biol., 1993, 234, 140. 2. W. X. Cao, J. F. Christian, P. M. Champion, F. Rosca and J. T. Sage, Biochemistry, 2001,
40, 5728.
3. R. C. Dunbar and T. B. McMahon, Science, 1998, 279, 194.
4. L. Ferrand, S. Soorkia, G. Gregoire, M. Broquier, B. Soep and N. Shafizadeh, PCCP, 2015, 17, 25693.
5. B. Chiavarino, M. E. Crestoni, S. Fornarini and C. Rovira, Inorg. Chem., 2008, 47, 7792. 6. T. Karpuschkin, M. M. Kappes and O. Hampe, Angew. Chem. Int. Ed., 2013, 52, 10374. 7. S. Dillinger, J. Lang and G. Niedner-Schatteburg, J. Phys. Chem. A, 2017, 121, 7191. 8. D. R. Evans and C. A. Reed, J. Am. Chem. Soc., 2000, 122, 4660.
9. J. Vojtěchovský, K. Chu, J. Berendzen, R. M. Sweet and I. Schlichting, Biophys. J., 1999, 77, 2153.
10. A. Abdurahman and T. Renger, J. Phys. Chem. A., 2009, 113, 9202. 11. M. C. Durrant, Dalton Transactions, 2014, 43, 9754.
12. G. Feraud, M. Broquier, C. Dedonder-Lardeux, G. Gregoire, S. Soorkia and C. Jouvet,
PCCP, 2014, 16, 5250.
13. N. Shafizadeh, S. Soorkia, G. Grégoire, M. Broquier, M.-E. Crestoni and B. Soep,
29
14. B. Chiavarino, M. E. Crestoni, S. Fornarini and C. Rovira, Chemistry-a European
Journal, 2007, 13, 776.
15. D. M. Murphy and T. Koop, Quarterly Journal of the Royal Meteorological Society, 2006, 131, 1539.
16. A. M. Koster, G. Geudtner, A. Alvarez-Ibarra, P. Calaminici, M. E. Casida, J. Carmona-Espindola, V. D. Dominguez, R. Flores-Moreno, G. U. Gamboa, A. Goursot, T. Heine, A. Ipatov, A. de la Lande, F. Janetzko, J. M. del Campo, D. Mejia-Rodriguez, J. U. Reveles, J. Vasquez-Perez, A. Vela, B. Zuniga-Gutierrez and D. R. Salahub, The deMon
Developers, Cinvestav, México City, 2016.
17. S. Grimme, S. Ehrlich and L. Goerigk, J. Comput. Chem., 2011, 32, 1456. 18. J. M. Wittbrodt and H. B. Schlegel, J. Chem. Phys., 1996, 105, 6574.
19. R. F. W. Bader, Atoms in Molecules, A Quantum Theory, Oxford University Press, New York, 1990.
20. A. D. Becke and K. E. Edgecombe, J.Chem.Phys., 1990, 92, 5397. 21. K. AIMAll (Version 10.05.04), T. A., 2010 (aim.tkgristmill.com).
22. S. Noury, X. Krokidis, F. Fuster and B. Silvi, Comput. Chem., 1999, 23, 597.
23. P. Bultinck, C. Van Alsenoy, P. W. Ayers and R. Carbo-Dorca, J. Chem. Phys., 2007, 126, 144111.
24. R. Ahlrichs, M. Bar, H. Baron, R. Bauernschmitt, S. Bocker, M. Ehrig, K. Eichkorn, S. Elliot, F. Furche and F. Haase, TURBOMOLE V6. 3 2011, a development of University of
Karlsruhe and Forschungszentrum Karlsruhe GmbH, 1989–2007, TURBOMOLE GmbH, since 2007, 2011.
25. S. J. Grabowski, Chem. Rev., 2011, 111, 2597.
26. E. Espinosa, I. Alkorta, J. Elguero and E. Molins, J.Chem.Phys., 2002, 117, 5529. 27. M. Aarabi, R. Omidyan, S. Soorkia, G. Grégoire, M. Broquier, M.-E. Crestoni, A. de la
Lande, B. Soep and N. Shafizadeh, PCCP, 2019, 21, 1750.
28. B. Chiavarino, M. E. Crestoni and S. Fornarini, Croat. Chem. Acta, 2014, 87, 307. 29. M. A. Duncan, Int. Rev. Phys. Chem., 2003, 22, 407.
30. M. Fang, S. R. Wilson and K. S. Suslick, J. Am. Chem. Soc., 2008, 130, 1134. 31. W. J. Bowen, J. Biol. Chem., 1949, 179, 235.
32. G. N. Lewis, Valence and the structure of atoms and molecules, ACS Chemical Catalog Company, New York, NY USA, 1923.
33. T. Yoshimura and T. Ozaki, Bull. Chem. Soc. Jpn., 1979, 52, 2268.
34. I. Cukrowski, J. H. de Lange and M. Mitoraj, J. Phys. Chem. A., 2014, 118, 623. 35. M. Gouterman, G. H. Wagnière and L. C. Snyder, J. Mol. Spectrosc., 1963, 11, 108. 36. M. Zerner, M. Gouterman and H. Kobayashi, Theor. Chim. Acta, 1966, 6, 363.
30
37. B. E. Rocher-Casterline, L. C. Ch'ng, A. K. Mollner and H. Reisler, J.Chem.Phys., 2011, 134, 211101.
38. A. P. Hunt and N. Lehnert, Acc. Chem. Res., 2015, 48, 2117. 39. N. Strickland and J. N. Harvey, J.Phys.Chem. B, 2007, 111, 841.
40. D. C. Lamb, A. Ostermann, V. E. Prusakov and F. G. Parak, European Biophysics
Journal, 1998, 27, 113.
![Figure 1: a)Mass spectra showing the evolution between [PP-Fe III −H 2 O] + and [PP-Fe III ] + as a function of temperature between 290 and 230K ; b)Van’t Hoff plot of the [PP-Fe III −H 2 O] + / [PP-Fe III ] + equilibrium in the ion trap](https://thumb-eu.123doks.com/thumbv2/123doknet/13190375.391853/10.918.137.789.193.457/figure-mass-spectra-showing-evolution-function-temperature-equilibrium.webp)
![Figure 2 : a)Mass spectra showing the evolution between [PP-Fe III −(H 2 O) 2 ] + and [PP-Fe III − H 2 O] + as a function of temperature between 220 and 150 K at 2.10 -5 mbar total pressure; b) Van’t Hoff plot of the equilibrium o](https://thumb-eu.123doks.com/thumbv2/123doknet/13190375.391853/11.918.128.815.126.381/figure-spectra-showing-evolution-function-temperature-pressure-equilibrium.webp)

![Figure 4: Simultaneous plots of [PP-Fe III −H 2 O] + / [PP-Fe III ] + (blue) and [H PP-Fe−H 2 O] + / [H PP-Fe] + (green)](https://thumb-eu.123doks.com/thumbv2/123doknet/13190375.391853/14.918.295.596.103.360/figure-simultaneous-plots-pp-iii-iii-blue-green.webp)
![Figure 5a): Action spectrum of the [PP-Fe III −H 2 O] + complex observed by [PP-Fe III ] + detection obtained at T Trap = 155K (black)](https://thumb-eu.123doks.com/thumbv2/123doknet/13190375.391853/15.918.235.664.117.453/figure-action-spectrum-complex-observed-detection-obtained-trap.webp)

![Figure 7- The QTAIM (Quantum Theory of Atoms in Molecules) molecular graph of [PP-Fe III −H 2 O] + species in ground spin state](https://thumb-eu.123doks.com/thumbv2/123doknet/13190375.391853/20.918.186.743.202.469/figure-qtaim-quantum-theory-atoms-molecules-molecular-species.webp)
![Figure 8- Kohn-Sham molecular orbitals involved in the 622.17 nm transition of [PP-Fe III -H 2 O] + (61%](https://thumb-eu.123doks.com/thumbv2/123doknet/13190375.391853/25.918.123.728.432.649/figure-kohn-sham-molecular-orbitals-involved-transition-iii.webp)
