HAL Id: hal-02902864
https://hal.archives-ouvertes.fr/hal-02902864
Submitted on 7 Dec 2020HAL is a multi-disciplinary open access archive for the deposit and dissemination of sci-entific research documents, whether they are pub-lished or not. The documents may come from teaching and research institutions in France or abroad, or from public or private research centers.
L’archive ouverte pluridisciplinaire HAL, est destinée au dépôt et à la diffusion de documents scientifiques de niveau recherche, publiés ou non, émanant des établissements d’enseignement et de recherche français ou étrangers, des laboratoires publics ou privés.
Toward a chemical control of colloidal YVO4
nanoparticles microstructure
Marie-Alexandra Neouze, Alexy Freitas, Raj-Kumar Ramamoorthy, Rabei
Mohammedi, Eric Larquet, Sandrine Tusseau-Nenez, David Carriere, Thierry
Gacoin
To cite this version:
Marie-Alexandra Neouze, Alexy Freitas, Raj-Kumar Ramamoorthy, Rabei Mohammedi, Eric Larquet, et al.. Toward a chemical control of colloidal YVO4 nanoparticles microstructure. Langmuir, American Chemical Society, In press, 36 (31), pp.9124-9131. �10.1021/acs.langmuir.0c01266�. �hal-02902864�
1
Toward a chemical control of colloidal YVO
4
nanoparticles microstructure
Marie-Alexandra Neouze,1,2,†,§ Alexy P. Freitas,1,2,§ Raj-Kumar Ramamoorthy, 2,# Rabei Mohammedi,1 Eric Larquet,1 Sandrine Tusseau-Nenez1, David Carrière,2* Thierry Gacoin1*
1 Laboratoire de Physique de la Matière Condensée, Ecole Polytechnique, CNRS, Université
Paris-Saclay, Route de Saclay, 91128 Palaiseau cedex (France).
2 NIMBE, CEA, CNRS, Université Paris-Saclay, CEA Saclay 91191 Gif sur Yvette Cedex
KEYWORDS: vanadate nanoparticles - co-precipitation - nanocrystals - SAXS - microstructure.
Abstract.
Rare earth doped oxides are a class of compounds that have been largely studied in the context of
the development of luminescent nanocrystals for various applications including fluorescent
labels for bio-imaging, MRI contrast agents, luminescent nanocomposite coatings etc.
Elaboration of colloidal suspensions is usually achieved through coprecipitation. Particles exhibit
2
defects or surface quenching species. Focusing on YVO4:Eu, one of the first reported systems,
the aim of this work is to revisit the elaboration of nanoparticles obtained through a simple
aqueous coprecipitation route. The objective is more precisely to get a better understanding of
the parameters affecting the particles’ internal microstructure, a feature that is poorly controlled
and characterized. We show that the hydroxyl concentration in the precursor solution has a
drastic effect on the particles’ microstructure. Moreover, discrepancies in the reported particles
structure are shown to possibly arise from a carbonation of the strongly basic orthovanadate
precursor. For this study, SAXS/WAXS is shown to be a powerful tool to characterize the
multiscale structure of the particles. It could be shown that playing on the precursor composition,
it may be varied between almost monocrystalline nanocrystals to particles exhibiting a
hierarchical microstructure well described by a surface fractal model. This work provides a new
methodology for the characterization of nanoparticles microstructure, and opens new directions
for its optimization in view of applications.
Introduction.
In the context of the development of light emitting nanoparticles, rare earth doped oxides appear
as appealing systems considering their high emission yield, their simple functionalization and
their interesting spectroscopic features such as narrow emission lines for f transitions, tunable
emission wavelength by playing on the rare earth dopant, possible up-conversion emission [1],
etc. YVO4:Eu has been among the first reported systems, mainly because the bulk material
exhibits high emission yield [2] and crystalline nanoparticles can be quite easily prepared
3
applications were investigated in various fields such as light emitting coatings [5,6], biolabels for
luminescence imaging and sensors [7-9] - or more recently as contrast agent in Magnetic
Resonance Imaging (MRI) [10].
The development of optimized elaboration processes is a very important issue in order to
obtain stable dispersions of colloidal particles with a controlled size and enhanced emission
properties. In this field, the main issue is to obtain particles exhibiting the highest emission yield
considering the detrimental impact of surface quenching (especially by surface hydroxyls) or the
presence of crystalline defects, grains boundaries and even porosity [11, 12]. However, particles
with a high specific area might be preferred for other applications such as chemical sensors or
relaxing agents for MRI which require optimized interactions with the surrounding chemical
environment. A compromise between the best emission properties on the one hand and the best
surface sensitivity on the other hand thus requires developing chemical syntheses of
nanoparticles with a well-controlled microstructure, not only toward a perfect monocristallinity.
Many papers have reported the influence of some parameters of elaboration on the particles’
morphology, evidencing the role of pH, thermal conditions of elaboration (hydrothermal
synthesis or microwave heating), addition of surfactants, or complexing agents [9, 13-17]. Fewer
works have concerned the detailed analysis of the particles’ internal microstructure in term of
polycrystalline arrangement, crystalline defects or porosity. These features appear to be poorly
controlled and the link with experimental parameters is both unclear and unreproducible. Such a
poor control of the synthesis was also evidenced by our observation that simple change in the
sodium orthovanadate precursor batch leads to particles with significantly different
4
Following our previous investigation [18] on the mechanism of the particles’ formation by
aqueous coprecipitation, which evidenced the template role of an amorphous phase, the present
work aims in revisiting the elaboration process of YVO4 nanoparticles using perfectly controlled
experimental initial conditions. We decided to start from sodium metavanadate NaVO3 instead of
the orthovanadate Na3VO4, which has been commonly used by us and many others. The goal is
to have a perfect control of the pH, monitored as the number of equivalents of NaOH with
respect to NaVO3. Moreover, suspecting a significant influence of carbonates present in the
alkaline orthovanadate precursors (Table S1 in the Supporting Information), we also decided to
investigate the impact of this specific additive. Playing on the alkalinity of the solutions and the
presence of carbonates, the structure of the obtained particles was fully characterized using X-ray
diffraction (XRD) and transmission electron microscopy (TEM), but also using small- and
wide-angle X-ray scattering (SAXS-WAXS) of the solution without prior drying, thus providing a
complete multiscale characterization of the particles. We evidenced the drastic influence of the
investigated chemical parameters on the particles’ structure, thus offering a convenient and
reproducible way for its control toward optimized properties.
Experimental Section
YVO4:Eu nanoparticles elaboration. Unless otherwise specified, all powder precursors
(NaVO3, Na2CO3, Y(NO3)3.6H2O, Eu(NO3)3.5H2O) have been purchased from Sigma-Aldrich
and used as such in MilliQ water. All steps of the synthesis are achieved under ambient
conditions. In a typical synthesis, a first aqueous solution is prepared with NaVO3 (0.1 mol.L-1)
and the appropriate amount of NaOH (2 or 3 equivalents with respect to NaVO3, from a fresh
5
added. The carbonate content in the metavanadate solutions was found below sensitivity of the
carbonate specific electrode (Orion™ 9502BNWP), estimated to the micromolar range. A second
aqueous solution is prepared with Y(NO3)3 (0.08 mol.L-1) and Eu(NO3)3 (0.02 mol.L-1). In a
second step, 25 mL of each solution are mixed rapidly and left under vigorous stirring for 12
days prior to analysis.
Structural characterizations. Powder X-ray diffraction (XRD) experiments were carried out
with a Bragg-Brentano geometry diffractometer (X’Pert PANalytical) equipped with a Cu tube
(K1 and K2 wavelengths) and the X’Celerator detector. A careful preparation of the sample was
achieved in order to prevent any structural change to occur through recovering the particles as a
dried powder. 10 mL of the colloidal suspension are mixed with 10 mL of ethanol. The mixture
is centrifuged (3 min. 13000 g) and the precipitate is mixed again with 20 mL ethanol then
centrifuged again. The precipitate is then dispersed in 20 mL of acetone and centrifuged for a
third time. The supernatant is discarded and the precipitate is left for drying under ambient
conditions.
TEM observations. Transmission Electron Microscopy (TEM) observations were carried out
with a JEOL JEM-2010F microscope operating at 200 kV accelerating voltage with a
high-resolution HR polar piece (Cs = 1.4 mm, point high-resolution = 0.21 nm). Images were collected
with a 4Kx4K GATAN 794 CCD camera. 20µL droplets of water diluted particles were
successively positioned on an individual Parafilm line. Using a specimen grid coated with an
appropriately positive glow-discharge treated carbon, the grid is put in contact with the sample
droplet by capillarity. After allowing one minute for adsorption of the sample on the carbon, the
6
The fluid in excess is then removed by carefully placing a filter paper wedge onto the edge of the
grid, followed by air-drying.
X-ray scattering characterizations. Small and wide angle X-ray scattering (SAXS/WAXS)
measurements have been performed at a wavelength of 12.5 keV both on the ID02 beamline at
the ESRF synchrotron facility [19] and at the Swing beamline at SOLEIL [20]. On ID02, two
CCD detectors were used for simultaneous collection of SAXS and WAXS at respective
distances of 160 cm (q ≤ 0.6 Å-1) and 13 cm (q ≥ 0.6 Å-1). On Swing, two sample–detector
distances of 6.3 m and 58 cm were used, leading to a range of q = 5.6 × 10⁻³ Å–1 to 3.1 Å–1. On
the ID02 beamline, the nanoparticles were stabilized against sedimentation by several
centrifugations/redispersions in water, and by addition of ammonium poly(acrylate). On the
Swing beamline, pristine solutions without stabilization were used, with less than a minute
between introduction in the glass capillary and the end of the acquisition. Model fitting has been
performed using a home-made script written in Python language, as detailed in Supplementary
Information. The standard deviation on the fit parameters and derived physical constants (e.g. the
specific area) have been estimated with the resampling (“bootstrapping”) method [21]: in order
to reproduce and propagate the experimental uncertainty, the fits and calculations were
performed over a series of 100 datasets randomly generated around the experimental dataset,
with a variance equal to the experimental standard deviation. The 95% confidence interval was
obtained from the histogram of the parameters of interest.
Results and Discussion
Particle synthesis. This work aims to precisely understand the influence of chemical
7
aqueous solutions. It is admitted from several studies that the pH has a drastic influence through
determining the precipitation of an amorphous hydroxylated precipitate which structure may
influence the final particle microstructure [18]. Due to the speciation of the vanadate species [22,
23], YVO4 is obtained at rather high pH (typically higher than 12). This pH is mainly imposed
by the orthovanadate when using this precursor, but can be adjusted through the addition of a
base either before or during the precipitation. However, because the molarity of hydroxyl ions is
log-dependent on the pH, the latter is actually a poor indicator of the former in extremely basic
media (typically pH ~13). Also, discrepancies were found in the natural pH of orthovanadate
solutions depending on the supplier or lot number leading to particles with variable structures
(Table S1 in the Supporting Information). Hypothesis is made that this could arise from a partial
carbonation of the orthovanadate powder either from the supplier or during its storage, favored
by its basic character. This was confirmed through the measurement of the carbonate content in
solutions made using orthovanadate from different suppliers: results (Table S1 in the Supporting
Information) indeed evidenced a significant amount of carbonates in almost all precursor
batches, exhibiting a CO32-/V molar ratio comprised between 0.06 and 0.72.
In order to have a precise understanding of the influence of pH and carbonates on the
microstructure of the YVO4 nanoparticles, we thus decided to use a metavanadate precursor
(NaVO3) which stoichiometry is well controlled and which has a much lower tendency toward
carbonation (a 0.1 mol.L-1 solution has a pH of 7.9). The carbonate content in the metavanadate
solutions was found below the detection limit of a carbonate-specific electrode, estimated to the
micromolar range. It is, as expected, orders of magnitude lower than for solutions prepared from
orthovanadate precursors. Although the speciation of vanadate in solution may be rather complex
8
precursor in order to ensure conversion into the orthovanadate (VO3- + 2 OH- VO43- + H2O).
Na2CO3 was also optionally added to the vanadate precursor. This preparation allows for the
precipitation of the YVO4 under similar conditions as if partially carbonated Na3VO4 had been
used, but with a precisely controlled composition of the precursor solution.
Table 1 summarizes the investigated compositions, (named YV2, YV2C, YV3 and YV3C),
where YVn refers to the preparation of YVO4 nanoparticles using n equivalents of NaOH in the
vanadate precursor. The addition of carbonates (one equivalent as compared to V) is indicated by
the C label. Sample NaVO3 mol.L-1 NaOH mol.L-1 Na2CO3 mol.L-1 pH Y(NO3)3 + Eu(NO3)3 mol.L-1 YV2 0.1 0.2 0 12.8 0.08 + 0.02 YV2C 0.1 0.2 0.1 12.8 0.08 + 0.02 YV3 0.1 0.3 0 12.9 0.08 + 0.02 YV3C 0.1 0.3 0.1 12.9 0.08 + 0.02
Table 1. Samples name and compositions of the precursor solutions.
X-Ray Diffraction (XRD) structural characterization. Structural characterizations were first
achieved using X-ray diffraction from dried powders of nanoparticles. In all samples,
crystallization was found to occur from an amorphous hydroxylated phase similarly to what has
been described previously [18] but with kinetics that appeared strongly affected by the pH (n
value). Qualitative monitoring by XRD (Figure S1 in the Supporting Information) evidenced that
the conversion into YVO4 was completed within a few hours in the case of YV2 and YV2C and
9
as obtained after an ageing time that we fixed to 12 days, which was found necessary to ensure a
complete reaction of crystallization for all particles.
Figure 1. X-ray Diffractograms (Cu K) of the four YV2, YV2C, YV3, YV3C samples.
Reference vertical lines were calculated from the reference patterns of YVO4 (ICSD-36060) and
EuVO4 (ICSD-81702) assuming the Vegard's law for the Y0.8Eu0.2VO4 composition.
Fig. 1 shows the X-ray diagrams recorded for the four investigated YVO4 samples. All exhibit
the characteristic peaks of the quadratic I41/amd zircon (or xenotime) structure, known for the
bulk YVO4 [24] with no detectable parasitic phases. Clear differences are observed considering
the peaks broadening, evidencing large differences in the particles’ structure depending on the
synthetic conditions. Peak broadening may result from different deviation from the bulk
monocrystalline material such as limited size effect or microstrains associated to defects.
Different approaches of X-ray diagram analysis may be used to get some more quantitative
analysis of the particles’ structure, also considering some anisotropy effects. Application of the
10
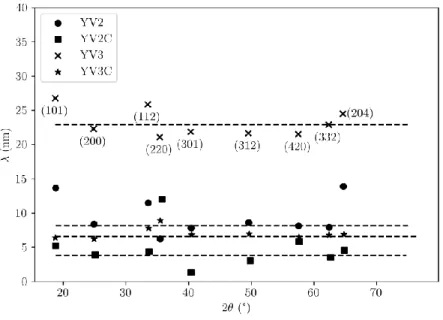
distinct diffraction peaks as a function of their diffraction angle. The results, shown in Fig.2,
shows the large variation of average coherence lengths ranging from 3.8 nm (YV2C) to 23 nm
(YV3), with 6.6 nm (YV3C) and 8 nm (YV2).
Figure 2. Coherence length for samples YV2, YV2C, YV3, YV3C determined from the Scherrer
equation for all peaks observed in the diffraction diagrams (see Fig. 1)
It nevertheless obviously appears that providing an average coherence length can only be a
rough estimation, considering the discrepancy of coherence lengths obtained from different
peaks. This can be attributed to the effect of some anisotropies of shape and/or microstrains
(even if in the Scherrer formula only a size effect was taken into account) along certain direction.
Analysis of microstrains using the Williamson-Hall or the Halder-Wagner equations [25,26]
(Figures S2 and S3 in the Supporting Information) is also strongly limited by anisotropy. We
thus achieved a Rietveld analysis using the MAUD software [27] thus introducing in particular
shape anisotropies and lattice parameters as adjustable parameters (Table S2 in the Supporting
11
when considering that the crystallites exhibit a prolate spheroidal shape with adjustable
dimensions. Results are provided on Table 2.
Coherence lengths derived from the Rietveld analysis confirm the much higher values
observed for the YV3 sample as compared to other samples, especially the carbonated ones. In
addition, the crystallites in the YV3 sample appear more isotropic, while the YV2 crystallites -
and to a lesser degree the carbonated ones - seem to have a more prolate morphology. These
values are in agreement with the sizes calculated from the Scherrer equation, as the level of
microstrain is very low (< 1%) whatever the sample.
Lattice parameters are determined from the simulation and compared to those of a synthesized
bulk compound with the same Eu content in solid solution. The latter has parameters comparable
to those calculated using a linear combination of bulk YVO4 and EuVO4 [28,29], confirming the
good dispersion of the Eu as a solid solution. YV2 sample has parameters very close to those of
the bulk, which is not the case of other samples although deviations are not very important.
Sample Bulk YV2 YV2C YV3 YV3C
Lattice parameters a = b (Å) 7.147 7.140 7.102 7.163 7.152 c (Å) 6.309 6.302 6.279 6.297 6.273 Average Coherence length Lc (nm) / 10.6 5.7 26.7 8.8 microstrains / 0.004 0.020 0.002 0.007 Coherence length
along long axis Lc (001)(nm)
/ 17.4 8.4 34.6 12.0
12
along short axis Lc (100)(nm)
Shape anisotropy Lc (001)/ Lc (100)
/ 1.5 1.3 1.1 1.2
Table 2. Structural parameters extracted from XRD patterns using the Rietveld analysis (MAUD
software). The average coherence length is the square root of the ellipsoid volume.
TEM Microscopy. Fig. 3 shows typical TEM images for each sample. Clear variations of the
microstructures are observed between the different samples. YV2 particles (top-left corner) are
rather polydisperse and exhibit a strongly anisotropic shape, thus confirming the conclusion of
the XRD analysis. We note that their morphology is similar to the one of many reported YVO4
nanoparticles from the literature [4, 9, 15], leading to the hypothesis of oriented attachment of
13
Figure 3. TEM microscopy of the four YV2, YV2C, YV3 and YV3C samples
Images of the YV3 sample confirm its much higher crystallinity, both regarding the contrast
homogeneity within the volume of the particles and the crystalline facets. The particles are
nevertheless not completely monocrystalline, considering that their size as seen in the TEM
pictures (20 to 80 nm) is significantly larger than the coherence length obtained from XRD
14
Samples obtained under the presence of carbonates (YV2C and YV3C) exhibit a similar
morphology that seems to result from the aggregation of primary particles which dimensions
seem to be compatible with the crystallite size estimated from XRD (less than 10 nm).
Structural characterizations by SAXS/WAXS. The TEM pictures show prominent electron
contrast heterogeneities in the YV2, YV2C and YV3C assigned to the roughness of the particles.
Modeling of the SAXS and WAXS patterns (Fig. 4) allows specifying the properties of the
surface, and in particular measuring the surface area of the particles.
Qualitatively, we observe at low q values an inflexion assigned to the characteristic size of the
particles (q ≈ 10-2 Å-1, diameter ≈ 10 nm), followed by an inflexion characteristic of smaller
grains that constitute the particles (q ≈ 10-1 Å-1, diameter ≈ 1 nm). The magnitude of the latter
signal varies as expected from the TEM observations: the signal of the primary grains is well
resolved for the YV2C and YV3C syntheses, remains observable for the YV2 syntheses, but is
hardly observed for the YV3 syntheses. Between both signals, the scattered intensity decays as a
q-p law with p < 4 (Fig. 4, dotted lines), that is characteristic of the roughness induced by the
15
Figure 4. Small- and wide-angle X ray scattering patterns of a) YV2, b) YV3, c) YV2C and d)
YV3C nanoparticle dispersions. The dotted line indicates a q-4 decay characteristic of objects
with a smooth interface (Porod’s law). The red lines and symbols are the best fit of surface
fractal models. The datasets with the lowest q values have been recorded at the SOLEIL/Swing
beamline. The datasets with the highest q values have been recorded at the ESRF/ID02 beamline.
The intensity shift between the experiments is due to variable sample concentrations after
16
To assess quantitatively this structural information, we have fitted the SAXS patterns with a
model describing nanoparticles of adjustable surface roughness (Figure 4, red lines, and Figure
5). To account for the TEM observations, the surfaces of the particles are constructed by
accumulation of Ngrain nanometer-scaled surface primary grains (Figure 5). The total contribution
is described with the following generic model (Supporting Information):
- -
(Eq. 1)
where is the number of particles per volume unit of solution, and the
contrast in scattering length density of the bulk crystal, where the scattering length density of
either phase is related to the electron density via with the scattering length of a single electron. The expression is built by combining a description for the contribution of the
whole particle, and a description for the aggregation of the grains within the nanoparticles. [30]
The whole particle is described by phenomenological form factor
weighted by volume and averaged over the size distribution of the particles, that describes the
smooth geometrical envelope of the particles (see Fig. 5) characterized by the inflexion at q ≈ 10
-2 Å-1:[31]
(Eq. 2)
with rg,particle the radius of gyration of the particle and a correction to
damp the q-p power law at low-q values and avoid the Guinier contribution to become negligible.
17
primary grains is described by a Gaussian distribution of spherical particles, characterized by the
inflexion at q ≈ 10-1 Å-1 [32]:
(Eq. 3)
with , , , and .
The form factor of the primary grains is modulated by the structure factor describing the
aggregation into the surface of the nanoparticles ( - , see Supporting Information), producing the cross-over between the inflexions at q ≈ 10-2 Å-1 and q ≈ 10-1 Å-1:
- (Eq. 4)
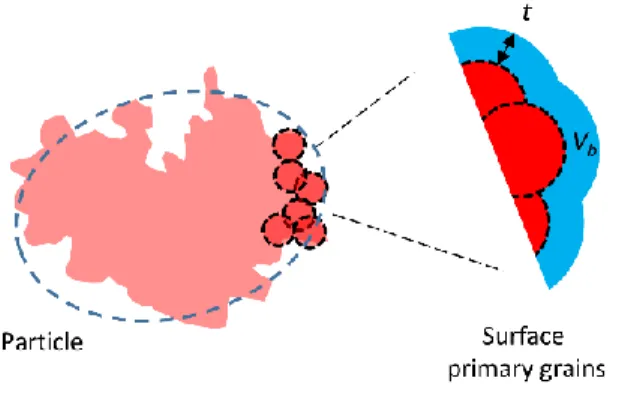
This structure factor has been constructed using the concept of surface fractals made by
accretion of grains, defined as follows (Figure 5): [33, 34] given a probe molecule of size t, we
define the boundary volume as the total volume that the probe molecule is able to explore, while
keeping in contact with the surface. For a flat surface, the volume of the boundary layer is simply
Vb = St, with S the surface area of the surface. In other words, for a flat surface the Vb/t ratio give
the surface area, in this case independent on the choice of the probe length t. The flat surfaces produce a characteristic scattering that follows a Porod’s law (Fig. 4, dotted line).
The deviations from the Porod’s law observed here are assigned to the presence of rough fractal
surfaces. In this case, smaller molecules will access the smaller deteails of the rough surface,
while large molecules will only access a coarse-grained surface, and therefore a smaller effective
area. More precisely, the boundary volume has a slower increase with t and varies instead as , where 2 ≤ D
s < 3 is the fractal dimension of the surface. It results that the surface
18
A = (Eq. 5)
Here, we further construct the surface fractal by accumulation of surface primary grains of
diameter dgrain ( - , which limits the range of the fractal behavior of eq. 2 to typically
dgrain ≤ t ≤ dparticle.
In practice, we measure the surface area A per volume of geometrical envelope V as:[34]
(Eq. 6)
and fix the lower boundary to
, where translates the radius of
gyration as determined by model fitting, into the physical radius of the particle assumed
spherical.
At larger probe sizes (typically > 10 nm), the surface area scales inversely with the size of the
particle as usual (Figure 6). At smaller probe sizes (typically in the Angstrom range), the finer
details of the particles are resolved, and the resulting surface area is the accumulation of the
surface areas of the primary grains, modulated by their coalescence.
Figure 5. Construction of the model used to represent the particles for SAXS fitting. The rough
19
surface fractal. The blue area is the boundary volume Vb delimited by a boundary thickness t, that
varies as .
Fitting the model given by eq. 1-4 to the scattering signal (see Supporting Information), we
find characteristic sizes of the surface primary grains that are consistent with the TEM
observations (Table 3). The surface of the YV2 nanoparticles is best described as fractal
aggregates of c.a. 1 nm diameter primary grains, against 2 nm for the YV2C and YV3C samples.
By contrast, for the YV3 particles, the characteristic size of the surface primary grains is found in
the Angstrom range; this is consistent with the surface of the YV3 nanoparticles appearing
smoother by TEM. Sample Mean radius of gyration / equivalent diameter (nm) Mean primary grain diameter (nm) Ds YV2 16 / 41 1.9 2.65 YV3 32 / 80 0.1 2.84 YV2C 27 / 69 2.5 2.57 YV3C 23 / 58 2.4 2.74
Table 3. Summary of the physical parameters extracted after model fitting
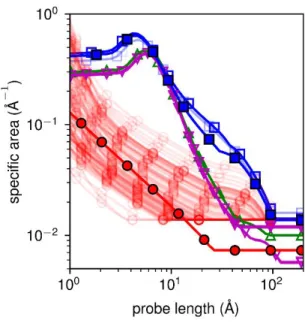
Furthermore, we unveil how the effective specific area of the nanoparticles vary with the probe
size (Eq. 5-6, Figure 6). As expected, the accessible surface area per particle decreases as the
length of the probe decreases. The nanometer-sized primary grains increase the surface area by
20
YV2, YV2C and YV3C particles present surface to volume ratio c.a. 10 times as high as the
YV3 particles at probe lengths below the nanometer range, and tend to become equal above.
Figure 6. Surface area accessible to a probe of given size, per volume unit of nanoparticle. Blue
squares: YV2; red circles: YV3; green upward triangles: YV2C; and magenta downwards
triangles: YV3C. For YV2 and YV3, SAXS datasets from experiments carried out at
SOLEIL/Swing (full symbols) and ESRD/ID02 (hollow symbols) have been used. For the YV3
dataset at ESRF (hollow red circles), the superimposition of graphs represents the confidence
intervals. For all other datasets, the confidence interval is within the thickness of the line.
In summary, comparison of the XRD, TEM images and SAXS patterns support directly that
the low-pH and carbonated syntheses yield dense and rough particles made by aggregation of
primary grains (YV2, YV2C and YV3C). The YV3 particles appear smoother at the
nanometer-scale with a coherence domain across the whole particle, but also present a high specific area at
the Angstrom scale. The low-pH and carbonated samples (YV2, YV2C, YV3C) can be seen as
21
domains which sizes correspond to coherence lengths shown on Table 2; on the other hand, in
the particles made at high pH (YV3), the number of primary grains is below the detection limit
of both TEM and the SAXS modelling, and the coherence domain propagate across the whole
particle; but the large residual interfacial area stems from residuals defects remaining at the
surface after the growth of the crystal domain.
The origin of these microstructures has to be found in the mechanism of the particles’
formation. Previous results [18] obtained starting form an orthovanadate precursor showed that
particles are formed through the crystallization of an amorphous hydroxylated phase. The
difference of microstructure observed in the present work, especially considering the YV3
particles, is expected to arise from a difference in the kinetic of the crystallization process, which
is found to be much slower when increasing the number of hydroxyl equivalent as compared to
the metavanadate precursor. Nevertheless, another possible reason could be that a common
mechanism of particles formation leads to particles formed by the aggregation of primary
particles and further evolve through an intra-particulate Oswald ripening. For some reasons, the
kinetics of the reconstruction would be enhanced in the case of the YV3 particles leading to their
complete recrystallization into monocrystals. In this alternative scenario, the YV2 particles could
be seen as intermediate states of YV3 particles during an ageing process of reconstruction.
Investigations are under way to apply the methodology of SAXS/WAXS characterization
developed in the present work for the characterization of the intermediate states during the
particles’ formation.
22
This work aimed in revisiting the synthesis by aqueous co-precipitation of YVO4:Eu
nanoparticles . The first objective was to determine the experimental conditions allowing to have
a controlled and reproducible particles microstructure. The second objective was to precisely
characterize the particle internal microstructure. Starting from observations of the poor
reproducibility of previously reported syntheses, we focused on the precipitation using a
metavanadate precursor combined with a controlled amount of base (NaOH) and sodium
carbonates. This was shown to drastically affect the particles’ surface while maintaining a size of
approximatively 50 to 80 nm. In addition to conventional techniques (TEM, XRD), particles
were fully characterized using SAXS-WAXS and a suitable methodology of data analysis to
provide an accurate description of the particles’ structure. Particles obtained using 3 equivalents
of NaOH (YV3) were clearly different from other samples since they appeared as facetted and
almost monocrystalline. Other particles, obtained with lower amount of base or with addition of
carbonates, appear to be dense and polycrystalline, well described using a surface fractal
description. These particles appear as resulting from the ageing of aggregates of
nanometer-scaled primary grains. Further work will be devoted to the understanding of the origin of the
observed microstructures by considering the mechanism of the particle formation that occurs
from an amorphous to crystalline phase transition. This will be done by analyzing the evolution
of the particles’ formation and ageing through in situ monitoring of their structure. Another
perspective of this work is the investigation of the influence of the particles microstructure on
their properties, especially considering their emission properties and their sensitivity when being
23 ,
AUTHOR INFORMATION Corresponding Authors
*Thierry Gacoin – thierry.gacoin@polytechnique.edu
*David Carrière – david.carriere@cea.fr
Present Addresses
† Département NuMa, Agence Nationale de la Recherche, 50 avenue Daumesnil, 75012 Paris
# Laboratoire de Génie Chimique, Université de Toulouse, CNRS, INPT, UPS, Toulouse, France
Author Contributions
§ These authors contributed equally
The manuscript was written through contributions of all authors. All authors have given approval
to the final version of the manuscript.
Funding Sources
The authors acknowledge the ESRF synchrotron for beamtime. All authors acknowledge a public
grant overseen by the French National Research Agency (ANR), project DIAMONS
ANR-14-CE08-0003. RKR acknowledges support by ANR as part of the “Investissements d’Avenir”
24
ACKNOWLEDGMENT
The authors wish to thank Blaise Fleury for fruitful discussions and preliminary results.
ASSOCIATED CONTENT
Supporting Information for publication.
25
REFERENCES
[1] Blasse, G.; Grabmeier, B. C. Luminescent Materials; Springer-Verlag: Berlin, 1994.
[2] Ropp, R. C. Luminescence and the Solid State; Elsevier: Amsterdam, 1991.
[3] Riwotzki, K.; Haase, M. Wet-Chemical Synthesis of Doped Colloidal Nanoparticles:
YVO4:Ln (Ln = Eu, Sm, Dy). J. Phys. Chem. B 1998, 102, 10129-10135.
[4] Huignard, A.; Gacoin, T.; Boilot, J.-P. Synthesis and Luminescence Properties of Colloidal
YVO4:Eu Phosphors. Chem. Mat. 2000, 12, 1090-1094.
[5] Yu, M.; Lin, J.; Wang, Z.; Fu, J.; Wang, S.; Zhang, H.J.; Han, Y.C. Fabrication, patterning,
and optical properties of nanocrystalline YVO4 : A (A = Eu3+, Dy3+, Sm3+, Er3+) phosphor films
via sol-gel soft lithography. Chem. Mat. 2002, 14(5), 2224-2231.
[6] Dantelle, G.; Fleury, B.; Boilot J.-P.; Gacoin, T. How to Prepare the Brightest Luminescent
Coatings? Acs Appl. Mat. & Interf. 2013, 5(21), 11315-11320.
[7] Bouzigues, C.; Gacoin, T.; Alexandrou, A. Biological Applications of Rare-Earth Based
Nanoparticles. ACS Nano, 2011, 5(11), 8488–8505.
[8] Shen, J.; Sun, L.-D.; Zhu, J.-D.; Wei, L.-H.; Sun, H.-F.; Yan, C.-H. Biocompatible Bright
YVO4:Eu Nanoparticles as Versatile Optical Bioprobes. Adv. Funct. Mat. 2010, 20, 3708-3714.
[9] Duée, N. ; Ambard, C.; Pereira, F. ; Portehault, D. ; Viana, B. ; Vallé, K. ; Autissier, D. ;
Sanchez, C. New Synthesis Strategies for Luminescent YVO4:Eu and EuVO4 Nanoparticles with
26
[10] Abdesselem, M.; Schoeffel, M.; Maurin, I.; Ramodiharilafy, R.; Autret, G.; Clément, O.;
Tharaux, P.-L.; Boilot, J.-P.; Gacoin, T.; Bouzigues, C.; Alexandrou, A. Multifunctional
Rare-Earth Vanadate Nanoparticles: Luminescent Labels, Oxidant Sensors, and MRI Contrast Agents.
ACS Nano 2014, 8 (11), 11126–11137.
[11] Mialon, G.; Turkcan, S.; Alexandrou, A.; Gacoin, T.; Boilot, J.-P. New Insights into Size
Effects in Luminescent Oxide Nanocrystals. J. Phys. Chem. C, 2009, 113, 18699-18706.
[12] Maurin, I.; Dantelle, G.; Boilot, J.-P. Gacoin, T. A protected annealing process for the
production of high quality colloidal oxide nanoparticles with optimized physical properties. J.
Mater. Chem. C, 2013, 1, 13-22.
[13] Wu, H.; Xu, H.; Su, Q.; Chen, T.; Wu, M. Size- and shape-tailored hydrothermal synthesis
of YVO4 crystals in ultra-wide pH range conditions. J. Mat. Chem. 2003, 13, 1223-1228.
[14] Wu, X.; Tao, Y.; Song, C.; Mao, C.; Dong, L.; Zhu, J. Morphological Control and
Luminescent Properties of YVO4:Eu Nanocrystals. J. Phys. Chem. B 2006, 11, 15791-15796.
[15] Ray, S.; Banerjee, A.; Pramanik, P. A novel rock-like nanoarchitecture of YVO4:Eu3+
phosphor: selective synthesis, characterization, and luminescence behavior. J. Mater. Sci. 2010,
45, 259–267.
[16] Xu, Z.; Kang, X.; Li, C.; Hou, Z.; Zhang, C.; Yang, D.; Li, G.; Lin, J. Ln3þ (Ln = Eu, Dy,
Sm, and Er) Ion-Doped YVO4 Nano/Microcrystals with Multiform Morphologies: Hydrothermal
Synthesis, Growing Mechanism, and Luminescent Properties. Inorg. Chem. 2010, 49, 6706–
27
[17] Yang, E.; Li, G.; Zheng, J.; Fu, C.; Zheng, .;Li, L. Kinetic Control over YVO4:Eu3+
Nanoparticles for Tailored Structure and Luminescence Properties. J. Phys. Chem. C 2014, 118,
3820−3827.
[18] Fleury, B.; Neouze, M.-A.; Guigner, J.-M.; Menguy, N.; Spalla, O.; Gacoin, T.; Carriere,
D.; Amorphous to Crystal Conversion as a Mechanism Governing the Structure of Luminescent
YVO4:Eu Nanoparticles ACS Nano 2014, 8, 2602-2608.
[19] Narayanan, T.; Sztucki, M.; Van Vaerenbergh, P.; Léonardon, J.; Gorini, J.; Claustre, L.;
Sever, F.; Morse, J.; Boesecke, P. A Multipurpose Instrument for Time-Resolved
Ultra-Small-Angle and Coherent X-Ray Scattering. J Appl Crystallogr 2018, 51 (6), 1511–1524.
[20] David, G. ; Pérez, J. Combined sampler robot and high-performance liquid chromatography:
a fully automated system for biological small-angle X-ray scattering experiments at the
Synchrotron SOLEIL SWING beamline. J. Appl. Crystallogr. 2009, 42, 892–900.
[21] Bollen, K. A. & Long, J. S. Testing Structural Equation Models. (SAGE, 1993)
[22] Baes, C.F.; Mesmer, R. S. The Hydrolysis of Cations. John Wiley & Sons: New York,
London, Sydney, Toronto 1976, pp. 210, 411.
[23] Jolivet, J.-P. ; Henry, M.; Livage, J. De la solution à l’oxyde: Condensation des cations en
solution aqueuse, chimie de surface des oxydes. InterEditions : Paris 1994.
[24] Chakoumakos, B. C.; Abraham, M. M.; Boatner, L. A. Crystal structure refinements of
zircon-type MVO4 (M= Sc, Y, Ce, Pr, Nd, Tb, Ho, Er, Tm, Yb, Lu) J. Solid State Chem. 1994,
28
[25] Halder, N. C.; Wagner, C. N. J. Advances in X-Ray Analysis ; Springer, Boston, MA,
1966; pp 91-102.
[26] Halder N. C.; Wagner C. N. J. Separation of Particle Size and Lattice Strain
in Integral Breadth Measurements, Acta Crystallogr. 1966, 20, 312-313.
[27] Lutterotti, L.; Scardi, P. Simultaneous Structure and Size–Strain Refinement by the
Rietveld Method. J. Appl. Crystallogr. 1990, 23, 246-252.
[28] Baglio, J. A.; Gashurov, G. A refinement of the crystal structure of yttrium vanadate. Acta
Cryst. 1968, B24, 292-293.
[29] Errandonea, D.; Lacomba-Perales, R.; Ruiz-Fuertes, J.; Segura, A.; Achary, S. N.; Tyagi
A. K. High-pressure structural investigation of several zircon-type orthovanadates Phys. Rev. B
2009, 79, 184104.
[30] Sen, D.; Spalla, O.; Belloni, L.; Charpentier, T.; Thill, A. Temperature Effects on the
Composition and Microstructure of Spray-Dried Nanocomposite Powders. Langmuir 2006, 22,
3798–3806.
[31] Beaucage, G. Small-angle scattering from polymeric mass fractals of arbitrary mass-fractal
dimension. Journal of Applied Crystallography 29, 134–146 (1996).
[32] Fleury, B.; Cortes-Huerto R.; Taché O.; Testard F.; Menguy N.; Spalla O. Gold
Nanoparticle Internal Structure and Symmetry Probed by Unified Small-Angle X-ray Scattering
and X-ray Diffraction Coupled with Molecular Dynamics Analysis. Nano Lett. 2015, 15, 6088–
29
[33] Wong, P. -Z.; Bray, A. J. Small-angle scattering by rough and fractal surfaces. J. Appl.
Crystallogr. 1988, 21, 786–794.
[34] Besselink, R.; Stawski, T. M.; Van Driessche, A. E. S.; Benning, L. G. Not Just Fractal
Surfaces, but Surface Fractal Aggregates: Derivation of the Expression for the Structure Factor
and Its Applications J. Chem. Phys. 2016, 145 (21), 211908.
SYNOPSIS (Word Style “SN_Synopsis_TOC”). If you are submitting your paper to a journal