HAL Id: hal-00295451
https://hal.archives-ouvertes.fr/hal-00295451
Submitted on 21 Jun 2004
HAL is a multi-disciplinary open access
archive for the deposit and dissemination of
sci-entific research documents, whether they are
pub-lished or not. The documents may come from
teaching and research institutions in France or
abroad, or from public or private research centers.
L’archive ouverte pluridisciplinaire HAL, est
destinée au dépôt et à la diffusion de documents
scientifiques de niveau recherche, publiés ou non,
émanant des établissements d’enseignement et de
recherche français ou étrangers, des laboratoires
publics ou privés.
Influence of stratospheric airmasses on tropospheric
vertical O3 columns based on GOME (Global Ozone
Monitoring Experiment) measurements and
backtrajectory calculation over the Pacific
A. Ladstätter-Weißenmayer, J. Meyer-Arnek, A. Schlemm, J. P. Burrows
To cite this version:
A. Ladstätter-Weißenmayer, J. Meyer-Arnek, A. Schlemm, J. P. Burrows. Influence of stratospheric
airmasses on tropospheric vertical O3 columns based on GOME (Global Ozone Monitoring
Exper-iment) measurements and backtrajectory calculation over the Pacific. Atmospheric Chemistry and
Physics, European Geosciences Union, 2004, 4 (4), pp.903-909. �hal-00295451�
www.atmos-chem-phys.org/acp/4/903/
SRef-ID: 1680-7324/acp/2004-4-903
Chemistry
and Physics
Influence of stratospheric airmasses on tropospheric vertical O
3
columns based on GOME (Global Ozone Monitoring Experiment)
measurements and backtrajectory calculation over the Pacific
A. Ladst¨atter-Weißenmayer, J. Meyer-Arnek, A. Schlemm, and J. P. Burrows
Institute of Environmental Physics, University of Bremen, P.O. Box 330440, D-28334 Bremen, Germany Received: 21 January 2004 – Published in Atmos. Chem. Phys. Discuss.: 19 March 2004
Revised: 15 June 2004 – Accepted: 17 June 2004 – Published: 21 June 2004
Abstract. Satellite based GOME (Global Ozone
Measur-ing experiment) data are used to characterize the amount of tropospheric ozone over the tropical Pacific. Tropo-spheric ozone was determined from GOME data using the Tropospheric Excess Method (TEM). In the tropical Pa-cific a significant seasonal variation is detected. Tro-pospheric excess ozone is enhanced during the biomass burning season from September to November due to out-flow from the continents. In September 1999 GOME data reveal an episode of increased excess ozone columns over Tahiti (18.0◦S; 149.0◦W) (Eastern Pacific) compared to Am. Samoa (14.23◦S; 170.56◦W) and Fiji (18.13◦S; 178.40◦E), both situated in the Western Pacific. Backtra-jectory calculations show that none of the airmasses arriving over the three locations experienced anthropogenic pollution (e. g. biomass burning). Consequently other sources of ozone have to be considered. One possible process leading to an increase of tropospheric ozone is stratosphere-troposphere-exchange. An analysis of the potential vorticity along tra-jectories arriving above each of the locations reveals that airmasses at Tahiti are subject to enhanced stratospheric in-fluence, compared to Am. Samoa and Fiji. As a result this study shows clear incidents of transport of airmasses from the stratosphere into the troposphere.
1 Introduction
The tropical Pacific is often considered to be a region re-mote from major polluting influences because of its isolation from industrialized landmasses. However, the signature of pollution, particulary from biomass burning, makes a sig-nificant imprint on the air chemistry of the region (Singh et al., 2000), (Thompson et al., 2003). 7 years of GOME
Correspondence to: A. Ladst¨atter-Weißenmayer
data were analysed with respect to tropical tropospheric ex-cess O3. The tropospheric excess ozone is the difference
be-tween the total amount of tropospheric ozone and its tropo-spheric background. The tropotropo-spheric excess ozone is glob-ally derived from GOME data by applying the Tropospheric Excess Method (TEM) (Fishman et al., 1990). Another method to derive tropospheric O3columns from the
measure-ments of a nadir-looking instrument is the Convective-Cloud-Differential (CCD) method which is discussed by (Valks et al., 2003) and (Ziemke et al., 1998).
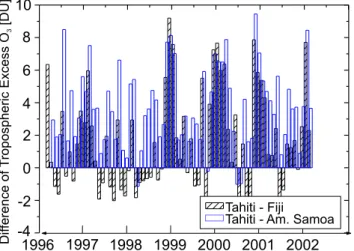
The differences of monthly mean tropospheric excess O3
between Tahiti and Fiji as well as Tahiti and Am. Samoa reveal frequently enhanced values at Tahiti for all years of GOME measurements (see Fig. 1). Similar observations of enhanced tropospheric O3 values over Tahiti compared to
Fiji and Am. Samoa can be seen by analysing O3-sonde
data (Oltmans et al., 2001). Figure 2 shows the timeseries of GOME tropospheric excess ozone for the three locations for one epsiode. At Tahiti (18.0◦S; 149.0◦W) the tropo-spheric excess ozone peaks at 12DU whereas at Am. Samoa (14.23◦S; 170.56◦W) and Fiji (18.13◦S; 178.40◦E) 3DU are not exceeded. The main objective of this case study is the analysis of one episode of enhanced tropospheric ex-cess ozone at Tahiti which took place in September 1999. The question arises which processes may lead to such dif-ferences in tropospheric excess ozone between the Western (Am. Samoa and Fiji) and the Eastern Pacific (Tahiti).
Therefore in this case study an analysis of backtrajecto-ries was carried out in order to analyse whether the probed airmasses were either influenced by processes taking place in the troposphere only (e. g. biomass burning) or by irre-versible stratosphere-troposphere-exchange as for example discussed by Waugh et al. (2000) and Randriambelo et al. (1999). Backtrajectory analysis has become a widely used method for the interpretation of trace gas measurements in relation to large scale airmass transport (Moody et al., 1995).
904 A. Ladst¨atter-Weißenmayer, J. Meyer-Arnek: Stratospheric influence on O3columns over the Pacific region 1996 1997 1998 1999 2000 2001 2002 Dif ference of T ropospheric Excess O [DU] 3 10 8 6 4 2 0 -2 -4 Tahiti - Fiji Tahiti - Am. Samoa
Fig. 1. Calculated differences of monthly mean values for tropo-spheric excess column amounts between Tahiti and Am. Samao as well as between Tahiti and Fiji for 1996–2002.
T ropospheric Excess O [DU] 3 0 2 4 6 8 10 12
Sep. 1, 1999 Sep. 15, 1999 Sep. 30, 1999 Fiji
Am. Samoa Tahiti
Fig. 2. Time series of the tropospheric excess column of ozone between 1 September to 30 September 1999 for the locations Am. Samoa, Fiji and Tahiti.
2 Methods and results
2.1 GOME
GOME was launched in April 1995 onboard the second Eu-ropean satellite ERS-2 in a sun-synchronous near polar orbit for measuring the sunlight scattered from Earth’s atmosphere and/or reflected by the surface in nadir mode in a wavelength region of 240 to 790nm with a spectral resolution of 0.2– 0.4nm. Once per day, the extraterrestrial solar irradiance is measured and can be used as an absorption free background in the data analysis carried out using the Differential Op-tical Absorption Spectroscopy (DOAS) technique (Burrows et al., 1999), (Platt, 1994). The main scientific objective is to measure the global distribution of O3and several trace gases
which play an important role in the ozone chemistry of the
earth’s stratosphere and troposphere (Burrows et al., 1999). The local equator crossing time is 10:30 a.m. With 14 orbits per day global coverage at the equator is reached after three days for a 960km swath width (the size of one GOME ground pixel is 40×320km2) (Burrows et al., 1999).
For this study GOME level-2-data (GOME products are computed from level-0 (raw) data using the GOME Data Pro-cessor (GDP) system which was designed and developed by the German Remote Sensing Data Center (DFD)) were ex-tracted with a maximum distance of 200km away from the location of interest to derive vertical columns of O3 in the
325.5 to 334.5nm wavelength region. The details on the analysis are given elsewhere (Ladst¨atter-Weißenmayer et al., 1998), (Richter et al., 2002) and are not repeated here.
As GOME is a nadir viewing instrument, both tropo-spheric and stratotropo-spheric absorptions contribute to the mea-sured signal. The stratospheric O3 column is dominated
compared to the tropospheric amount. Therefore, the Tropo-spheric Excess Method (TEM) (Fishman et al., 1990), (Leue et al., 2001), (Richter et al., 2002) was used to derive the tro-pospheric excess colunms of O3. This method is based on
the assumption that stratospheric O3does not vary zonally,
and therefore the total colunms measured on the same day at the same latitude over a clean air region can be used as an approximation of the stratopheric column over the region of interest. Here, data from Atlantic region (315–325◦E) were used as reference section. The overall analysis then consists of three steps: (a) determination of the total slant column, (b) subtraction of the stratospheric contribution including the tropospheric background yielding the tropospheric excess slant column and (c) division by the airmass factor (AMF) to obtain the vertical tropospheric excess column (Rozanov et al., 1997).
There are general limitations using this method which in-troduce some uncertainty into the results. A number of as-sumptions have to be made for the calculation of the air-mass factors which also contribute to the overall error of the GOME measurements. The main error sources are the inhomogeneities in the stratospheric O3 field, uncertainties
in cloud cover, the assumed vertical profile of O3, the
sur-face albedo and the aerosol loading which are required in calculating the AMF as described elsewhere (Richter et al., 2002). The overall error of the analysis is estimated to be in the order of 4DU. This is based on the comparison of a large number of Southern Hemisphere Additional Ozoneson-des (SHADOZ) measurements with ozone columns derived from GOME. The uncertainty of 4DU influences the total column amount of O3for the GOME data over all three
loca-tions similarly. That means differences in the results can be considered as relative deviations.
For this study the excess vertical columns of O3based on
GOME data for September 1999 with a cloud cover of less than 10% (due to GOME ICFA cloud algorithm) were anal-ysed (see Figs. 1 and 2) for the Pacific region. The time series of the excess vertical columns of O3in DU (Dobson Units)
are shown in Fig. 2 for Tahiti, Am. Samoa and Fiji. Tropo-spheric excess vertical columns over Tahiti of up to 12DU were measured whereas over Fiji and American Samoa the values are close to zero (between 0 and 3DU). Similar results that means more variability of the O3-profile can be seen over
Tahiti compared to Am. Samoa and Fiji using the ozone son-des measurements, as son-described elsewhere (Oltmans et al., 2001). To determine whether anthropogenic emissions or stratospheric influence may explain differences of the ozone columns between the three locations, backtrajectory calcula-tions using the trajectory model Traj.x (Meyer-Arnek, 2002), (Meyer-Arnek, 2003) were performed.
2.2 Backtrajectory analysis and discussion
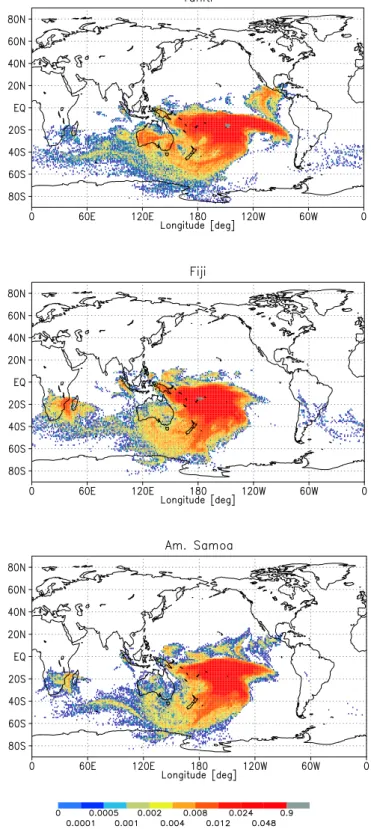
To assess the differences in the excess tropospheric ozone over Am. Samoa, Fiji and Tahiti backtrajectories were cal-culated. Over each of the locations individual clusters of backtrajectories were started every six hours (at 0:00 UT, 6:00 UT, 12:00 UT and 18:00 UT) during September 1999 at ten different heights (900, 800, 700, 600, 500, 400, 300, 200, 150 and 100hPa) covering the troposphere and tropi-cal tropopause region. All trajectories traveled backwards in time for 10 days. Altogether 145 000 trajectories were cal-culated by Traj.x for each site. Traj.x is a trajectory model developed at the Institute of Environmental Physics, Univer-sity of Bremen. It is a kinematic trajectory model which calculates the transport of airparcels due to meteorological wind fields by applying a fourth-order Runge-Kutta scheme. Meteorological data were derived from European Centre for Medium-Range Weather Forecasts (ECMWF)’s 40-year’s re-analysis data set (ERA-40). These data are available on 60 model levels at four times a day (at 0:00 UT, 6:00 UT, 12:00 UT, 18:00 UT). The analysis of all trajectories arriving over each of the three locations reveals that anthropogenic emissions can not be responsible for the differences in tro-pospheric ozone between the three Pacific locations. Any continental emission (for example from biomass burning) af-fects all locations nearly equally. This is proven by Fig. 3. It depicts the trajectory density of trajectories arriving over the three locations Tahiti, Fiji and Am. Samoa while residing in the planetary boundary layer (PBL).
The trajectory density is derived by projecting all trajec-tories residing in the lowest 2km (which is assumed to rep-resent the PBL) onto a 1.125◦ latitude-longitude grid. As-suming that airmasses are only influenced by anthropogenic processes taking place on the earth’s surface while residing within the PBL and assuming that no major anthropogenic emission takes place on the ocean there must be another source of tropospheric ozone. The advection of stratospheric airmasses with high ozone loading into the troposphere may increase the amount of tropospheric ozone (Galani et al., 2003).
In order to probe whether stratospheric airmasses enter the troposphere the potential vorticity (PV) criteria was applied.
Fig. 3. Density of trajectories arriving above Tahiti, Fiji and Am. Samoa during September 1999 while residing in the plane-tary boundary layer. For each of the three locations, this quantity is normalised to one.
906 A. Ladst¨atter-Weißenmayer, J. Meyer-Arnek: Stratospheric influence on O3columns over the Pacific region Lightning Maritime Maritime Lightning Maritime Tahiti Am. Samoa Fiji p [hP a] 100 200 400 600 800 100 200 400 600 800 [%] 0 20 40 60 80 100 0 2 4 6 8 10 p [hP a] [%]
c)
a)
b)
d)
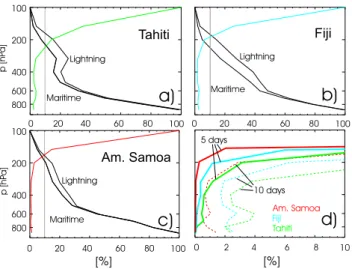
Tahiti Fiji Am. Samoa 0 20 40 60 80 100 0 20 40 60 80 100 10 days 5 days LightningFig. 4. Altitude dependent influence of stratospheric and tropo-spheric airmasses arriving over Tahiti, Am. Samoa and Fiji. For further information, see the text. In panel (d) the percentage scale is enlarged to underline the differences of the stratospheric influ-ence in the mid and lower troposphere between the three locations. Additionally the stratospheric influence on 5- and on 10-days back-trajectories is shown.
Whenever a trajectory at least once experienced a PV of more than 3.5 PV-units (PVU) this trajectory was assumed to be of stratospheric origin. The Figs. 4a–d show the altitude de-pendant fraction of stratospherically influenced trajectories arriving at each of the three locations. At each altitude a set of backtrajectories is released every 6 hours. Whenever the potential vorticity along a backtrajectory exceeds the thresh-old of 3.5PVU, the trajectory is assumed to be influenced by the stratosphere. In Figs. 4a–d the stratospheric influence of all trajectories arriving at each of the locations is expressed in percent. It is shown that 100% of all trajectories arriving at any of these locations at a height of 100hPa can be re-garded as stratospherically influenced. The amount of strato-spheric airmasses decays significantly at lower altitudes but at 600 hPa still 1 to 4% of all 10-day-trajectories got into contact with the stratosphere at least once.
In Fig. 4d the differences of the stratospheric influence on short term (5 day) and long term (10 days) backtrajectories arriving above the three locations are shown. Within the last 5 days no trajectories which were influenced by the strato-sphere got to the lower tropostrato-sphere (below 500hPa) above Am. Samoa. 0.25 respectively 0.5% of mid-tropospheric air-masses above Fiji and Tahiti were stratospheric within the re-cent 5 days. In general the stratospheric influence is highest above Tahiti and significantly lower for Fiji and Am. Samoa. Additionally the contact of backtrajectories with the boundary layer is evaluated to account for processes emit-ting trace gases on the ground. Whenever a trajectory gets into the boundary layer it is assumed to be influenced by the
380 360 340 320 300 -3.5 -3 -2 2 3 3.5 0 10 20 30 40 50 60 70 80 90 100 p [hP a] 500 200 300 400 600 700 800 900 100 1000 60S 50S 40S 30S 20S 10S EQ 10N 20N 30N 40N 50N 60N
Fig. 5. Zonal average for the Pacific region from 160 to 220◦E of relative humidity (color scale, given in percent), potential temper-ature (black lines, given in K) and potential vorticity (white lines, given in PVU) of September 1999. The relative humidity is de-noted by the colorscale, the potential temperature by the black lines and the potential vorticity by the white lines. The latter is shown for absolute values of 2, 3 and 3.5PVU which represent different tropopause height definitions. The meteorological data is derived from the 40-years reanalysis (ERA-40) of the European Centre for Medium Range Weather Forecasts (ECMWF).
”regime” on the ground. A ”regime” may be the ocean (this is called ”maritime”) or biomass burning. The biomass burning locations for September 1999 are derived from the Along the Track Scanning Radiometer (ATSR) which is also onboard the ERS-2 satellite (Arino, 1997). In Figs. 4a–c no trajecto-ries having experienced biomass burning are indicated. This underlines that biomass burning is of no significance for any of the three locations.
Lightning is a source of nitric oxide (NO) and therefore of nitrogen oxides (NOx) in the troposphere. NO itself
oxi-dizes to nitrogen dioxide (NO2). Therefore, for tropospheric
ozone, which is mainly produced by photolysis of NO2,
lightning should always be considered. Consequently back-trajectories getting into regions of high lightning activity are assumed to be influenced by lightning. The lightning dataset used for this evaluation is the Low Resolution Annual Clima-tology (LRAC) provided by the Global Hydrology Resource Center (GHRC) at the Global Hydrology and Climate Center, Huntsville, Alabama. It consists of 5 years of measurements derived from the Lightning Imaging Sensor (LIS) and of 5 years of data from the Optical Transient Detector (OTD). All measurements were merged together into an annual clima-tological dataset (Christian et al., 2003). For this study the September data of this dataset is applied. Figures 4a–c re-veals that the importance of lightning is nearly equal for all three locations (Tahiti, Fiji and Am. Samoa). Consequently
lightning can not be accountable for differences in the ozone loading.
How do airparcels manage to cross the tropopause? Fig-ure 5 denotes the zonally averaged (above the Pacific be-tween 160 and 220◦E) relative humidity (in percent), the po-tential temperature in Kelvin (solid black lines) and the abso-lute value of the potential vorticity in PVU (solid white lines) for September 1999. A dominant feature of this figure is cre-ated by the ascent of air at latitudes of 10◦N carrying humid-ity to high altitudes and the descent of air in the subtropics. Potential vorticity values of 2 to 3.5 and potential tempera-ture values in the range of 380 to 400K are denoted. The PV isolines shown in the graph represent different tropopause height definitions. As long as no diabatic process takes place airmasses are advected on layers of constant potential tem-perature. Lines of constant potential temperature (denoting the isentropic transport) and constant potential vorticity (de-noting the tropopause) intersect at latitudes of around 30◦
north and south. This implies that stratosphere-troposphere-exchange will mainly take place at those latitudes which is impressively underlined by Fig. 5.
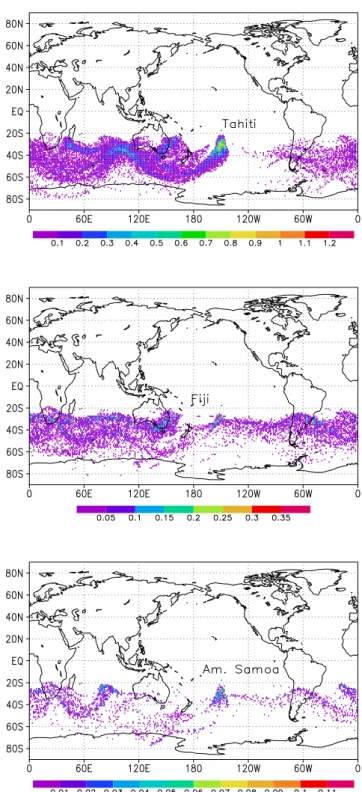
To account for the importance of stratospheric airmasses on the lower or mid troposphere only those trajectories ar-riving at heights between 800 and 500hPa over Tahiti, Fiji or Am. Samoa are considered. For this trajectory subset a quan-tity which is referred to as stratospheric trajectory density is derived by projecting all trajectories which currently expe-rience a potential vorticity of more than 3.5PVU indepen-dent of their current height onto a 1.125◦ latitude-longitude-grid on the ground. To better account for the importance of the stratospheric influence the resulting trajectory den-sity in Figs. 6a–c is multiplied with the total percentage of trajectories arriving at 800 to 500hPa (lower troposphere) above the specific location. Figure 6 reveals that trajectories leave the stratosphere at latitudes between 40 and 20 degrees south and dive irreversibly into the troposphere. Concern-ing the latitude range this is in good agreement with theories of stratosphere-troposphere-exchange. The stratospheric tra-jectory density is highest for the trajectories arriving in the Tahitian region.
The analysis of trajectories arriving above the three Pacific locations Am. Samoa, Fiji and Tahiti in September 1999 re-veals that all these locations were hardly (but nearly equally) influenced by continental outflow (see Fig. 3). Consequently no anthropogenic pollution event can account for the differ-ences of the tropospheric ozone loading over the three loca-tions derived from GOME measurements. For this reason stratosphere-troposphere-exchange is examined as a poten-tial ozone source of this particular episode. Trajectories ar-riving above each of the three locations are differently in-fluenced by the stratosphere. Airmasses above Tahiti in the Eastern Pacific where GOME data reveal enhanced tropo-spheric ozone columns are stronger influenced by the strato-sphere than those over Fiji and Am. Samoa in the Western Pacific (see Figs. 6a–c). Especially in the lower and mid
Fig. 6. Trajectory density (see its definition in the text) of trajec-tories arriving at Tahiti, Fiji and Am. Samoa at altitudes of 800 to 500 hPa in September 1999 while being in the stratosphere. It can clearly be seen that airmasses arriving at Tahiti are more sub-ject to stratospheric influence that trasub-jectories arriving at Fiji or Am. Samoa.
908 A. Ladst¨atter-Weißenmayer, J. Meyer-Arnek: Stratospheric influence on O3columns over the Pacific region
troposphere differences of the stratospheric influence (de-picted in Figs. 4a–d) between the three locations become ob-vious. As a result the stratospheric influence on airmasses over a certain location may be used as a qualitative indica-tor of such episodes. In the remote Pacific such events of stratosphere-troposphere-exchange transporting air with en-hanced ozone loading into the lower to mid troposphere can clearly be seen since no local or regional emissions con-tribute to the tropospheric ozone loading. Nevertheless a trajectory based analysis can only account for qualitative ef-fects. A quantitative analysis of episodes and their quanti-tative influence on troposperic ozone columns with this ap-proach is not possible.
3 Conclusions
Episodes of enhanced tropospheric ozone above Tahiti (East-ern Pacific) compared to Am. Samoa or Fiji (both West(East-ern Pacific) occur relatively often (see Fig. 1). This case study shows the influence of stratospheric airmasses on the tropo-spheric amounts of O3over the Eastern and Western Pacific
region. For this study tropospheric excess ozone was derived from GOME measurements. An increase of up to 12DU over Tahiti (Eastern Pacific) compared to Am. Samoa and Fiji (Western Pacific) was observed during an episode taking place in September 1999 (see Fig. 2). An analysis of backtra-jectories for the whole episode reveals that all three locations would have been impacted nearly equally by anthropogeni-cally induced continental outflow. For this reason the influ-ence of stratospheric airmasses on these locations was ex-amined. This analysis reveals that the lower and mid tropo-sphere (LT and MT) over Tahiti is much stronger influenced by stratospheric airmasses than the LT and MT above Fiji or Am. Samoa. The deduction of the stratospheric trajectory density considering backtrajectories arriving in the LT and MT over the three locations underlies that the stratospheric influence is most enhanced in the Tahitian region compared to Fiji or Am. Samoa. Since no major anthropogenic emis-sion of ozone precursors takes place in the remote Pacific in this case study the stratosphere-to-troposphere-exchange of airmasses can be identified as the significant source of en-hanced tropospheric ozone above the Eastern Pacific.
Acknowledgements. We want to thank B.-M. Sinnhuber and
A.-M. Schmoltner for the fruitful discussions and ECMWF for providing meteorological data. Parts of this work have been funded by the University of Bremen, Germany, the DLR/DARA, the European Community, the European Space Agency (ESA) and the German Ministry of Education and Research BMBF under grant 07UFE12/8.
Edited by: M. Dameris
References
Arino, O., Melinotte, J.-M., Rosaz, J. M., and Monjoux, E.: ESA Fire Product, Proceedings of the 7th ISPRS conference on Physi-cal Measurement and Signatures in Remote Sensing, Courchevel, 1997.
Burrows, J. P., Weber, M., Buchwitz, M., Rozanov, V. V., Ladst¨atter-Weissenmayer, A., Richter, A., de Beek, R., Hoogen, R., Bramstedt, K., Eichmann, K.-U., Eisinger, M., and Perner, D.: The Global Ozone Monitoring Experiment (GOME): Mis-sion Concept and First Scientific Results, J. Atm. Sciences, 56, 151–175, 1999.
Hugh, C. J., Blakeslee, R. J., Boccippio, D. J., Boeck, W. L., Buech-ler, D. E., Driscoll, K. T., Goodman, S. J., Hall, J. M., Koshak, W. J., Mach, D. M., and Stewart, M. F.: Global frequency and distribution of lightning as observed by the Optical Transient Detector, J. Geophys. Res., 108, doi: 10.1029/2002JD002347, 2003.
Fishman, J., Watson, C. E., Larsen, J. C., and Logan, J. A.: The distribution of tropospheric ozone determined from satellite data, J. Geophys. Res., 95, 3599–3617, 1990.
Galani, E., Balis, D., Zanis, P., Zerefos, C., Papayannis, A., Wernli, H., and Gerasopoulos, E.: Observations of stratosphere-to-troposphere transport events over the Mediterranean us-ing a ground-based lidar system, J. Geophys. Res., 108, doi:10.1029/2002JD002596, 2003.
Ladst¨atter-Weissenmayer, A., Burrows, J. P., and Perner, D.: Biomass burning over Indonesia as observed by GOME, Earth Obs. Quart. 58, 28–29, 1998.
Leue, C., Wenig, M., Wagner, T., Platt, U., and J¨ahne, B.: Quan-titative analysis of NOxemissions from GOME satellite image sequences, J. Geophys. Res., 106, 5493–5505, 2001.
Meyer-Arnek, J.: Numerical validation, manual and userguide for Traj.x, iup-Bremen, 2002.
Meyer-Arnek, J.: Qualitative und quantitative Analyse einer Episode erh¨ohter Spurengass¨aulen im September 1997, PhD Thesis, 2003.
Moody, J., Oltmans, S., Levy II, H., and Mertill, J.: Transport cli-matology of tropospheric ozone: Bermuda, 1988–1991, J. Geo-phys. Res., 100, 7179–7191, 1995.
Oltmans, S. J., Johnson, B. J., Harris, J. M., V¨omel, H., Thomp-son, A. M., Koshy, K., Simon, P., Bendura, R. J., Logan, J. A., Hasebe, A., Shiotani, M., Kirchoff, V. W. J. H., Maata, M., Ami, G., Samad, A., Tabuadravu, J., Enriquez, H., Agama, M., Ko-rnejo, J., and Paredes, F.: Ozone in the Pacific tropical tropo-sphere from ozonesonde observations, J. Geophys. Res., 106, 32 503–32 525, 2001.
Platt, U.: Differential optical absorption spectroscopy (DOAS), in: Air Monitoring by Spectroscopic Techniques, M. W. Sigrist, John Wiley & Sons, Inc., 1994.
Randriambelo, T., Baray, J. L., Baldy, S., Bremaud, P., Cautenet, S.: A case study of extreme tropospheric ozone contamination in the tropics using in-situ, satellite and meteorological data, Geophys. Res. Lett., 26, 1287–1290, 1999.
Richter, A. and Burrows, J. P.: Retrieval of tropospheric NO2 from GOME measurements, Adv. Space Res., 29 (11), 1673–1683, 2002.
Rozanov, V., Diebel, D., Spurr, R. J., and Burrows, J. P.: GOME-TRAN: A radiative transfer model for the satellite project GOME – the plane parallel version, J. Geophys. Res., 102, 16 683– 16 695, 1997.
Singh, H. B., Viezee, W., Chen, Y., Bradshaw, J., Sandholm, S., Blake, D., Blake, N., Heikes, B., Snow, J., Talbot, R., Brow-ell, E., Gregory, G., Sachse, G., and Vay, S.: Biomass burning influences on the composition of the remote South Pacific tro-posphere: Analysis based on observations from PEM-Tropics-A, Atmos. Environ., 34, 635–644, 2000.
Thompson, A. M., Witte, J. C., McPeters, R. D., Oltmans, S. J., Schmidlin, F. J., Logan, J. A., Fujiwara, M., Kirch-hoff, V. W. J. H., Posny, F., Coetzee, G. J. R., Hoegger, B., Kawakami, S., Ogawa, T., Johnson, B. J., V¨omel, H., and Labow, G.: Southern Hemisphere Additional Ozoneson-des (SHADOZ) 1998–2000 tropical ozone climatology. 1. Com-parison with Total Ozone Mapping Spectrometer (TOMS) and ground-based measurements, J. Geophys. Res., 108, art. no. 8238, doi:10.1029/2002JD002241, 2003.
Valks, P. J. M., Koelemeijer, R. B. A., van Weele, M., van Velthoven, P., Fortuin, J. P. F., Kelder, H.: Variability in tropi-cal tropospheric ozone: Analysis with Global Ozone Monitoring Experiment observations and a global model, J. Geophys. Res., 108, art. no. 4328, doi:10.1029/2002JD002, 2003.
Waugh, D. W. and Polvani, L. M.: Climatology of intrusions into the tropical upper troposphere Geophys. Res. Lett., 27, 3857– 3860, 2000.
Ziemke, J. R., Chandra, S., Bhartia, P. K.: Two new methods for deriving tropospheric column ozone from TOMS measurements: Assimilated UARS MLS/HALOE and convective-cloud differ-ential techniques, J. Geophys. Res., 103, 22 115–22 127, 1998