HAL Id: hal-00296281
https://hal.archives-ouvertes.fr/hal-00296281
Submitted on 6 Jul 2007
HAL is a multi-disciplinary open access
archive for the deposit and dissemination of
sci-entific research documents, whether they are
pub-lished or not. The documents may come from
teaching and research institutions in France or
abroad, or from public or private research centers.
L’archive ouverte pluridisciplinaire HAL, est
destinée au dépôt et à la diffusion de documents
scientifiques de niveau recherche, publiés ou non,
émanant des établissements d’enseignement et de
recherche français ou étrangers, des laboratoires
publics ou privés.
Impact of using different ozone cross sections on ozone
profile retrievals from Global Ozone Monitoring
Experiment (GOME) ultraviolet measurements
X. Liu, K. Chance, C. E. Sioris, T. P. Kurosu
To cite this version:
X. Liu, K. Chance, C. E. Sioris, T. P. Kurosu. Impact of using different ozone cross sections on
ozone profile retrievals from Global Ozone Monitoring Experiment (GOME) ultraviolet measurements.
Atmospheric Chemistry and Physics, European Geosciences Union, 2007, 7 (13), pp.3571-3578.
�hal-00296281�
© Author(s) 2007. This work is licensed under a Creative Commons License.
Chemistry
and Physics
Impact of using different ozone cross sections on ozone profile
retrievals from Global Ozone Monitoring Experiment (GOME)
ultraviolet measurements
X. Liu1,2, K. Chance1, C. E. Sioris1,3, and T. P. Kurosu1
1Atomic and Molecular Physics Division, Harvard-Smithsonian Center for Astrophysics, Cambridge, MA, USA 2Goddard Earth Sciences and Technology Center, University of Maryland Baltimore County, Baltimore, MD, USA 3Atmospheric Science and Technology Directorate, Environment Canada, Toronto, ON, Canada
Received: 25 September 2006 – Published in Atmos. Chem. Phys. Discuss.: 19 January 2007 Revised: 19 June 2007 – Accepted: 28 June 2007 – Published: 6 July 2007
Abstract. We investigate the effect of using three
differ-ent cross section data sets on ozone profile retrievals from Global Ozone Monitoring Experiment (GOME) ultraviolet measurements (289–307 nm, 326–337 nm). These include Bass-Paur, Brion, and GOME flight model cross sections (references below). Using different cross sections can signif-icantly affect the retrievals, by up to 12 Dobson Units (DU, 1 DU=2.69×10¹⁶molecules cm−2)in total column ozone, up to 10 DU in tropospheric column ozone, and up to 100% in retrieved ozone values for individual atmospheric layers. Compared to using the Bass-Paur and GOME flight model cross sections, using the Brion cross sections not only re-duces fitting residuals by 15–60% in the Huggins bands, but also improves retrievals, especially in the troposphere, as seen from validation against ozonesonde measurements. Therefore, we recommend using the Brion cross section for ozone profile retrievals from ultraviolet measurements. The total column ozone retrieved using the GOME flight model cross sections is systematically lower, by 7–10 DU, than that retrieved using the Brion and Bass-Paur cross sections and is also systematically lower than Total Ozone Mapping Spec-trometer (TOMS) observations. This study demonstrates the need for improved ozone cross section measurements in the ultraviolet to improve profile retrievals of this key atmo-spheric constituent.
1 Introduction
Chance et al. (1997) demonstrated that ozone profile includ-ing tropospheric ozone can be derived from nadir-viewinclud-ing
ul-Correspondence to: X. Liu
(xliu@umbc.edu)
traviolet/visible radiance spectra utilizing the Hartley, Hug-gins and Chappuis ozone absorption bands. The photon penetration into the troposphere in the Huggins and Chap-puis bands and the temperature-dependent vibrational struc-tures in the Huggins bands provide information about tropo-spheric ozone. This idea has been applied to Global Ozone Monitoring Experiment (GOME) ultraviolet measurements by several groups (Munro et al., 1998; Hoogen et al., 1999; Hasekamp and Landgraf, 2001; van der A et al., 2002; Liu et al., 2005). However, it is important to fit the Huggins bands to a high precision (e.g., <0.1%) (Munro et al., 1998) for retrieving tropospheric ozone. In addition to extensive wavelength and radiometric calibrations and forward radia-tive transfer modeling (Liu et al., 2005), the quality of spec-troscopic ozone cross sections (CS) including the wavelength and absolute accuracy is critical to reducing fitting residuals and improving the quality of retrieved profiles, especially in the troposphere.
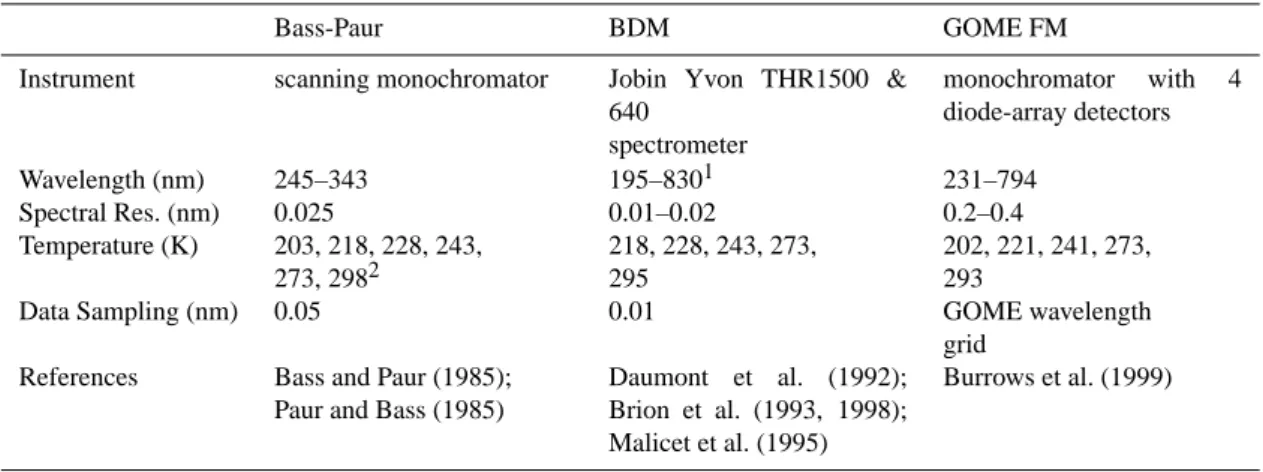
Orphal (2002, 2003) critically reviewed available ultravio-let ozone CS that cover a wide range of atmospheric tem-peratures. He found that three sets of ozone CS have an overall agreement of 1–2% after accounting for wavelength shifts, baseline effects, and spectral resolution. These in-clude: (1) Bass-Paur CS (Bass and Paur, 1985; Paur and Bass, 1985) (abbreviated as BP), (2) Brion CS (Daumont et al., 1992; Brion et al., 1993; Malicet et al., 1995) (abbrevi-ated as BDM), and (3) GOME flight model CS (Burrows et al., 1999) (abbreviated as GMFM). The BP and BDM CS are especially close, within 1% (Orphal, 2002). Table 1 summa-rizes the spectroscopic measurement characteristics of these CS (Orphal, 2002). The BP CS are widely used in the sci-entific community for total column ozone and ozone profile retrievals and are currently included in the HITRAN database
3572 X. Liu et al.: Impact of O3cross sections on O3profile retrievals
Table 1. Measurement characteristics of three laboratory ozone cross sections.
Bass-Paur BDM GOME FM
Instrument scanning monochromator Jobin Yvon THR1500 & 640 spectrometer monochromator with 4 diode-array detectors Wavelength (nm) 245–343 195–8301 231–794 Spectral Res. (nm) 0.025 0.01–0.02 0.2–0.4 Temperature (K) 203, 218, 228, 243, 273, 2982 218, 228, 243, 273, 295 202, 221, 241, 273, 293
Data Sampling (nm) 0.05 0.01 GOME wavelength
grid References Bass and Paur (1985);
Paur and Bass (1985)
Daumont et al. (1992); Brion et al. (1993, 1998); Malicet et al. (1995)
Burrows et al. (1999)
1300–345 nm at 273 K, 195–345 nm at 228 K, 243 K, and 273 K, 195–345 nm and 515–650 nm at 218 K. 2Quadratic coefficients at each wavelength.
(Rothman et al., 2005) as a standard, after applying a wave-length shift of +0.015 nm (Orphal and Chance, 2003). How-ever, they are noisier than the others (Orphal, 2002). The BDM CS are found to have better wavelength calibration than the BP data (Orphal, 2002). However, since they do not cover temperatures below 218 K, they are not included in the HITRAN database. To our knowledge, the BDM CS have not been used in remote sensing of ozone in the litera-ture except in our algorithm (Liu et al., 2005). Although the the GMFM CS have a relatively coarse spectral resolution of 0.2–0.4 nm, they might be better used for GOME ozone profile retrievals since they have been measured by the same GOME instrument. GMFM CS are currently being used in the GOME operational total ozone algorithm (van Roozen-dael et al., 2006) and were used in the GOME ozone profile retrieval by Hoogen et al. (1999).
To evaluate the impacts of using these sets of ozone CS on ozone profile retrievals and determine which CS should be used in retrieving ozone profiles from ultraviolet mea-surements, we compare retrievals with these CS using our GOME ozone profile retrieval algorithm. We also compare the retrievals near ozonesonde stations at Hohenpeißenberg (47.9◦N, 11.0◦E) and Hilo (155.1◦W, 19.6◦N) with co-incident Total Ozone Mapping Spectrometer (TOMS) and ozonesonde measurements.
2 Ozone profile retrieval algorithm and comparison methodology
The ozone profile retrieval algorithm was described in detail in Liu et al. (2005). Briefly, ozone profiles are retrieved at 11 layers (each layer is about 5 km thick except the top layer which is ∼10 km thick) from reflectance spectra for 289– 307 nm (in GOME channel 1) and 326–339 nm (in GOME
channel 2) using the optimal estimation technique, after extensive wavelength and radiometric calibrations and for-ward modeling of atmospheric ozone, temperature, clouds, aerosols, and surface albedo. We use the ozone profile cli-matology by McPeters et al. (2007) as a priori to constrain the retrievals. A wavelength-dependent shift (3rd-order poly-nomial) in ozone CS relative to the calibrated radiance spec-trum is fitted in the retrieval for each fitting window to cali-brate the wavelengths of ozone CS. Wavelength-dependent slit widths are pre-determined by cross-correlating the so-lar irradiance spectra with a high-resolution soso-lar reference spectrum (Liu et al., 2005). The tropopause from the Na-tional Centers for Environmental Prediction/NaNa-tional Center for Atmospheric Research (NCEP/NCAR) reanalysis is used to separate the troposphere and stratosphere; there are 2–3 tropospheric layers. Daily temperature profiles from the Eu-ropean Center for Medium range Weather Forecasting model (ECMWF) are used to reduce the effect of temperature on retrievals. Three major changes have been made to this algo-rithm for the current study. First, ozone profiles are retrieved for 24 layers (each layer is ∼2.5 km thick) with 4–6 tropo-spheric layers. Second, the fitting window of 326–339 nm is changed to 326–337 nm because the BP CS only covers up to 343 nm and a few nanometers are needed on each end of the fitting window to model the Ring effect. Third, we switched to use daily NCEP/NCAR temperature profiles for consis-tency during the GOME record since ECMWF temperature profiles are not publicly available after August 2002.
We use exactly the same retrieval algorithm for different CS except with some necessary modifications to the orig-inal CS described as follows. The BP data are provided as temperature-dependent quadratic coefficients so that they can be conveniently applied to any atmospheric tempera-ture. Their wavelengths, originally in air, have been previ-ously converted to vacuum wavelengths (Orphal and Chance,
2003). The other two ozone CS are given at individual tem-peratures and at air wavelengths. We do not use the BDM CS at 273 K in the fitting for two reasons. First, the 273 K CS do not extend below 300 nm, so we exclude them to avoid in-consistency over the whole fitting window. Second, we find that including the 273 K CS in the parameterization of the temperature dependence above 300 nm leads to much larger CS residuals (Fig. 1a) at all other temperatures than residuals obtained excluding the 273 K CS (Fig. 1b). It seems that a systematic bias exists at 273 K relative to other temperatures in the BDM measurements. Because the BDM and BP CS are measured at high spectral resolution, we convolve them to the GOME spectral resolution with the pre-determined vari-able slit widths. The GMFM CS do not need to be convolved because they were measured at GOME resolution.
Figure 2 compares different ozone CS at three tempera-tures that are actually used in individual retrievals. These CS are wavelength-calibrated and transformed to the same spec-tral resolution during the retrieval. For 289–307 nm, the BP CS compare with the BDM CS to within ∼1%, with small mean biases, while the GMFM CS are on average higher by 1–2% than the BDM CS. For 326–337 nm, the mean BP (GMFM) CS are higher by 1–2% (2–4%) than the BDM CS. Applying additional shifts among different CS only slightly reduces these mean biases. The biases at individual wave-lengths show large spectral variation and can be as high as 8%. The strong and frequent oscillating structures present in Fig. 2b support the observation that the BP CS are noisier. This may result from worse wavelength calibration because the BP CS were measured by a step-scanning monochro-mator, one wavelength at a time. Differences also occur in the temperature dependences, especially between the GMFM and BDM CS because the biases vary significantly with tem-perature. It should be noted that these biases are significantly larger than those found by Orphal (2002). This is because he compared these CS at individual temperatures (temperature usually within ±5 K between different sets) and accounted for baseline effects.
To evaluate the effects of using different CS on ozone pro-file retrievals, we compare the retrievals during overpasses of Hohenpeißenberg in 1997 and Hilo in 1996–1999 against TOMS total column ozone (TO), ozonesonde ozone pro-file and tropospheric column ozone (TCO). TOMS TO data are obtained from http://toms.gsfc.nasa.gov. Ozonesonde data at Hohenpeißenberg are obtained from the World Ozone and Ultraviolet Data Center (WOUDC, http://www. woudc.org) and ozonesonde data at Hilo, normalized with simultaneously observed Dobson TO, are obtained from http://www.cmdl.noaa.gov. The collocation criteria and methods to compare retrievals with other correlative mea-surements have been described in detail in Liu et al. (2005, 2006).
Fig. 1. Residuals in ozone cross sections at different
tempera-tures after using non-linear least squares fitting to derive quadratic temperature-dependent coefficients from the original Brion cross sections. (a) With 273 K. (b) Without 273 K.
3 Comparison of retrievals
Figure 3 and Table 2 compares the average fitting residu-als in the two fitting windows for an orbit of retrievresidu-als (or-bit 70607024). In the 289–307 nm region, where ozone ab-sorption features are broad, the fitting residuals are similar between different CS, except that using the BDM CS reduces the fitting residuals by 4–7% (relative to the fitting resid-uals). For 326–337 nm, where there are relatively narrow vibrational structures, the average fitting residuals with the BDM CS are smaller by 20–60% and 16–50% (relative to the fitting residuals) than those with the BP and GMFM CS, respectively. In addition, the residuals with the BDM CS do not vary much with latitude (or solar zenith angle), while the residuals with the other two CS increase with latitude. Since ozone absorption varies with latitude resulting from the in-crease of solar zenith angle at higher latitude and the latitu-dinal distribution of ozone, generally decreasing toward the equator, this indicates a problem with fitting the ozone ab-sorption in the observed spectra for the GMFM and BP CS. The differences in residuals are similar for the retrievals of orbit 61201030 and the overpasses of Hohenpeißenberg and Hilo (Table 2). The residual differences support the BDM CS having the best wavelength calibration and the BP CS being the noisiest (Orphal, 2002). Table 2 also compares the num-ber of successful retrievals. Using the BDM CS generally
3574 X. Liu et al.: Impact of O3cross sections on O3profile retrievals
Fig. 2. (a–b) Differences between Bass-Paur and Brion cross sections for the 289–307 and 326–337 nm ranges, respectively, at three
temperatures. (c–d) Like (a–b) but for differences between GOME flight model and Brion cross sections. The numbers in parentheses indicate the mean bias.
Fig. 3. Average fitting residuals using different ozone cross sections
as a function of latitude for an orbit of retrievals (70607024) in two fitting windows (289–307 and 326–337 nm).
leads to more successful retrievals. Unsuccessful retrievals are due mainly to negative ozone values derived at some lay-ers.
Figures 4–6 compare the retrieved TO, TCO, and ozone profiles for the same orbit as in Fig. 3. The TO re-trieved with the BP and BDM CS are generally consis-tent, with the former smaller by 1–2 Dobson Units (DU, 1 DU=2.69×10¹⁶molecules cm−2)or ∼0.5–1.0%. The re-trieved TO with the GMFM CS is smaller relative to the TO with the BDM CS, ranging from ∼6 DU (∼2.5%) in 30◦S– 40◦N to 12 DU (∼4.0%) at higher latitudes (Fig. 4). Table 2 indicates that similar TO biases exist for other retrievals with the GMFM CS. The reason for the smaller TO retrieved with the GMFM CS is that these CS are systematically larger by
>1.5% in both fitting windows (Fig. 2). The retrieved TCO also shows biases of up to 10 DU (30%) at some locations, although the biases are not a smooth function of latitude. The BP retrievals show negative biases of <3 DU (∼10%) at most locations relative to the BDM retrievals but show negative biases of 5–10 DU (∼15–30%) at 20◦–40◦N. The GMFM retrievals show negative biases of >5 DU (∼15%) at most locations relative to the BDM retrievals but show small negative biases or even positive biases at higher lati-tudes and around 40◦N and 45◦N. On average, the retrieved TCO values with the BP and GMFM CS are lower by 1–5 DU
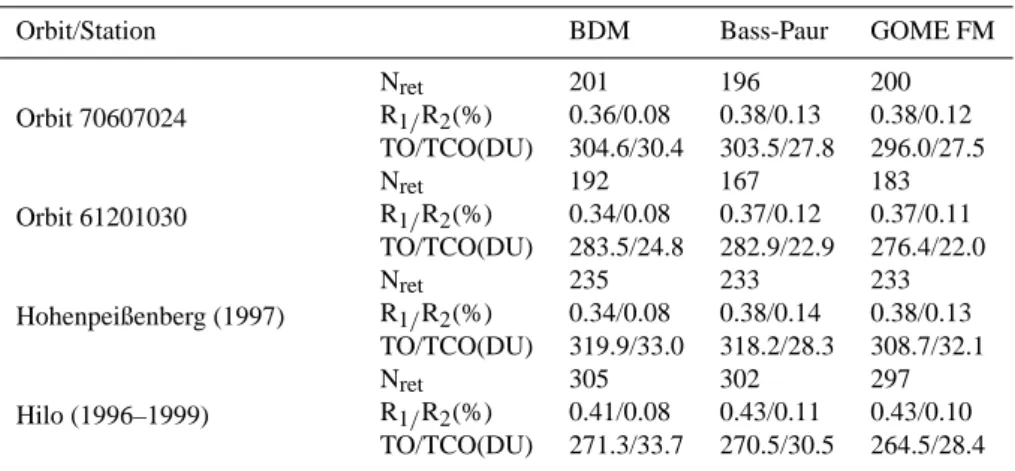
Table 2. Comparisons of number of successful retrievals (Nret), fitting residuals in two windows (R1and R2), retrieved total column ozone (TO), and tropospheric column ozone (TCO) for two orbits of retrievals and retrievals coincident with Hohenpeißenberg and Hilo.
Orbit/Station BDM Bass-Paur GOME FM
Orbit 70607024 Nret 201 196 200 R1/R2(%) 0.36/0.08 0.38/0.13 0.38/0.12 TO/TCO(DU) 304.6/30.4 303.5/27.8 296.0/27.5 Orbit 61201030 Nret 192 167 183 R1/R2(%) 0.34/0.08 0.37/0.12 0.37/0.11 TO/TCO(DU) 283.5/24.8 282.9/22.9 276.4/22.0 Hohenpeißenberg (1997) Nret 235 233 233 R1/R2(%) 0.34/0.08 0.38/0.14 0.38/0.13 TO/TCO(DU) 319.9/33.0 318.2/28.3 308.7/32.1 Hilo (1996–1999) Nret 305 302 297 R1/R2(%) 0.41/0.08 0.43/0.11 0.43/0.10 TO/TCO(DU) 271.3/33.7 270.5/30.5 264.5/28.4
Table 3. Comparison statistics: number of comparisons n, mean bias (DU), standard deviation (DU) and correlation coefficient between
retrieved total column ozone (TO) and tropospheric column ozone (TCO) with TOMS and ozonesonde observations at Hohenpeißenberg and Hilo for different cross sections.
Hohenpeißenberg (1997) n BDM Bass-Paur GOME FM TOMS TO 207 2.6±5.3, 0.99 1.2±5.6, 0.99 –7.4±5.4, 0.99 Sonde TCO 77 0.3±3.4, 0.76 –4.1±3.8, 0.78 –1.0±3.8, 0.72 Hilo (1996–1999) TOMS TO 222 –0.7±2.9, 0.98 –1.9±2.8, 0.98 –8.0±2.8, 0.99 Sonde TCO 52 0.3±5.6, 0.85 –2.7±6.2, 0.81 –4.8±6.4, 0.80
(∼3–15%), depending on the locations (Table 2). Figure 6 shows that the mean retrieved ozone profiles with the BP and GMFM CS are generally smaller by 15% at individual lay-ers especially below 20 km. The individual retrieved profiles occasionally show both positive and negative biases of up to 50–100% between the BP/GMFM and BDM CS in the trop-ical and Antarctic upper troposphere and lower stratosphere, where the ozone amount is small.
Figures 7–9 compare retrievals with different CS against the TOMS TO, ozonesonde TCO and profiles over Hohen-peißenberg and Hilo. Table 3 summarizes the TO and TCO comparison. The retrieved TO with the BDM and BP CS compares well with TOMS TO, to within 3 DU (∼1%) on average. However, the BDM has slightly smaller standard deviations. The TO retrieved with the GMFM CS shows systematic negative biases of 7–8 DU (∼2–3%) relative to TOMS TO, but the standard deviations and correlations are slightly better than those with the BP CS. As for TCO, the retrievals with the BDM CS consistently show better agree-ment (i.e., smaller biases and standard deviations, and higher correlation) with ozonesonde TCO than the others at these
Fig. 4. Comparison of (a) the retrieved total column ozone using
different ozone cross sections for the same orbit as in Fig. 3 and (b) their differences.
3576 X. Liu et al.: Impact of O3cross sections on O3profile retrievals
Fig. 5. Same as Fig. 4 but for the retrieved tropospheric column
ozone.
Fig. 6. Comparison of (a) mean a priori and retrieved ozone profiles
using different ozone cross sections for the same orbit as in Fig. 3 and (b) their differences.
two locations. The mean biases with the BDM CS are within 0.5 DU (1–2%), while the BP retrievals have a negative mean bias of 4 DU (∼10%) at Hohenpeißenberg and the GMFM retrievals have a negative mean bias of 5 DU (∼15%) at Hilo. The GMFM TCO shows slightly worse standard deviations and correlation coefficients than the others. Figure 9 illus-trates that there are large relative biases below 20 km (up to 30% at Hohenpeißenberg and up to 60% at Hilo) between using different CS, consistent with the results in Fig. 6. The retrievals with the BDM CS show positive biases of up to 30% between 10 and 20 km. These biases, investigated in detail in Liu et al. (2006), are due to a combination of re-trieval errors (e.g., wavelength-dependent bias in the GOME channel 1a reflectance) and ozonesonde measurements (e.g., uncorrected hysteresis). The fact that GMFM retrievals com-pare best with ozonesonde measurements at
Hohenpeißen-Fig. 7. Comparison of total column ozone (TO) retrieved with
dif-ferent cross sections, and TOMS TO, and their differences. (a) Ho-henpeißenberg during 1997. (b) Hilo during 1996–1999.
berg below 20 km is likely due to canceling errors: at Hilo, the GMFM retrievals have negative biases of 10–30% below 20 km. The BP retrievals have positive biases above ∼10 km and negative biases below ∼10 km.
4 Summary and discussion
To investigate the effects of ozone cross sections (CS) on ozone profile retrievals, we compared retrievals using our GOME ozone profile algorithm with three CS data sets: Bass-Paur (BP), Brion (BDM), and GOME flight model (GMFM). After transforming these CS to the same GOME spectral resolution and calibrating wavelengths through the retrieval processes, we find that systematic differences exist among different CS. For example, the BP CS have a positive mean bias of 1–2% in 326–337 nm relative to the BDM CS; the GMFM CS have positive mean biases of ∼2% in 289– 307 nm and 2–4% in 326–337 nm. The biases depend on temperature, especially between the BDM/BP and GMFM CS.
We find that using the BDM CS significantly reduces fit-ting residuals, by 20–60% and 15–50% in the Huggins bands, compared to using the BP and GMFM CS, respectively. Due to the systematic differences and different uncertainties in
Fig. 8. Same as Fig. 7 but for retrieved and ozonesonde tropospheric
column ozone.
these CS, the choice of CS significantly impacts retrievals, by up to 12 DU in total column ozone (TO), 10 DU in tro-pospheric column ozone (TCO), and ∼100% in ozone val-ues at individual layers. The TO valval-ues retrieved with the BDM and BP CS are similar, with the former larger by 1– 2 DU on average. Both agree with the TOMS TO values to within 3 DU. The GMFM TO values are lower, by 7–10 DU on average, than the BDM and BP TO values and are lower by 7–8 DU than the TOMS TO values. Through validation against ozonesonde TCO at Hohenpeißenberg and Hilo, we find that retrievals with the BDM CS generally compare best with ozonesonde TCO, leading to smaller biases and stan-dard deviations, and higher correlation coefficients.
Based on this study, we recommend the use of the BDM CS for ozone profile retrievals from ultraviolet measurements and recommend the inclusion of this data set in the HITRAN database. However, it should be noted that there are cer-tain limitations in using BDM CS. First, they do not cover the temperature range below 218 K, while the atmospheric temperature in the upper troposphere and lower stratosphere is often below 218 K, as low as ∼195 K. Second, the 273 K CS seem to contain systematic biases relative to CS at other temperatures and do not extend below 300 nm. Third, Or-phal (2002) reported that the BDM data contain some non-linear wavelength calibration errors. To effectively use this data set, we have to rely on the quadratic coefficients
de-Fig. 9. Comparison of mean ozone profiles retrieved using different
cross sections and ozonesonde observations, and their differences.
(a) Hohenpeißenberg during 1997. (b) Hilo during 1996–1999.
rived from four temperatures (i.e., 218, 228, 243, and 295 K). This can introduce errors in the CS actually used in retrievals especially below 218 K as well as to the temperature de-pendence of ozone absorption, which is important for tro-pospheric ozone retrievals. Therefore, we require superior ultraviolet ozone CS measured at high spectral resolution, with better wavelength calibrations and accuracy, and cover-ing a wide range of atmospheric temperatures. In view of the emerging methods of deriving tropospheric and even bound-ary layer ozone by combing ultraviolet, visible, and infrared measurements for air quality monitoring, it is essential that ozone absorption cross sections in different spectral regions are consistent.
Acknowledgements. This study is supported by NASA and the Smithsonian Institution. We thank the WOUDC and CMDL and their data originators for providing ozonesonde measurements and the TOMS data processing team for providing the TOMS data. Edited by: U. Platt
References
Bass, A. M. and Paur, R. J.: The ultraviolet cross-sections of ozone, I, The measurements, in: Atmospheric Ozone, edited by: Zere-fos, C. S., Ghazi, A., and Reidel, D., Norwell, Mass., 606–610, 1985.
Brion, J., Chakir, A., Charbonnier, J., Daumont, D., Parisse, C., and Malicet, J.: Absorption spectra measurements for the ozone
3578 X. Liu et al.: Impact of O3cross sections on O3profile retrievals
molecule in the 350–830 nm region, J. Atmos. Chem., 30, 291– 299, 1998.
Brion, J., Chakir, A., Daumont, D., and Malicet, J.: High-resolution laboratory absorption cross section of O3. Temperature effect, Chem. Phys. Lett., 213(5–6), 610–512, 1993.
Burrows, J. P., Dehn, A., Deters, B., Himmelmann, S., Richter, A., Voigt, S., and Orphal, J.: Atmospheric remote-sensing refer-ence data from GOME: Part 2. Temperature-dependent absorp-tion cross-secabsorp-tions of O3 in the 231–794 nm range, J. Quant. Spectrosc. Radiat. Transfer, 61(4), 509–517, 1999.
Chance, K. V., Burrows, J. P., Perner, D., and Schneider, W.: Satellite measurements of atmospheric ozone profiles, includ-ing tropospheric ozone, from ultraviolet/visible measurements in the nadir geometry: a potential method to retrieve tropospheric ozone, J. Quant. Spectrosc. Radiat. Transfer, 57(4), 467–476, 1997.
Daumont, M., Brion, J., Charbonnier, J., and Malicet, J.: Ozone UV spectroscopy I: Absorption cross-sections at room temperature, J. Atmos. Chem., 15, 145–155, 1992.
Hasekamp, O. P. and Landgraf, J.: Ozone profile retrieval from backscattered ultraviolet radiances: The inverse problem solved by regularization, J. Geophys. Res., 106(D8), 8077–8088, 2001. Hoogen, R., Rozanov, V. V., and Burrows, J. P.: Ozone profiles from GOME satellite data: Algorithm description and first validation, J. Geophys. Res., 104(D7), 8263–8280, 1999.
Liu, X., Chance, K., Sioris, C. E., Spurr, R. J. D., Kurosu, T. P., Mar-tin, R. V., and Newchurch, M. J.: Ozone profile and tropospheric ozone retrievals from Global Ozone Monitoring Experiment: Al-gorithm description and validation, J. Geophys. Res., 110(D20), D20307, doi:10.1029/2005JD006240, 2005.
Liu, X., Chance, K., Sioris, C. E., Kurosu, T. P., and Newchurch, M. J.: Intercomparison of GOME, ozonesonde, and SAGE-II measurements of ozone: Demonstration of the need to homoge-nize available ozonesonde datasets, J. Geophys. Res., 101(D14), D114305, doi:10.1029/2005JD006718, 2006.
Malicet, C., Daumont, D., Charbonnier, J., Parisse, C., Chakir, A., and Brion, J.: Ozone UV spectroscopy, II. Absorption cross-sections and temperature dependence, J. Atmos. Chem., 21, 263– 273, 1995.
McPeters, R. D., Labow, G. J., and Logan, J. A.: Ozone climatolog-ical profiles for satellite retrieval algorithms, J. Geophys. Res., 112(D5), D05308, doi:10.1029/2005JD006823, 2007.
Munro, R., Siddans, R., Reburn, W. J., and Kerridge, B.: Direct measurement of tropospheric ozone from space, Nature, 392, 168–171, 1998.
Orphal, J.: A critical review of the absorption cross-sections of O3and NO2in the 240–790 nm region, Part 1. ozone, in ESA Technical Note MO-TN-ESA-GO-0302, ESA-ESTEC, Noord-wijk, The Netherlands, 2002.
Orphal, J.: A critical review of the absorption cross-sections of O3 and NO2 in the 240–790 nm region, J. Phtotochem. Photobiol. A., 157, 185–209, 2003.
Orphal, J. and Chance, K.: Ultraviolet and visible absorption cross-sections for HITRAN, J. Quant. Spectrosc. Radiat. Transfer, 82, 491–504, 2003.
Paur, R. J. and Bass, A. M.: The ultraviolet cross-sections of ozone, II. Results and temperature dependence, in: Atmospheric Ozone, edited by: Zerefos, C. S., Ghazi, A., and Reidel, D., Norwell, Mass., 611–616, 1985.
Rothman, L. S., Jacquemart, D., Barbe, A., et al.: The HITRAN 2004 molecular spectroscopic database, J. Quant. Spectrosc. Ra-diat. Transfer, 96(2), 139–204, 2005.
van der A, R. J., van Oss, R. F., Piters, A. J. M., Fortuin, J. P. F., Meijer, Y. J., and Kelder, H. M.: Ozone profile retrieval from recalibrated GOME data, J. Geophys. Res., 107(D15), 4239, doi:10.1029/2001JD000696, 2002.
van Roozendael, M., Loyola, D., Spurr, R. J. D., et al.: Ten years of GOME/ERS-2 total ozone data – The new GOME data processor (GDP) version 4: 1. Algorithm description, J. Geophys. Res., 111, D14311, doi:10.1029/2005JD006375, 2006.