HAL Id: hal-00301404
https://hal.archives-ouvertes.fr/hal-00301404
Submitted on 19 May 2005HAL is a multi-disciplinary open access
archive for the deposit and dissemination of sci-entific research documents, whether they are pub-lished or not. The documents may come from teaching and research institutions in France or abroad, or from public or private research centers.
L’archive ouverte pluridisciplinaire HAL, est destinée au dépôt et à la diffusion de documents scientifiques de niveau recherche, publiés ou non, émanant des établissements d’enseignement et de recherche français ou étrangers, des laboratoires publics ou privés.
Tropospheric O3 over Indonesia during biomass burning
events measured with GOME (Global Ozone Monitoring
Experiment) and compared with trajectory analysis
A. Ladstätter-Weißenmayer, J. Meyer-Arnek, A. Richter, F. Wittrock, J. P.
Burrows
To cite this version:
A. Ladstätter-Weißenmayer, J. Meyer-Arnek, A. Richter, F. Wittrock, J. P. Burrows. Tropospheric O3 over Indonesia during biomass burning events measured with GOME (Global Ozone Monitoring Experiment) and compared with trajectory analysis. Atmospheric Chemistry and Physics Discussions, European Geosciences Union, 2005, 5 (3), pp.3105-3130. �hal-00301404�
ACPD
5, 3105–3130, 2005 Tropospheric O3 over Indonesia A. Ladst ¨atter-Weißenmayer et al. Title Page Abstract Introduction Conclusions References Tables Figures J I J I Back CloseFull Screen / Esc
Print Version Interactive Discussion
EGU Atmos. Chem. Phys. Discuss., 5, 3105–3130, 2005
www.atmos-chem-phys.org/acpd/5/3105/ SRef-ID: 1680-7375/acpd/2005-5-3105 European Geosciences Union
Atmospheric Chemistry and Physics Discussions
Tropospheric O
3
over Indonesia during
biomass burning events measured with
GOME (Global Ozone Monitoring
Experiment) and compared with trajectory
analysis
A. Ladst ¨atter-Weißenmayer, J. Meyer-Arnek, A. Richter, F. Wittrock, and J. P. Burrows
Institute of Environmental Physics, University of Bremen, P.O. Box 330440, D-28334 Bremen, Germany
Received: 26 January 2005 – Accepted: 15 April 2005 – Published: 19 May 2005 Correspondence to: A. Ladst ¨atter-Weißenmayer ([email protected]) © 2005 Author(s). This work is licensed under a Creative Commons License.
ACPD
5, 3105–3130, 2005 Tropospheric O3 over Indonesia A. Ladst ¨atter-Weißenmayer et al. Title Page Abstract Introduction Conclusions References Tables Figures J I J I Back CloseFull Screen / Esc
Print Version Interactive Discussion
EGU
Abstract
Tropospheric ozone columns of up to 50 DU were observed by GOME (Global Ozone Monitoring Experiment) above Indonesia in September 1997, while only background amounts were measured in September 1998. The Traj.x trajectory model along with BRemen’s Atmospheric PHOtochemical model (BRAPHO) were used to investigate the
5
higher than average ozone columns above Indonesia. The transport analysis reveals that biomass burning over central Africa and northern Australia does not significantly influence ozone columns over Indonesia in September 1997. El Ni ˜no conditions, lead-ing to extreme dryness and uncontrolled fires in Indonesia, produced ozone precursors, which are initially only slowly advected westwards to the central Indian Ocean. Joint
10
transport and chemistry modelling was able to reproduce the spatial distribution and amounts of ozone, NO2 and formaldehyde columns over Indonesia. The chemistry modelling shows a net production of 3.1 Tg of ozone produced by biomass burning in Indonesia in September 1997. Transport analysis further reveals that ozone columns over the Indian Ocean, between 10 and 20◦S can be accounted for by the mixing of air
15
masses containing NOxfrom lightning over the Congo Basin with air masses containing volatile organic compounds from biomass burning.
1. Introduction
Biomass burning, often initiated in order to clear land for agricultural purposes, has been identified as a significant source of trace gases. These emissions affect the
at-20
mosphere at local, regional and global scales (Crutzen et al.,1979;Seiler and Crutzen, 1980;Crutzen and Andreae,1990;Levine et al.,1995;Levine,1999). Along with par-ticulates, the major gases produced by biomass burning include carbon dioxide (CO2), carbon monoxide (CO), methane (CH4), formaldehyde (HCHO), oxides of nitrogen (NOx = NO+NO2) and ammonia (NH3). The combination of CH4, CO, nonmethane
25
produc-ACPD
5, 3105–3130, 2005 Tropospheric O3 over Indonesia A. Ladst ¨atter-Weißenmayer et al. Title Page Abstract Introduction Conclusions References Tables Figures J I J I Back CloseFull Screen / Esc
Print Version Interactive Discussion
EGU tion of tropospheric O3. Some of these species, CO2, CH4, and O3 are also
green-house gases that contribute to global warming. Ozone also affects the abundance of important atmospheric oxidants such as OH and peroxy radicals (Atkinson,2000). The lifetime of these ozone precursors and of ozone itself (Oltmans et al.,1998) is su ffi-ciently long that they can be transported hundreds or even thousands of kilometres
5
away from their source before being chemically destroyed or deposited.
In 1997/98 a smog blanket of 3 million km2 covered a large area of Indonesia and affected the health of 75 million people in 6 countries. At the same time extensive biomass burning was occuring in Indonesia. It was caused by an extreme dryness due to the strongest El Ni ˜no conditions ever recorded (CTI, Cold Tongue Index of 2.2)
10
(Folland and Parker,1995). Biomass burning was also occuring in Africa and Australia and could potentially contribute to the smog over Indonesia through transport.
The objective of this study is to qualitatively and quantitatively understand the mete-orological and anthropogenic contributions that led to the enormous increase of tropo-spheric O3in September 1997 as compared to September 1998 over Indonesia.
15
Because of the large extent of the fires over Indonesia and potential influences from air masses originating over Africa and Australia, in situ measurements are insufficient to provide adequate explanation of this large scale event. GOME (Global Ozone Mon-itoring Experiment) measurements of tropospheric ozone and ozone precursors have wide spatial and temporal coverage. In conjunction with chemical and transport models
20
these data can be used to assess their origin of this event. For this study tropospheric columns of ozone, NO2, and formaldehyde were retrieved for the Indonesian region. Possible contribution to the ozone column due to transport of air masses affected by biomass burning in Africa, Australia and Indonesian region are qualitatively evaluated using the trajectory model Traj.x. Biomass burning locations were identified from Along
25
the Track Scanning Radiometer (ATSR) data collected over the same time periode. A quantitative view of the impact of the Indonesian fires alone during September 1997 was evaluated with the chemical boxmodel BRAPHO (BREmen’s Atmospheric PHOto-chemical boxmodel) for a large number of trajectories.
ACPD
5, 3105–3130, 2005 Tropospheric O3 over Indonesia A. Ladst ¨atter-Weißenmayer et al. Title Page Abstract Introduction Conclusions References Tables Figures J I J I Back CloseFull Screen / Esc
Print Version Interactive Discussion
EGU
2. Methodology and tools
2.1. Trace gas columns retrieved from GOME
GOME was launched in April 1995 onboard the European Research Satellite (ERS)-2 into a near-sun-synchronous orbit at a mean altitude of 795 km. The descending node crosses the equator every 2800 km at 10:30 a.m. local time. GOME is a nadir-scanning
5
double-monochromator measuring the sun-light scattered from the Earth’s atmosphere and/or reflected by its surface in the wavelength region of 240 to 790 nm at a moderate spectral resolution of 0.17 to 0.33 nm. Total ground coverage is obtained within 3 days at the equator by a 960 km across track swath (4.5 s forward scan, 1.5 s back scan). The solar irradiance is measured daily.
10
Details of the overall scientific objectives of GOME, the instrument concept, and some scientific results are reported elsewhere (Burrows et al., 1999, 2000). In ad-dition, a number of studies have been published focusing on the retrieval of tropo-spheric NO2 (Leue et al.,2001;Richter and Burrows,2002;Martin et al.,2002) and HCHO (Ladst ¨atter-Weißenmayer et al.,1998;Chance et al.,2000;Thomas et al.,1998;
15
Palmer et al.,2003) from GOME data. The ozone columns used in this study are based on lv2-v3.0-data which were processed by the GOME Data Processor (GDP) at the German Remote Sensing Data Center (DFD) (DLR,1996).
As GOME is a nadir viewing instrument, both tropospheric and stratospheric absorp-tions contribute to the measured signal. While this is not critical for HCHO which has a
20
very small stratospheric column, the stratospheric O3and NO2columns can not be ne-glected in the analysis. Therefore, the Tropospheric Excess Method (TEM) was used to derive the tropospheric columns of O3(Ladst ¨atter-Weißenmayer et al.,2004) and of NO2(Richter and Burrows,2002).
The TEM method is based on the assumption that stratospheric O3 and NO2 do
25
not vary zonally, and therefore the total columns measured on the same day at the same latitude over a clean air region can be used as an approximation of the strato-spheric column over the region of interest. In this study, data from the Pacific region
ACPD
5, 3105–3130, 2005 Tropospheric O3 over Indonesia A. Ladst ¨atter-Weißenmayer et al. Title Page Abstract Introduction Conclusions References Tables Figures J I J I Back CloseFull Screen / Esc
Print Version Interactive Discussion
EGU (180–190◦) were used as reference sector. In addition only GOME data with a cloud
cover less than 10% (due to GOME ICFA cloud algorithm) were analysed. The over-all analysis then consists of three steps: (a) determination of the total slant column, (b) subtraction of the stratospheric contribution including the tropospheric background yielding the tropospheric excess slant column and (c) division by the air mass factor
5
(AMF) (Rozanov et al.,1997) to obtain the vertical tropospheric excess column. The tropospheric column is then calculated by the addition of the tropospheric background of 21 DU as measured by SHADOZ (Southern Hemisphere ADditional Ozonesondes) (Thompson et al., 2003) over Fiji (18.13◦S, 178.40◦E) for O3 and of 2.5·1014molec cm−2 for NO2 (Boersma et al., 2004). The main error sources are longitudinal
inho-10
mogeneities in the stratospheric contribution of the species analysed, uncertainties in cloud cover, surface albedo, aerosol loading and the assumed vertical profile of O3and NO2which are required in calculating the AMF (Richter and Burrows,2002).
The overall error of the analysis is estimated to be generally in the order of 4 DU for tropospheric O3columns (Ladst ¨atter-Weißenmayer et al.,2004) and 1.5·1015molec
15
cm−2 for tropospheric columns of NO2(Richter and Burrows,2002).
HCHO columns are obtained with a detection limit of about 2.5·1015molec cm−2. Since the stratospheric contribution to its total column is negligible, this represents the detection limit for the tropospheric formaldehyde loading.
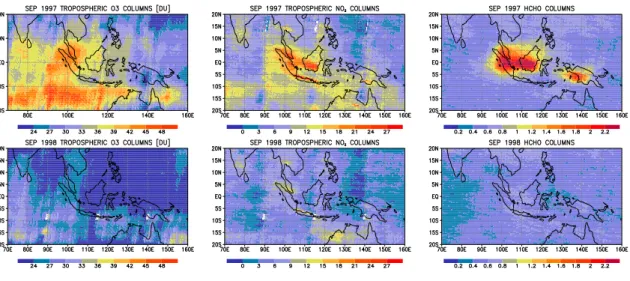
The tropospheric columns of ozone and NO2 which were derived by applying the
20
TEM and the total formaldehyde column for September 1997 and September 1998 are shown in Fig. 1. During the September 1997 Indonesian biomass burning episode an increase of monthly mean tropospheric ozone columns of up to 50 DU is de-tected. The monthly mean tropospheric column of the ozone precursor NO2 peaked at 2.6·1015molec cm−2 during September 1997. The formaldehyde column, which
25
scales with the abundance of VOC emissions, peaked at 3.0·1016molec cm−2 (see Fig. 1). On 21 September 1997 GOME performed measurements in the region of Borneo. The retrieval of tropospheric formaldehyde from these measurements shows enhanced amounts of this trace gas and has been discussed elsewhere (Ladst
¨atter-ACPD
5, 3105–3130, 2005 Tropospheric O3 over Indonesia A. Ladst ¨atter-Weißenmayer et al. Title Page Abstract Introduction Conclusions References Tables Figures J I J I Back CloseFull Screen / Esc
Print Version Interactive Discussion
EGU Weißenmayer et al.,1998).
The SHADOZ network reported a maximum tropospheric ozone column of 57 DU over Watukosek, Java (7.57◦S, 112.65◦E) (see Fig. 2) (Fujiwara et al., 2003) during the same Indonesian pollution episode.
In contrast, in September 1998 the tropospheric ozone columns in the Indonesian
5
region remained below 30 DU which is very close to background conditions.
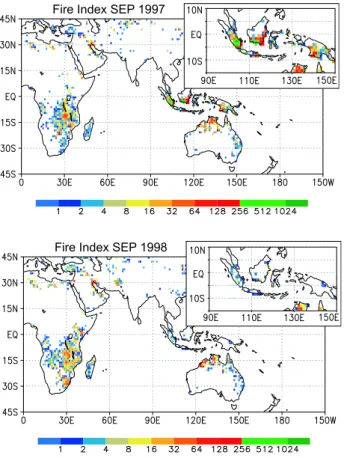
ATSR, also aboard the ERS-2, measures nigthtime infrared radiation emitted by the Earth’s surface. Hotspot data from this instrument provided by the European Space Agency (ESA), are identified as fires (Arino et al., 1997). By projecting all hotspots detected during September 1997 and September 1998 onto a global grid of
10
1.125×1.125◦, the fire index, shown in Fig.3, is generated for both episodes. Biomass burning in Indonesia was much stronger in September 1997 than in September 1998. In contrast, biomass burning over the southern parts of Africa and the northern parts of Australia both show no significant difference in intensity or spatial distribution when comparing September 1997 to September 1998.
15
When accounting for air pollution in the tropical regions, lightning cannot be omitted since it is an important source of nitrogen oxides especially in the upper troposphere. Due to the fact that its intensity is strongly enhanced in equatorial regions, a multiannual climatology based on the Lightning Imaging Sensor (LIS) and the Optical Transient Detector (OTD) (Christian et al.,2003) is applied.
20
2.2. Trajectory analysis and chemistry modelling
To determine which air masses contribute biomass burning pollutants to the Indone-sian region during this episode, the trajectory model Traj.x, developed at the Institute of Environmental Physics, University of Bremen was used. Traj.x is a kinematic trajec-tory model which calculates the transport of air parcels along wind fields by applying
25
a fourth-order Runge-Kutta scheme. The meteorological data were taken from the Eu-ropean Centre for Medium-Range Weather Forecasts (ECMWF)’s 40-year reanalysis data set (ERA-40).
ACPD
5, 3105–3130, 2005 Tropospheric O3 over Indonesia A. Ladst ¨atter-Weißenmayer et al. Title Page Abstract Introduction Conclusions References Tables Figures J I J I Back CloseFull Screen / Esc
Print Version Interactive Discussion
EGU For each day in September 1997 and 1998, trajectories were initiated at 00:00 UT,
06:00 UT, 12:00 UT and 18:00 UT, starting from regions where biomass burning (or lightning, as discussed later) was occuring. All trajectories were released at altitudes of 50, 100, 150 and 200 hPa above ground level.
Altogether about 230 000 trajectories were calculated for air masses originating in
5
biomass burning activity in central Africa, northern Australia, Indonesia and lightning activity over the African Congo Basin. To derive a statistical overview of the transport, a quantity which is referred to as the trajectory density is deduced. This quantity is derived by projecting the current position of all trajectories being considered into a three dimensional grid depending on longitude, latitude and altitude with a resolution
10
of 1.125×1.125◦and 50 hPa respectively.
By this means the amount of trajectories travelling through each gridcell is deter-mined. High values of the trajectory density denote a large number of trajectories having passed through the regarded volume.
To better compare the transport patterns of air masses released from different
pro-15
cesses, the trajectory density is normalised to “1”.
By vertically integrating the trajectory density, a general picture of the spatial trans-port patterns is obtained.
Regions of high trajectory density qualitatively identify the average paths of air masses influenced by fires or lightning in September 1997. To get a quantitative view
20
on the impact of each regarded emission process on the air chemistry, the chemistry taking place in the different regarded air masses has to be taken into account.
This was achieved by applying the Lagrangian box model BRAPHO (BRemen’s At-mospheric PHOtochemical model) (Meyer-Arnek,2004). This boxmodel is run on a stochastically chosen subset of the 230 000 trajectories computed to determine the
25
transport pattern of the airmasses. It is based on ASAD (A Self contained Atmospheric chemistry code) (Carver et al.,1997). Lagrangian models describe the chemistry tak-ing place in a closed volumne of air which does not underly any mass exchange with the surroundings.
ACPD
5, 3105–3130, 2005 Tropospheric O3 over Indonesia A. Ladst ¨atter-Weißenmayer et al. Title Page Abstract Introduction Conclusions References Tables Figures J I J I Back CloseFull Screen / Esc
Print Version Interactive Discussion
EGU The chemistry scheme which was used in this study is based on the very detailed
Master Chemical Mechanism (MCM) catalogue version 3.0 (Saunders et al., 2003). In this compilation about 11 000 reactions describe the chemical interactions between about 3500 different species.
As no detailed trace gas measurements were performed during September 1997
5
over the Indonesian region, the model is initialised by airborne measurements con-ducted during the TRACE-A-campaign (Transport and Atmospheric Chemistry near the Equator-Atlantic) (Fishman et al.,1996). This campaign took place in September and October 1992 over the southern parts of America, Africa and the Atlantic Ocean. Measurements were partly performed over areas where biomass burning was taking
10
place. ByEmmons et al.(2000) all measurements obtained during this campaign were merged into a three dimensional composite. The chemistry model is initialised with averaged composites representing airborne measurements carried out over enhanced burning activity over Africa within the lowermost kilometer. They represent airmasses which recently left the fire, but are already cooled down to environmental temperatures,
15
so that the complicated fire chemistry does not have to be taken into account by the boxmodel.
Applying results from measurements which were performed over the burning African savanna during the TRACE-A-campaign for modelling the Indonesian fires of Septem-ber 1997 can only be regarded as a first approach in modelling this event. Over
In-20
donesia burning peat contributed most to the air pollution. Since hardly any information about VOC released by peat fires is available, this approach was performed.
During the TRACE-A-campaign the concentrations of about 10 different species have been measured. Only these species (O3, NO2, CO, C2H2 (ethyne), C3H8 (propane), CH3COCH3 (acetone), H2O2(hydrogen peroxide), HNO3(nitric acid), PAN
25
(peroxyacetyl-nitrate)) have been used to initialise the chemistry model. Consequently the MCM chemistry was reduced to represent the interactions between all of the mea-sured species and of all their oxidation products.
ACPD
5, 3105–3130, 2005 Tropospheric O3 over Indonesia A. Ladst ¨atter-Weißenmayer et al. Title Page Abstract Introduction Conclusions References Tables Figures J I J I Back CloseFull Screen / Esc
Print Version Interactive Discussion
EGU species mentioned above and of methane. This procedure lead to a model chemistry
consisting of 400 reactions between 133 different species.
To compare the volume mixing ratios (VMR) resulting from the chemistry modelling with trace gas columns retrieved from GOME measurements, the VMR of selected compounds are projected into a three dimensional grid depending on longitude, latitude
5
and pressure (Meyer-Arnek,2004). These mixing ratios are then integrated vertically to yield vertical columns.
To take into account the diurnal cycle of the photochemistry, only model results ob-tained for 10:30 local time (GOME’s overpass time) are applied to this procedure.
To account for the strong accumulation of fire releases due to extremely low
horizon-10
tal windspeeds over the Indonesian region during this episode, leading to an enormous increase of initial tracer concentrations, a sensitivity study was performed. At first a base run initialised with the data set as derived from the TRACE-A-composites was performed. In four subsequent runs, the VMR of all considered nonmethane hydrocar-bons (NMHC) were increased by a factor of 2, 4, 10 and 20. Methane was increased by
15
20% over the course of these four additional runs. Initial mixing ratios of NOxremained unchanged. The 5th model run (initialised with 5×[NMHC] and 1.2×CH4) shows the best agreement between GOME retrieval and model result for ozone, NO2and HCHO. The corresponding chemistry model initialisation is shown in Table1.
As the impact of biomass burning is considered to be major with respect to all of the
20
species applied for the model initialisation, anthropogenic and biogenic emissions are not considered.
3. Results and discussion
3.1. Trajectory analysis and the origin of the trace gases in the Indonesian region Three dimensional trajectory densities reveal that air masses originating over
Aus-25
ACPD
5, 3105–3130, 2005 Tropospheric O3 over Indonesia A. Ladst ¨atter-Weißenmayer et al. Title Page Abstract Introduction Conclusions References Tables Figures J I J I Back CloseFull Screen / Esc
Print Version Interactive Discussion
EGU where these air masses underly long-range transport – or they are slowly advected
at lower altitudes. The projection of the three dimensional trajectory density on the ground is shown in Fig.4.
The majority of the air masses released from fires over northern Australia is trans-ported in easterly directions, away from the Indonesian region. At lower altitudes
(be-5
low 700 hPa) a small portion of polluted air masses is directly advected into the Indone-sian region.
The same accounts for emissions from biomass burning over Africa. Emissions either stay in the vicinity of the fires at lower altitudes or they are risen up by convection. In the upper troposphere these air masses mostly underly long-range-transport into
10
easterly directions. Consequently fire releases from biomass burning over Africa arrive over the Southern Central parts of the Indian Ocean, but do not reach Indonesia itself (see Fig.4).
Kunhikrishnan et al. (2004) investigated the intra-annual distribution of NOx over the central Indian Ocean (from 10◦N to 20◦S) by applying the 3-D-global chemistry
15
transport model MATCH-MPIC (Lawrence et al.,2003) driven by meteorological analy-sis from NCEP/NCAR. The study reveals that NOx-enriched air masses released over Africa are responsible for the amount of NO2derived from GOME measurements.
The assumption that the influence of emissions from Africa and Australia is minor is underlined by the low interannual variability of hotspot data derived from ATSR
20
measurements. The biomass burning activity remained constant for both episodes (September 1997 and September 1998) whereas the corresponding trace gas columns over the Indonesian region experienced extraordinary differences already shown in Fig.4.
Trajectories of air masses originating over biomass burning in Indonesia indicate that
25
fire emissions rose up slowly and are then gradually spread into westerly directions. Due to weak easterlies in the equatorial region, trajectories travelled only up to 25 degrees within 10 days. During fall 1997 the convective rise of air masses over the Indonesian region was partly prevented by the descending branch of the longitudinal
ACPD
5, 3105–3130, 2005 Tropospheric O3 over Indonesia A. Ladst ¨atter-Weißenmayer et al. Title Page Abstract Introduction Conclusions References Tables Figures J I J I Back CloseFull Screen / Esc
Print Version Interactive Discussion
EGU Walker circulation (Holton,1992) related to the extreme El Ni ˜no conditions.
This downdraft led to an extreme dryness, lengthening the duration and severity of the biomass burning event. Consequently the combination of meteorological conditions and severe burning resulted in an enormous increase in the concentration of pollutants (both gas phase emissions and aerosols) directly over Indonesia.
5
While the transport analysis indicates that the unusually high tropospheric O3, NO2 and formaldehyde columns observed by GOME directly over Indonesia in September 1997 were produced largely by local events, high columns of ozone and NO2 over the Indian Ocean between 10 to 20◦S (see Fig. 1) cannot be explained by transport of Indonesian fire emissions.
10
CO can be regarded as a tracer for emissions from biomass burning. Measurements of CO amounts derived from measurements of the MOPITT instrument (Measurement of Pollution In The Troposphere) (Drummond and Mand,1996;Crawford et al.,2004) performed during September 2002 are shown in Fig.5. Monthly mean transport pat-terns of both episodes (September 2002 (MOPITT measurements) and September
15
1997 (GOME measurements) can reasonable be assumed to be comparable as both studies targeted El Ni ˜no conditions. These data reveal that the CO above Indonesia is strongly influenced by fires in Indonesia itself. It also indicates that significant amounts of CO in the Indian Ocean region originates in biomass burning taking place over Africa (Bremer et al.,2004). Although biomass burning emissions in Africa are quite plausible
20
as an explanation of O3 over the Indian Ocean, poor agreement between the GOME retrieved trace gas columns and model results for the region over the Indian Ocean be-tween 10 and 20◦S suggests that some additional source of pollution has still not been accounted for. Particulary in the upper troposphere lightning is a globally significant source of NOx. The total amount of lightning-NOx is still an issue of ongoing research
25
activity.
While the lifetime of NOx in the lower troposphere is too short to survive transport from Africa to the Indian Ocean (τ is in the order of hours), its lifetime in the upper tro-posphere is much longer (τ is in the order of days), (Jaegle et al.,1998;Kunhikrishnan
ACPD
5, 3105–3130, 2005 Tropospheric O3 over Indonesia A. Ladst ¨atter-Weißenmayer et al. Title Page Abstract Introduction Conclusions References Tables Figures J I J I Back CloseFull Screen / Esc
Print Version Interactive Discussion
EGU et al.,2004) and allows its effective transport. Climatological LIS and OTD data state
strong lightning activity over the Congo Basin in central Africa (Christian et al.,2003) for September.
To investigate whether the mixing of air masses influenced by lightning (yielding en-hanced NOx-levels) with air masses released from biomass burning (yielding enhanced
5
VOC levels) may have caused the observed enhancement of ozone, the 3-D-trajectory densities of both emission processes were combined.
Mixing by which ozone is possibly formed is assumed to take place when the tra-jectory density of air masses influenced by biomass burning (released from biomass burning over Indonesiam Africa and Australia) and the trajectory density of air masses
10
influenced by lightning are both nonzero in a certain grid cell.
Applying this criterion reveals that mixing is most intense over the Indian Ocean between 10 and 20◦S at altitudes between 600 and 200 hPa.
In this study, mixing is not quantitatively accounted for: If mixing is assumed to take place within a grid cell, the corresponding mixing state is set to unity, otherwise it
15
remains zero.
Integrating this mixing status over pressure and normalise it with the pressure dif-ference between ground an tropopause yields Fig.6. It shows a good agreement with GOME observations in this area and reveals that mixing is an important process which has to be accounted for when considering the tropospheric trace gas distribution.
20
3.2. Chemical modelling
The best agreement between modelled and GOME retrieved tropospheric O3, NO2 and formaldehyde columns is achieved using initial NMHC mixing ratios 20 times higher than those given in Table1along with a 20% higher methane mixing ratio. The resulting tropospheric columns for this model run are shown in Fig.7.
25
When considering the uncertainties of the joint transport and chemistry analysis, the differences between the modelled and retrieved tropospheric columns are to be considered as relatively small.
ACPD
5, 3105–3130, 2005 Tropospheric O3 over Indonesia A. Ladst ¨atter-Weißenmayer et al. Title Page Abstract Introduction Conclusions References Tables Figures J I J I Back CloseFull Screen / Esc
Print Version Interactive Discussion
EGU Although maxima in tropospheric O3, NO2 and formaldehyde columns are well
re-produced, the largest remaining discrepancies between the model and GOME results are in the special extent of NO2columns and the percistence of elevated formaldehyde columns above Indonesia.
The reason why the modelled NO2 columns cover smaller geographical areas than
5
observed by GOME may be caused by the overestimation of NO2loss from modelled air masses through irreversible deposition in the form of HNO3. Overestimation of HNO3deposition may, in turn, arise from an underestimation of OH loss via chemical reactions between OH and NMHC/VOCs. Higher OH concentrations enhance the con-tribution of the three-body reaction between OH, NO2and a collision partner leading to
10
formation of HNO3. Removal of HNO3from modelled air masses through deposition is then revealed as a decrease in the spacial extent of the modelled NO2columns.
Unusually short duration of modelled formaldehyde columns may arise from overesti-mation of the rate of chemical decomposition of formaldehyde. Reducing the formalde-hyde lifetime will reduce the distance formaldeformalde-hyde can be transported and will affect
15
the persistence of formaldehyde columns. Further work concerning the sources of these errors has been carried out and will be published separately. Given that pollution over Indonesia in September 1997 is largely generated by local fires, the total amount of ozone produced by these fires can be estimated by integrating time averaged ozone columns obtained as from BRAPHO.
20
Using the combined chemistry and transport models with air masses originating only above Indonesian fires and allowing 10 days for chemical processing, an estimated 3.1 Tg of ozone were produced by biomass burning in Indonesia for a month long period beginning 1 September 1997. In an earlier workLevine(1999) estimated that 7.1 Tg of ozone were produced over September and October 1997 (61 days). When
25
only accounting for the ozone production during September and assuming an equal ozone production for each day of this episode, due toLevine (1999) about 3.5 Tg of ozone were generated by the Indonesian fires. This value is in reasonable agreement with the value calculated in our study.
ACPD
5, 3105–3130, 2005 Tropospheric O3 over Indonesia A. Ladst ¨atter-Weißenmayer et al. Title Page Abstract Introduction Conclusions References Tables Figures J I J I Back CloseFull Screen / Esc
Print Version Interactive Discussion
EGU The difference may be due to the fact that the lifetime of VOC precursors of ozone
and of ozone itself is on the order of days to weeks (depending on the humidity of the surrounding air). Allowing the joint transport and chemistry analysis to account for the first 10 days after the release of the regarded air masses leads to an underestimation of the ozone production.
5
4. Conclusions
GOME measurements show that ozone columns over Indonesia in September 1997 reached up to 50 DU and were higher than the more typical background conditions of surrounding months and higher than values in September 1998. Trajectory anal-yses and the lack of differences in burning activity in Africa and Australia between
10
1997 and 1998, suggest that air masses from Africa and northern Australia do not contribute significantly to increased ozone columns over Indonesia, although they do contribute to ozone columns over the Indian Ocean between 10 and 20◦S. Trajectory analyses also suggest that air masses from biomass burning in Indonesia itself were only slowly transported away from this region and caused the unusually high ozone
15
columns observed by GOME. Chemical modeling reasonably reproduces O3, NO2and formaldeyde columns observed by GOME in the larger Indonesian region. Based on model results, the amount of ozone produced in a month long period in September 1997 over Indonesia itself is estimated to be 3.1 Tg, most of which is derived from biomass burning in Kalimantan and Sumatra. Enhanced tropospheric O3columns over
20
the Indian Ocean cannot be explained by biomass burning alone. Transport models in-dicate that the spatial distribution of the ozone maximum over the Indian Ocean is likely to be generated by mixing of air masses containing NOxderived from lightning over the Congo Basin and air masses containing VOCs derived from biomass burning.
Acknowledgements. The authors would like to thank B.-M. Sinnhuber, A.-M. Schmoltner and
25
T. Custer for fruitful discussions and ECMWF for providing meteorological data. Parts of this work have been funded by the University of Bremen, Germany, the DLR/DARA, the European
ACPD
5, 3105–3130, 2005 Tropospheric O3 over Indonesia A. Ladst ¨atter-Weißenmayer et al. Title Page Abstract Introduction Conclusions References Tables Figures J I J I Back CloseFull Screen / Esc
Print Version Interactive Discussion
EGU
Community, the European Space Agency (ESA) and the German Ministry of Education and Research BMBF under grant 07UFE12/8.
References
Arino, O., Melinotte, J.-M., Rosaz, J.-M., and Monjoux, E.: ESA Fire Product, Proceedings of the 7th ISPRS conference on Physical Measurement and Signatures in Remote Sensing,
5
Courchevel, 1997. 3110
Atkinson, R.: Atmospheric chemistry of VOCs and NOx, Atmos. Environ., 34, 2063–2101, 2000.
3107
Boersma, K. F., Eskes, H. J., and Brinksma, E. J.: Error Analysis for Tropospheric NO2Retrieval from Space, J. Geophys. Res., 109, D04311, doi:10.1029/2003JD003962, 2004. 3109
10
Bremer, H., Kar, J., Drummond, J. R., Nichitu, F., Zou, J., Liu, J., Gille, J. C., Deeter, M. N., Francis, G., Ziskin, D., and Warner, J.: Spatial and temporal variation of MOPITT CO in Africa and South America: A comparison with SHADOZ ozone and MODIS aerosol, J. Geophys. Res., 109, D12304, doi:10.1029/2003JD004234, 2004. 3115
Burrows, J. P., Weber, M., Buchwitz, M., Rozanov, V. V., Ladst ¨atter-Weißenmayer, A., Richter,
15
A., de Beek, R., Hoogen, R., Bramstedt, K., Eichmann, K.-U., Eisinger M., and Perner, D.: The Global Ozone Monitoring Experiment (GOME): Mission Concept and First Scientific Results, J. Atm. Sciences, 56, 151–175, 1999. 3108
Burrows, J. P., Richter, A., Weber, M., Eichmann, K.-U., Bramstedt, K., Ladst ¨atter-Weißenmayer, A., Wittrock, F., Eisinger M., and Hild, L.: Satellite observations of
tropo-20
spheric and stratospheric gases in Chemistry and Radiation Changes in the Ozone Layer, Kluwer Academic Publisher, 301–329, 2000. 3108
Carver, G. D., Brown P. D., and Wild, O.: The ASAD atmospheric chemistry integration package and chemical reaction database, Comput. Phys. Commun., 105, 2, 197–215, 1997. 3111
Chance, K., Palmer, P., Spurr, R. J. D., Martin, R. V., Kurosu T. P., and Jacob, D. J.: Satellite
25
observations of formaldehyde over North America from GOME, Geophys. Res. Lett., 27(21), 3461–3464, doi:10.1029/2000GL011857, 2000. 3108
Christian, H. J., Blakeslee, R. J., Boccippio, D. J., Boeck, W. L., Buechler, D. E., Driscoll, K. T., Goodman, S. J., Hall, J. M., Mach, D. M., and Stewart, M. F.: Global frequency and
distribu-ACPD
5, 3105–3130, 2005 Tropospheric O3 over Indonesia A. Ladst ¨atter-Weißenmayer et al. Title Page Abstract Introduction Conclusions References Tables Figures J I J I Back CloseFull Screen / Esc
Print Version Interactive Discussion
EGU
tion of lightning as observed from space by the Optical Transient Detector, J. Geophys. Res., 108(1), doi:10.1029/2002JD002347, 2003. 3110,3116
Crawford, J. H., Heald, C. L., Fuelberg, H. E., Morse, D. M., Sachse, G. W., Emmons, L. K., Gille, J. C., Edward, D. P., Deeter, M. N., Chen, G., Olson, J. R., Connors, V. S., Kittaka, C., and Hamlin, A. J.: Relationship between Measurements of Pollution in the Troposphere
5
(MOPITT) and in situ observations of CO based on a large-scale feature sampled during TRACE-P, J. Geophys. Res., 109, D15S04, doi:10.1029/2003JD004308, 2004. 3115
Crutzen, P. J., Heidt, L. E., Krasnec, J. P., Pollock, W. H., and Seiler, W.: Biomass burning as a source of atmospheric gases CO, H2, N2O, NO, CH3Cl and COS, Nature, 282, 253–256, 1979. 3106
10
Crutzen, P. J. and Andreae, M. O.: Biomass burning in the tropics: Impact on atmospheric chemistry and biochemical cycles, Science, 250, 1669–1677, 1990. 3106
GOME level 1 to 2 Algorithms Description, Deutsches Zentrum f ¨ur Luft- und Raumfahrt (DLR), Oberpfaffenhofen, Germany, Tech. Rep. ER-TN-DLR-GO-0025, Iss./Rev.2/A, DLR/SAO, 1996. 3108
15
Drummond, J. R. and Mand, G. S.: The measurement of pollution in the Troposphere (MOPITT) instrument: Overall performances and calibration requirements, J. Atmos. Ocean. Tech., 13, 314–320, 1996. 3115
Emmons, L. K., Hauglustaine, D. A., M ¨uller, J. F., Carroll, M. A., Brasseur, G. P., Brun-ner, D., Staehelin, J., Thouret, V., and Marenco, A.: Data composites of airbore
observa-20
tions of tropospheric ozone and its precursors, J. Geophys. Res., 105(16), 20 497–20 538, doi:10.1029/2000JD900232, 2000. 3112
Fishman, J., Hoell, J. M., Bendura, R. D., McNeal R. J., and Kirchhoff, V. W. J. H.: NASA GTE TRACE A Experiment (September–October 1992): Overview, J. Geophys. Res., 101(19), 23 865–23 879, 1996. 3112
25
Fujiwara, M., Tomikawa, Y., Kita, K., Kondo, Y., Komala, N., Saraspriya, S., Manik, T., Suripto, A., Kawakami, S., Ogawa, T., Kelana, E., Suhardi, B., Harijono, S. W. B., Kudsy, M., Sribi-mawati, T., and Yamanaka, M. D.: Ozonesonde observations in the Indonesian maritime continent: A case study on ozone rich layer in the equatorial upper troposphere, Atmos. Environ., 37, 353–362, 2003. 3110
30
Folland, C. K. and Parker, D. E.: Correction of instrumental biases in historical sea surface temperature data, Quart. J. Roy. Meteor. Soc., 121, 319–367, 1995. 3107
ACPD
5, 3105–3130, 2005 Tropospheric O3 over Indonesia A. Ladst ¨atter-Weißenmayer et al. Title Page Abstract Introduction Conclusions References Tables Figures J I J I Back CloseFull Screen / Esc
Print Version Interactive Discussion
EGU
Jaegle, L., Wang, Y., Weinheimer, A. J., Ridley, B. A., Campos, T. L., Sachse, G. W., and Hagen, D. E.: Sources and chemistry of NOx in the upper troposphere over the United States, Geophys. Res. Lett., 25(10), 1709–1712, doi:10.1029/98GL00041, 1998. 3115
Kunhikrishnan, T., Lawrence, M. G., von Kuhlmann, R., Richter, A., Ladst ¨atter-Weißenmayer, A., and Burrows, J. P.: Semiannual NO2plumes during the monsoon transition periods over
5
the central Indian Ocean, Geophys. Res. Lett., 31, L08110, doi:10.1029/2003GL019269, 2004. 3114,3115
Ladst ¨atter-Weißenmayer, A., Burrows, J. P., and Perner, D.: Biomass burning over Indonesia as observed by GOME, Earth Obs. Quart., 58, 28–29, 1998. 3108,3109
Ladst ¨atter-Weißenmayer, A., Meyer-Arnek, J., Schlemm, A., and Burrows, J. P.: Influence of
10
stratospheric airmasses on tropospheric vertical O3columns based on GOME (Global Ozone Monitoring Experiment) measurements and backtrajectory calculation over the Pacific, At-mos. Chem. Phys., 4, 903–909, 2004,
SRef-ID: 1680-7324/acp/2004-4-903. 3108,3109
Lawrence, M. G., von Kuhlmann, R., Salzmann, M., and Rasch, P. J.: The balance of
ef-15
fects of deep convective mixing on tropospheric ozone, Geophys. Res. Lett, 30, 1940, doi.10.1029/2003GL017644, 2003. 3114
Leue, C., Wenig, M., Wagner, T., Klimm, O., Platt, U., and J ¨ahne, B.: Quantitative analysis of NOx emissions from GOME satellite image sequences, J. Geophys. Res., 106(6), 5493– 5505, doi:10.1029/2000JD900572, 2001. 3108
20
Levine, J. S., Cofer, W. R., Cahoon, D. R., and Winstead, E. L.: Biomass burning: A Driver for Global Change, Environ. Sci. Technol., 29, 3, 120A–125A, 1995. 3106
Levine, J. S.: The 1997 fires in Kalimantan and Sumatra, Indonesia: Gaseous and particulate emissions, Geophys. Res. Lett., 26(7), 815–818, doi:10.1029/1999GL900067, 1999. 3106,
3117
25
Martin, R. V., Chance, K., Jacob, D. J., Kurosu, T. P., Spurr, R. J. D., Bucsela, E., Gleason, J. F., Palmer, P. I., Bey, I., Fiore, A. M., Li, Q., Yantosca, R. M., and Koelmeijer, R. B. A.: An improved retrieval of tropospheric nitrogen dioxide from GOME, J. Geophys. Res., 107(20), doi:10.1029/2001JD001027, 2002. 3108
Meyer-Arnek, J.: Qualitative und quantitative Analyse einer Episode erh ¨ohter Spurengass ¨aulen
30
im September 1997, Institute for Environmental Physics, University of Bremen, Bremen, 2004. 3111,3113
ACPD
5, 3105–3130, 2005 Tropospheric O3 over Indonesia A. Ladst ¨atter-Weißenmayer et al. Title Page Abstract Introduction Conclusions References Tables Figures J I J I Back CloseFull Screen / Esc
Print Version Interactive Discussion
EGU
E.-G., Meyer, C. P., Lathrop, J. A., Johnson, B. J., Shadwick, D. S., Cuevas, E., Schmidlin, F. J., Tarasick, D. W., Claude, H., Kerr, J. B., Uchino, O., and Mohnen, V.: Trends of Ozone in the Troposphere, Geophys. Res. Lett., 25(2), 139–142, 1998. 3107
Palmer, P. I., Jacob, D. J., Fiore, A. M., Martin, R. V., Chance, K., and Kurosu, T. P.: Mapping iso-prene emissions over North America using formaldehyde columns observations from space,
5
J. Geophys. Res., 108(6), 4180, doi:10.1029/2002JD002153, 2003. 3108
Richter, A. and Burrows, J. P.: Retrieval of tropospheric NO2from GOME measurements, Adv. Space Res., 29(11), 1673–1683, 2002. 3108,3109
Rozanov, V., Diebel, D., Spurr, R. J. D., and Burrows, J. P.: GOMETRAN: A radiative transfer model for the satellite project GOME – the plance parallel version, J. Geophys. Res., 102(14),
10
16 683–16 695, doi:10.1029/96JD01535, 1997. 3109
Saunders, S. M., Jenkin, M. E., and Derwent, R. G.: Protocol for the development of the Master Chemical Mechanism, MCM v3, Atmos. Chem. Phys., 3, 161–180, 2003,
SRef-ID: 1680-7324/acp/2003-3-161. 3112
Seiler, W. and Crutzen, P. J.: Estimates of gross and net fluxes of carbon between the biosphere
15
and the atmosphere from biomass burning, Climatic Change, 2, 207–247, 1980. 3106
Thomas, W., Hegels, E., Slijkhuis, S., Spurr, R. J. D., and Chance, K.: Detection of biomass burning combustion products in Southeast Asia from backscatter data taken by the GOME spectrometer, Geophys. Res. Lett., 25(9), 1317–1320, doi:10.1029/98GL01087, 1998. 3108
Thompson, A. M., Witte, J. C., McPeters, R. D., Oltmans, S. J., Schmidlin, F. J., Logan, J. A.,
20
Fujiwara, M., Kirchhoff, V. W. J. H., Posny, F., Coetzee, G. J. R., Hoegger, B., Kawakami, S., Ogawa, T., Johnson, B. J., V ¨omel, H., and Labow, G.: Southern Hemisphere Additional Ozonesondes (SHADOZ) 1998–2000 tropical ozone climatology. 1. Comparison with Total Ozone Mapping Spectrometer (TOMS) and ground-based measurements, J. Geophys. Res., 108(2), doi:10.1029/2001JD000967, 2003. 3109
ACPD
5, 3105–3130, 2005 Tropospheric O3 over Indonesia A. Ladst ¨atter-Weißenmayer et al. Title Page Abstract Introduction Conclusions References Tables Figures J I J I Back CloseFull Screen / Esc
Print Version Interactive Discussion
EGU
Table 1. Chemical initialisation of the photochemical boxmodel for modelling the chemistry of
airmasses being released from biomass burning over Indonesia.
Specie VMR [ppb] O3 72.000 CO 1285.000 CH4 2028.000 NO 0.970 CH3OOH 16.685 HCHO 6.907 C2H6 31.958 C2H2 19.360 C3H8 4.267
ACPD
5, 3105–3130, 2005 Tropospheric O3 over Indonesia A. Ladst ¨atter-Weißenmayer et al. Title Page Abstract Introduction Conclusions References Tables Figures J I J I Back CloseFull Screen / Esc
Print Version Interactive Discussion
EGU
A. Ladst¨atter-Weißenmayer: Tropospheric O3 over Indonesia 3
Fig. 1. Monthly mean tropospheric vertical columns of O3, NO2and formaldehyde (given in DU (Dobson Units), 1014molecules cm−2 respectively 1016molecules cm−2) as retrieved from GOME measurements performed in September 1997 (upper row) and September 1998 (lower row).
Fig. 2. Time series of the tropospheric vertical column of ozone over Watukosek, Java, for the time period between 1997 and 1998 measured by both SHADOZ-O3-sonde and GOME.
fire index, shown in Figure 3, is generated for both episodes. Biomass burning in Indonesia was much stronger in Septem-ber 1997 than in SeptemSeptem-ber 1998. In contrast, biomass burn-ing over the southern parts of Africa and the northern parts of Australia both show no significant difference in intensity or spatial distribution when comparing September 1997 to September 1998.
When accounting for air pollution in the tropical regions, lightning cannot be omitted since it is an important source of nitrogen oxides especially in the upper troposphere. Due to the fact that its intensity is strongly enhanced in equato-rial regions, a multiannual climatology based on the Light-ning Imaging Sensor (LIS) and the Optical Transient Detec-tor (OTD) (Christian et al., 2003) is applied.
Fire Index SEP 1997
Fire Index SEP 1998
Fig. 3. Fire index as derived from ATSR hotspot data for September
1997 and September 1998.
2.2 Trajectory analysis and chemistry modelling
To determine which air masses contribute biomass burning pollutants to the Indonesian region during this episode, the trajectory model Traj.x, developed at the Institute of Envi-ronmental Physics, University of Bremen was used. Traj.x is a kinematic trajectory model which calculates the transport of air parcels along wind fields by applying a fourth-order Runge-Kutta scheme. The meteorological data were taken from the European Centre for Medium-Range Weather Fore-casts (ECMWF)’s 40-year reanalysis data set (ERA-40).
For each day in September 1997 and 1998, trajectories Fig. 1. Monthly mean tropospheric vertical columns of O3, NO2and formaldehyde (given in DU (Dobson Units), 1014molecules cm−2respectively 1016molecules cm−2) as retrieved from GOME measurements performed in September 1997 (upper row) and September 1998 (lower row).
ACPD
5, 3105–3130, 2005 Tropospheric O3 over Indonesia A. Ladst ¨atter-Weißenmayer et al. Title Page Abstract Introduction Conclusions References Tables Figures J I J I Back CloseFull Screen / Esc
Print Version Interactive Discussion
EGU
Fig. 2. Time series of the tropospheric vertical column of ozone over Watukosek, Java, for the
ACPD
5, 3105–3130, 2005 Tropospheric O3 over Indonesia A. Ladst ¨atter-Weißenmayer et al. Title Page Abstract Introduction Conclusions References Tables Figures J I J I Back CloseFull Screen / Esc
Print Version Interactive Discussion
EGU Fire Index SEP 1997
Fire Index SEP 1998
Fig. 3. Fire index as derived from ATSR hotspot data for September 1997 and September
ACPD
5, 3105–3130, 2005 Tropospheric O3 over Indonesia A. Ladst ¨atter-Weißenmayer et al. Title Page Abstract Introduction Conclusions References Tables Figures J I J I Back CloseFull Screen / Esc
Print Version Interactive Discussion
EGU
Fig. 4. Trajectory density of air masses being released from biomass burning in Africa,
ACPD
5, 3105–3130, 2005 Tropospheric O3 over Indonesia A. Ladst ¨atter-Weißenmayer et al. Title Page Abstract Introduction Conclusions References Tables Figures J I J I Back CloseFull Screen / Esc
Print Version Interactive Discussion
EGU
Fig. 5. Total column of CO in 1018molecules cm−2 as measured by MOPITT performed in September 2002.
ACPD
5, 3105–3130, 2005 Tropospheric O3 over Indonesia A. Ladst ¨atter-Weißenmayer et al. Title Page Abstract Introduction Conclusions References Tables Figures J I J I Back CloseFull Screen / Esc
Print Version Interactive Discussion
EGU
Fig. 6. Intensity of mixing of air masses influenced by lightning activity over the Congo Basin
with air masses emerging from biomass burning regions over Africa or Indonesia. Unit: Fraction of tropospheric bins in which mixing was taking place.
ACPD
5, 3105–3130, 2005 Tropospheric O3 over Indonesia A. Ladst ¨atter-Weißenmayer et al. Title Page Abstract Introduction Conclusions References Tables Figures J I J I Back CloseFull Screen / Esc
Print Version Interactive Discussion
EGU
Fig. 7. Modelled tropospheric column of monthly mean ozone (background of 21 DU is already added) in DU, tropospheric column of NO2 in 1014molecules cm−2 (background of 2.5·1014molecules cm−2 is already added) and tropospheric formaldehyde column in 1016molecules cm−2.