HAL Id: hal-01053420
https://hal.archives-ouvertes.fr/hal-01053420
Submitted on 6 Aug 2014
HAL is a multi-disciplinary open access
archive for the deposit and dissemination of
sci-entific research documents, whether they are
pub-lished or not. The documents may come from
teaching and research institutions in France or
abroad, or from public or private research centers.
L’archive ouverte pluridisciplinaire HAL, est
destinée au dépôt et à la diffusion de documents
scientifiques de niveau recherche, publiés ou non,
émanant des établissements d’enseignement et de
recherche français ou étrangers, des laboratoires
publics ou privés.
Imaging of Shear Waves Induced by Lorentz Force in
Soft Tissues
Pol Grasland-Mongrain, Rémi Souchon, Florian Cartellier, Ali Zorgani,
Jean-Yves Chapelon, Cyril Lafon, Stefan Catheline
To cite this version:
Pol Grasland-Mongrain, Rémi Souchon, Florian Cartellier, Ali Zorgani, Jean-Yves Chapelon, et al..
Imaging of Shear Waves Induced by Lorentz Force in Soft Tissues. Physical Review Letters, American
Physical Society, 2014, 13, pp.038101. �10.1103/PhysRevLett.113.038101�. �hal-01053420�
P Grasland-Mongrain,∗ R Souchon, F Cartellier, A Zorgani, JY Chapelon, C Lafon, and S Catheline
Inserm, U1032, LabTau, Lyon, F-69003, France ; Universit´e de Lyon, Lyon, F-69003, France
This study presents the first observation of elastic shear waves generated in soft solids using a dynamic electromagnetic field. The first and second experiments of this study showed that Lorentz 5
force can induce a displacement in a soft phantom and that this displacement was detectable by an ultrasound scanner using speckle-tracking algorithms. For a 100 mT magnetic field and a 10 ms, 100 mA peak-to-peak electrical burst, the displacement reached a magnitude of 1 µm. In the third experiment, we showed that Lorentz force can induce shear waves in a phantom. A physical model using electromagnetic and elasticity equations was proposed. Computer simulations were in good 10
agreement with experimental results. The shear waves induced by Lorentz force were used in the last experiment to estimate the elasticity of a swine liver sample.
PACS numbers: *43.20.Gp, *43.20.Jr
Keywords: shear wave, lorentz force, soft solid, elastography
The displacement of a conductor in a magnetic field 15
induces eddy currents. Conversely, the application of an electrical current in a conductor placed in a magnetic field induces a displacement due to Lorentz force [1]. These two phenomena are currently investigated to pro-duce medical images [2]. In the technique called Lorentz 20
Force Electrical Impedance Tomography [3], also known as Magneto-Acoustical Electrical Tomography [4], an ul-trasound beam is focused in a tissue placed in a magnetic field. The displacement of the tissue due to ultrasound in a magnetic field induces an electrical current. The cur-25
rent is measured using electrodes and has been used to produce tissue electrical conductivity interface images. In a “reverse” mode, injecting an electrical current in a tissue placed in a magnetic field induces a displacement due to Lorentz force. As in the megahertz range, shear waves de-30
cay over a few micrometers, the displacement propagates only through compression waves. These waves can be de-tected using ultrasound transducers to produce electrical conductivity images. One implementation of this method is called Magneto-Acoustic Tomography with Magnetic 35
Induction [5].
We hypothesized in this study that applying a low fre-quency (10-1000 Hz) electrical current through a tissue placed in a magnetic field would produce a shear wave within the medium. This could notably have applica-40
tions in shear wave elastography [6], [7], [8], a medical imaging technique used to map the mechanical prop-erties of biological tissues. The mechanical propprop-erties of biological tissues are known to be viscoelastic (hence frequency-dependent) [9], [10], [11], often anisotropic, e.g. 45
along muscle fibers [12], and nonlinear (changing with pre-stress). However, in the field of medical imaging, most applications rely on a simple model, assuming an elastic isotropic linear solid. The viscoelasticity effect has been shown to have only second effect orders [13] and the 50
synthetic phantoms as used in this study can reasonably be considered as fully isotropic and linear [14], [15]. Un-der these assumptions, tissue elasticity can be described
by two parameters only, e.g. the shear modulus µ and Poisson’s ratio. The shear modulus is related to the shear 55
wave speed vs and the density of the medium ρ by the
equation µ = ρv2
s. The linear elasticity of the biological
tissue can thus be estimated using this relation by induc-ing a shear wave in the medium and measurinduc-ing its speed in each location. Nowadays techniques use an external 60
vibrator [6], [7], or acoustic radiation force [8] to induce this shear wave. A new way to perform elastography measurements could thus be made possible by demon-strating the ability of the Lorentz force to induce shear waves.
65
This study was based on four experiments. The first one aimed to show that the Lorentz force could induce a displacement in a soft solid and that this displacement could be detected in ultrasound images. The second experiment proved that the observed displacement was 70
induced by Lorentz force by discarding other potential sources. The purpose of the third experiment was to in-duce shear waves by Lorentz force and to compare it with the results of a simulation based on a physical model. The last experiment applied the phenomenon of shear 75
waves induced by Lorentz force to perform elastography measurements in a biological tissue.
The X axis was defined as the direction of the magnetic field, the Z axis as the main ultrasound propagation axis and the Y axis was placed according to the right-hand 80
rule, as illustrated in Fig. 1.
In the experiments, a voltage ∆V was first applied between two electrodes, leading to an electrical field E= −∇V. In a tissue of electrical conductivity σ placed between the electrodes, according to Ohm’s law the den-85
sity of current j was equal to σE. Under the assump-tions discussed previously (elastic linear isotropic solid), Navier’s equation governed the displacement u in each point of the tissue submitted to the body force f [16], [17]: 90 ρd 2u dt2 = (K + 4 3µ)∇(∇.u) + µ∇ × (∇ × u) + f (1)
2 where ρ is the medium density, u the local displacement,
t the time, K the bulk modulus and µ the shear modu-lus. In our case, the medium was electrically neutral and its magnetic permeability was close to one [18], so we re-placed the external force by the Lorentz force f = j × B 95
where B is the magnetic field [19]. The displacements
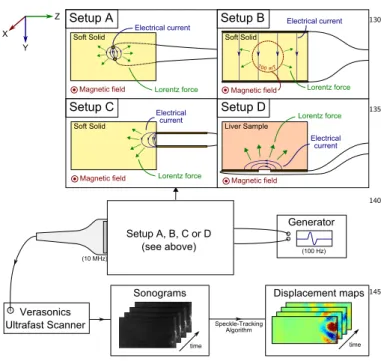
Generator Verasonics Ultrafast Scanner X Y Z Speckle-Tracking Algorithm Displacement maps time time Sonograms (100 Hz) (10 MHz) Soft Solid
Magnetic field Lorentz force
Electrical current Setup A Setup A, B, C or D (see above) Soft Solid Electrical current Lorentz force Setup C Magnetic field Liver Sample Setup D Electrical current Lorentz force Magnetic field Soft Solid
Magnetic field Lorentz force
Electrical current
Setup B 100 mT
FIG. 1. Experimental setup scheme. An electrical current was applied through two planes electrodes in a soft solid placed in a magnetic field. This induced displacements observed with an ultrasound probe.
were observed in the experiment as illustrated in Fig. 1. The components of the apparatus were as follows: a 100
permanent magnet, a conductive medium, two electrodes and an ultrasonic scanner.
The magnetic field was created by a U-shaped mag-net with each pole composed by two 3x5x5 cm3 NdFeB
magnets, which produced a locally homogenous magnetic 105
field of 300 ± 50 mT in a volume of 4x4x4 cm3. A single
sine cycle of 100 Hz with an amplitude of 80 V peak-to-peak signal was delivered by a generator (AFG 3022B, Tektronix, Beaverton, OR, USA) and an amplifier (A500, Behringer, Willich, Germany). The signal was applied 110
on two wire copper electrodes placed in the middle of a XZ side of a tissue-mimicking phantom. A 1 Ω resis-tor was placed between the generaresis-tor and an electrode. Current flowing through the phantom was estimated by measuring the voltage across the resistor, and was typi-115
cally between 100 and 200 mA. The medium was a 4x8x8 cm3water-based phantom made from 5% polyvinyl
alco-hol, 0.1 % graphite powder and 1% salt. Three freez-ing/defreezing cycles were applied to stiffen the material [20]. The graphite powder was made of submillimeter 120
particles which presented a speckle pattern on the ultra-sound images. The medium was observed with a 10 MHz
ultrasonic probe made of 128 elements and a Verason-ics scanner (VerasonVerason-ics V-1, Redmond, WA, USA). The probe was used in ultrafast mode [8], acquiring 1000 ul-125
trasound frames per second. The Z component of the displacement in the medium (“Z-displacement”) was ob-served by performing cross-correlations between radiofre-quency images with a speckle-tracking technique. Al-though the wavelength was approximately equal to 150 130
µm, this technique was capable of measuring displace-ments under the micrometer size. To remove high fre-quency noise, displacement images were filtered by set-ting to zero all frequencies above 200 Hz in the Fourier transform of the displacement over time of each pixel. 135
This setup, called thereafter Setup A, was designed to have a localized electrical current and a uniform magnetic field.
The Z-displacement observed 5 ms after current injec-tion is illustrated in Fig. 2-(A). It is possible to observe a 140
localized displacement occurring between the electrodes, where the current density is highest.
A second setup, the Setup B, was designed to have a uniform electrical current and a localized magnetic field. The magnet was replaced by a 1x2x1 cm3NdFeB
mag-145
net which produced a 100 ± 50 mT magnetic field in a 2x2x2 cm3
volume in the phantom. Two flat electrodes were placed on the top and the bottom side of the phan-tom.
The Z-displacement observed 5 ms after current injec-150
tion is illustrated in Fig. 2-(B). This map shows a 0.5 µm displacement in presence of magnetic field, proving that this displacement was not due to global motion of the electrodes. Moreover, the root-mean-square of the displacement values was equal to 0.5 µm, while the same 155
apparatus without any magnetic field gave a root-mean-square value of 0.1 µm. Amplitude of displacements in-duced by Lorentz force was consequently at least five times higher than the one due to any other phenomenon like tissue expansion due to heating by Joule effect. This 160
experiment thus showed that it was indeed the Lorentz force which induced the observed displacement in a soft solid.
The Setup C was then designed to observe the propa-165
gation of displacements as shear waves.
We used the 300 mT magnet and two 4x0.1x10 cm3
planes parallel electrodes, separated by a gap of 1 cm. Their tip was in contact with the medium in order to localize the electrical current near a border. The shear 170
wave propagation can be described by taking the curl of equation (1), with s = ∇ × u: ds2 dt2 = µ ρ∇s+ 1 ρ∇ ×(j × B) (2)
By using vectorial identity: ∇ × (j × B) = (∇.B)j − (∇.j)B + (B.∇)j − (j.∇)B and the second Maxwell equa-tion ∇.B = 0 and by noting that ∇.j = 0 when charges 175
Displacementfmapfatftf=f5fms PositionfZfummA P o s it io n fY fum m A 10 20 30 40 50 60 −10 −5 0 5 10 µm−1 0 1 100fmT Displacementfmapfatftf=f5fms PositionfZfummA P o s it io n fY fum m A 10 20 30 40 50 60 70 80 −10 0 10 µm−2 0 2 SoftfSolid Magneticffield Lorentzfforce Electricalfcurrent SetupfA SoftfSolid Magneticffield Lorentzfforce Electricalfcurrent SetupfB 1 00 mT
uBA
uAA
FIG. 2. (A) Z-displacement map in the YZ plane in the ho-mogenous phantom with a localized electrical current with Setup A, 5 ms after current injection. The electrodes’ loca-tions are circled in black. The expected electrical current lines are drawn with blue lines. Displacement reached an amplitude of 2 µm in the electrical current location. (B) Z-displacement map in the YZ plane in the homogenous phantom with a local-ized magnetic field with Setup B, 5 ms after current injection. An isopotential magnetic field lines is drawn in red dots. Dis-placement reached an amplitude of 1 µm in the magnetic field location.
do not accumulate [16], we get the equation: ds2 dt2 = µ ρ∆s − 1 ρ(B.∇)j − 1 ρ(j.∇)B (3)
This equation shows that shear motion, described as the curl of the displacement, is created by the variations of j along magnetic field B direction (as in Setup A), and equivalently by the variations of B along density current j 180
direction (as in Setup B). To model the experiment quan-titatively, the Eq. 1 was solved using a Green function Gkz(r, t; rs, ts) with r the observation point coordinate,
tthe time of observation, rsposition of the source of the
body force, tstime of occurrence and k the direction of
185
the Lorentz force (supposed to be in the YZ plane) [17]. The Z-displacement uz(r, t) created by a force f was
cal-culated using Gkz(r, t; rs, ts): uz(r, t) = Z t ZZZ V f(rs, ts) ⊗ Gkz(r, t; rs, ts)d3rsdts (4)
Given the complexity of the Green’s function in solids, Eq. 4 was computed numerically in a particular case as 190
follows. We modeled two thin parallels electrodes hav-ing a respective lineic charge +λ(t) and −λ(t), of length
2l and separated by a distance 2a. The medium was modeled as an infinite medium with a uniform electri-cal conductivity and we neglected all boundary effects. 195
The electrical field created by the two electrodes was cal-culated in a 2D plane. The Z-component of the Lorentz force was then deduced from its expression combined with Ohm’s law: fz(y, z) = σBλ[((y−al−z)2+ 1)−
1 2 + ((y+a l−z) 2+ 1)−12 + ((y−a l+z) 2 + 1)−12 + ((y+a l+z) 2 + 1)−12]. The follow-200
ing values were used : 2l = 0.1 m, 2a = 0.01 m, σBλ = cos(2πνt) with ν = 100 Hz if 0 < t < 10 ms and σBλ = 0 otherwise. The solution of equation (1) with this expres-sion of the force was then computed numerically, using a compression wave speed of 1480 m.s−1 and a shear wave
205
speed of 1.3 m.s−1, corresponding to a medium density ρ
of 1000 kg.m−3 and a bulk modulus K of 2.2 GPa.
Normalized Z-displacement maps observed 5, 15, 25 and 35 ms after current injection as given by the ex-periment and the simulation are illustrated in Fig. 3. 210
To have a more quantitative comparison, the experiment and simulation results along two lines are plotted, the first along the Z axis between the two electrodes and the second along the Y axis respectively 2, 10, 18 and 26 mm away from the electrodes. The maximum displace-215
ment found by the experiment was equal to 2 µm. The displacement propagation speed was equal to 1.3 m.s−1
and was in line with reported shear wave speeds in soft solid. Displacements parallel to the direction of propa-gation were also observed, which is a typical near field 220
feature [21]. Differences in the waves trail observable at time t = 35 ms were interpreted as the consequence of the approximation of infinite medium in the Green function calculation which did not take into account any bound-ary effect of the medium, especially the rigid contact with 225
the electrodes. Good general agreement was however ob-served between experiment and simulation, qualitatively and quantitatively.
The purpose of the Setup D was to induce shear waves due to Lorentz force in a biological sample.
230
The sample was a 3x3x3 cm3 lobe of swine liver cube,
unfrozen in a 1 % salt at 20oC solution. As the ultrasound
attenuation of this tissue was high, displacement was dif-ficult to compute farther than one centimeter from the transducer. The two electrodes were consequently posi-235
tioned under the sample, separated by a gap of 1 cm, in order to see the propagation of shear waves along the Y axis over a few centimeters.
Z-displacement maps observed 15, 20, 25 and 30 ms after current injection are illustrated in Fig. 4. The 240
maximum displacement was equal to 0.2 µm. Shear waves propagated at a velocity of 1.4 ± 0.2 m.s−1.
Es-timating the elasticity with µ = ρv2
s relationship gave
a shear modulus of 2.0 ± 0.6 kPa. This value is in ex-cellent agreement with in-vivo measurements in healthy 245
human liver with magnetic resonance elastography mea-surements [22]. This indicated that the technique has the
4 tc=c15cms tc=c25cms −1 −0.5 0 0.5 1 tc=c35cms PositioncZcCmmM P o s it io n cY cCm m M 20 30 40 50 60 70 −10 −5 0 5 10 tc=c15cms P o s it io n cY cCm m M −10 −5 0 5 10 tc=c5cms P o s it io n cY cCm m M −10 −5 0 5 10 -1 0 1 NormalizedcZ-displacement amplitudecalongcZcaxiscplot NormalizedcZ-displacement amplitudecalongcYcaxiscplot NormalizedcZ-displacement amplitudecmapcCexperimentM tc=c25cms P o s it io n cY cCm m M −10 −5 0 5 10 Experiment Simulation PositioncZcCmmM −10 −5PositioncYcCmmM 0 5 10 -1 0 1 -1 0 1 -1 0 1 Experiment Simulation 0 0.5 1 -1 0 1 -1 0 1 -1 0 1 20 30 40 50 60 70 PositioncZcCmmM 20 30 40 50 60 70 tc=c35cms tc=c5cms NormalizedcZ-displacement amplitudecmapcCsimulationM tc=c35cms tc=c15cms tc=c5cms tc=c25cms tc=c35cms tc=c15cms tc=c5cms tc=c25cms SoftcSolid Electrical current Lorentzcforce SetupcC Magneticcfield
FIG. 3. Z-displacement maps in the YZ plane in the homogenous medium with Setup C, respectively 5, 15, 25 and 35 ms after current injection, as given by the experiment and the simulation. Experimental and simulated values are plotted along a Z axis and a Y axis at different depths (respectively 68, 60, 52 and 46 mm away from transducer). Shear waves propagating at 1.3
potential to be applied in biological tissues. Position Z (mm) 5 10 15 20 25 30 P os iti on Y (m m ) −10 −5 0 5 10 −0.1 −0.05 0 0.05 0.1 Position Z (mm) 5 10 15 20 25 30 P os iti on Y (m m ) −10 −5 0 5 10 t = 30 ms t = 15 ms t = 20 ms t = 25 ms Liver Sample Setup D Electrical current Lorentz force Magnetic field µm
FIG. 4. Z-displacement map in the YZ plane in the liver medium with Setup D, respectively 15, 20, 25 and 30 ms after current injection.
These four experiments demonstrated that (1) Lorentz force can induce displacements in soft tissues and these 250
displacements are observable with an ultrasound scanner, (2) the Lorentz force can be used to generate shear waves, and (3) this phenomenon can be used to perform shear wave elastography measurements in biological tissues.
The typical displacement was at the micrometer scale, 255
close to the sensitivity of magnetic resonance elastogra-phy [6] and ultrasound elastograelastogra-phy [23]. The electrical current, estimated at 100 mA, was about a hundred time higher than the highest current tolerated in the human body according to international standards [24]. However, 260
the magnetic field strength of a magnetic resonance imag-ing system, ten times higher than the one used here, could increase the observed amplitude. One particular advan-tage of this principle lies in the possibility of inducing dis-placement remotely, either by applying directly the elec-265
trical current by electrodes or by inducing it with a time-varying magnetic field. Another advantage lies in the possibility to choose precisely the shear wave source fre-quency, closely related to the emitted current frequency. It would have interest for studying the properties of the 270
soft solids at different frequencies.
Additional materials (Z-displacement maps videos of the experiments) are available on-line.
∗ pol.grasland-mongrain@ens-cachan.org
[1] J. D. Jackson, Classical Electrodynamics, 3rd ed. (John 275
Wiley and Sons, 1998).
[2] H. Wen, J. Shah, and R. S. Balaban, Biomedical Engi-neering, IEEE Transactions on 45, 119 (1998).
[3] P. Grasland-Mongrain, J.-M. Mari, J.-Y. Chapelon, and C. Lafon, Innovation and Research in BioMedical engi-280
neering 34, 357 (2013).
[4] Y. Xu and B. He, Physics in medicine and biology 50, 5175 (2005).
[5] G. Hu, E. Cressman, and B. He, Applied physics letters
98, 023703 (2011).
285
[6] R. Muthupillai, D. Lomas, P. Rossman, J. Greenleaf, A. Manduca, and R. Ehman, Science 269, 1854 (1995). [7] L. Sandrin, B. Fourquet, J.-M. Hasquenoph, S. Yon, C. Fournier, F. Mal, C. Christidis, M. Ziol, B. Poulet, F. Kazemi, et al., Ultrasound in medicine & biology 29, 290
1705 (2003).
[8] J. Bercoff, M. Tanter, and M. Fink, Ultrasonics, Ferro-electrics and Frequency Control, IEEE Transactions on
51, 396 (2004).
[9] X. Yang and C. C. Church, Ultrasonics, Ferroelectrics 295
and Frequency Control, IEEE Transactions on 53, 1404 (2006).
[10] S. Catheline, J.-L. Gennisson, G. Delon, M. Fink, R. Sinkus, S. Abouelkaram, and J. Culioli, The Journal of the Acoustical Society of America 116, 3734 (2004). 300
[11] S. Nasseri, L. E. Bilston, and N. Phan-Thien, Rheologica acta 41, 180 (2002).
[12] J.-L. Gennisson, S. Catheline, S. Chaffaı, and M. Fink, The Journal of the Acoustical Society of America 114, 536 (2003).
305
[13] T. Deffieux, G. Montaldo, M. Tanter, and M. Fink, Med-ical Imaging, IEEE Transactions on 28, 313 (2009). [14] S. Catheline, J.-L. Gennisson, and M. Fink, The Journal
of the Acoustical Society of America 114, 3087 (2003). [15] J.-L. Gennisson, M. R´enier, S. Catheline, C. Barri`ere, 310
J. Bercoff, M. Tanter, and M. Fink, The Journal of the Acoustical Society of America 122, 3211 (2007). [16] B. J. Roth, P. J. Basser, and J. P. Wikswo, IEEE
trans-actions on biomedical engineering 41, 723 (1994). [17] K. Aki and P. G. Richards, Quantitative seismology 315
(Freeman San Francisco, 1980).
[18] I. Brigadnov and A. Dorfmann, International Journal of Solids and Structures 40, 4659 (2003).
[19] D. J. Steigmann, Mathematics and Mechanics of Solids
14, 390 (2009).
320
[20] J. Fromageau, E. Brusseau, D. Vray, G. Gimenez, and P. Delachartre, Ultrasonics, Ferroelectrics and Frequency Control, IEEE Transactions on 50, 1318 (2003). [21] S. Catheline, F. Wu, and M. Fink, The Journal of the
Acoustical Society of America 105, 2941 (1999). 325
[22] O. Rouviere, M. Yin, M. A. Dresner, P. J. Rossman, L. J. Burgart, J. L. Fidler, and R. L. Ehman, Radiology 240, 440 (2006).
[23] K. Nightingale, M. S. Soo, R. Nightingale, and G. Tra-hey, Ultrasound in medicine & biology 28, 227 (2002). 330
[24] International Electrical Commission, Effects of current on human beings and livestock 60479 (1994).