HAL Id: hal-00302145
https://hal.archives-ouvertes.fr/hal-00302145
Submitted on 26 Sep 2006HAL is a multi-disciplinary open access
archive for the deposit and dissemination of sci-entific research documents, whether they are pub-lished or not. The documents may come from teaching and research institutions in France or abroad, or from public or private research centers.
L’archive ouverte pluridisciplinaire HAL, est destinée au dépôt et à la diffusion de documents scientifiques de niveau recherche, publiés ou non, émanant des établissements d’enseignement et de recherche français ou étrangers, des laboratoires publics ou privés.
Measurements of O3, NO2 and BrO at the Kaashidhoo
Climate Observatory (KCO) during the INDOEX
(INDian Ocean EXperiment) Campaign using ground
based DOAS (Differential Optical Absorption
Spectroscopy) and satellite based GOME (Global Ozone
Monitoring Experiment) data
A. Ladstätter-Weißenmayer, H. Altmeyer, M. Bruns, A. Richter, A. Rozanov,
V. Rozanov, F. Wittrock, J. P. Burrows
To cite this version:
A. Ladstätter-Weißenmayer, H. Altmeyer, M. Bruns, A. Richter, A. Rozanov, et al.. Measurements of O3, NO2 and BrO at the Kaashidhoo Climate Observatory (KCO) during the INDOEX (INDian Ocean EXperiment) Campaign using ground based DOAS (Differential Optical Absorption Spectroscopy) and satellite based GOME (Global Ozone Monitoring Experiment) data. Atmospheric Chemistry and Physics Discussions, European Geosciences Union, 2006, 6 (5), pp.9273-9296. �hal-00302145�
ACPD
6, 9273–9296, 2006 O3 and NO2over Kaashidhoo A. Ladst ¨atter-Weißenmayer et al. Title Page Abstract Introduction Conclusions References Tables Figures J I J I Back CloseFull Screen / Esc
Printer-friendly Version
Interactive Discussion Atmos. Chem. Phys. Discuss., 6, 9273–9296, 2006
www.atmos-chem-phys-discuss.net/6/9273/2006/ © Author(s) 2006. This work is licensed
under a Creative Commons License.
Atmospheric Chemistry and Physics Discussions
Measurements of O
3
, NO
2
and BrO at the
Kaashidhoo Climate Observatory (KCO)
during the INDOEX (INDian Ocean
EXperiment) Campaign using ground
based DOAS (Di
fferential Optical
Absorption Spectroscopy) and satellite
based GOME (Global Ozone Monitoring
Experiment) data
A. Ladst ¨atter-Weißenmayer, H. Altmeyer, M. Bruns, A. Richter, A. Rozanov, V. Rozanov, F. Wittrock, and J. P. Burrows
Institute of Environmental Physics, University of Bremen, P.O. Box 330440, 28334 Bremen, Germany
Received: 24 July 2006 – Accepted: 15 September 2006 – Published: 26 September 2006 Correspondence to: A. Ladst ¨atter-Weißenmayer (lad@iup.physik.uni-bremen.de)
ACPD
6, 9273–9296, 2006 O3 and NO2over Kaashidhoo A. Ladst ¨atter-Weißenmayer et al. Title Page Abstract Introduction Conclusions References Tables Figures J I J I Back CloseFull Screen / Esc
Printer-friendly Version
Interactive Discussion
Abstract
The INDian Ocean EXperiment (INDOEX) was an international, multi-platform field campaign to measure long-range transport of air masses from South and South-East-(SE) Asia towards the Indian Ocean. During the dry monsoon season between January and March 1999, local measurements were carried out from ground based platforms
5
and were compared with satellite based data. The objective of this study was to charac-terise stratospheric and tropospheric trace gas amounts in the equatorial region, and to investigate the impact of air pollution at this remote site. For the characterisation of the chemical composition of the outflow from the S-SE-Asian region, we performed ground based dual-axis-DOAS (Differential Optical Absorption Spectroscopy) measurements
10
at the KCO (Kaashidhoo Climate Observatory) in the Maldives (5.0◦N, 73.5◦E). The ground based dual-axis-DOAS measurements were conducted using two different ob-servation modes (off-axis and zenith-sky). This technique allows the separation of the tropospheric and stratospheric columns for different trace gases like O3and NO2. These dual-axis DOAS data were compared with O3-sonde measurements performed
15
at KCO and satellite based GOME (Global Ozone Measuring Experiment) data during the intensive measuring phase of the INDOEX campaign in February and March 1999. From GOME observations, tropospheric and stratospheric columns for O3 and NO2 were retrieved. In addition, the analysis of the O3-sonde measurements allowed the determination of the tropospheric O3amount. The comparison shows that the results
20
of all three measurement systems agree within their error limits. During the INDOEX campaign, background conditions were observed most of the time, but in a single case an increase of tropospheric NO2during a short pollution event was observed and the impact on the vertical columns was calculated. In the GOME measurements, evidence was found for large tropospheric contributions to the BrO budget, probably located in
25
the free troposphere and present throughout the year. The latter has been investigated by the comparison of satellite pixels influenced by high and low cloud conditions based on GOME data which allows the determination of the detection limit of tropospheric
ACPD
6, 9273–9296, 2006 O3 and NO2over Kaashidhoo A. Ladst ¨atter-Weißenmayer et al. Title Page Abstract Introduction Conclusions References Tables Figures J I J I Back CloseFull Screen / Esc
Printer-friendly Version
Interactive Discussion BrO columns.
1 Introduction
The INDOEX (INDian Ocean EXperiment) project was an international scientific ex-periment with the main objective to study natural and anthropogenic climate forcing by aerosols and feedbacks on regional and global climate (Ramanathan et al.,2001).
IN-5
DOEX field studies were carried out over the tropical Indian Ocean, which provides a unique natural laboratory for aerosol studies at the crossing point of pristine air masses from the southern Indian Ocean including Antarctica and rather polluted air masses from the Indian subcontinent. Regional consequences of global warming likely depend on the potentially large cooling effect of aerosols. Therefore, during the
inten-10
sive field campaign of INDOEX, data were collected from airborne, ship-borne, ground - and satellite based instruments to analyse aerosol composition, atmospheric trace gases, and the long range transport of air pollution from SE Asia towards the Indian Ocean during the dry monsoon (Lelieved et al.,2001). The Kaashidhoo Climate Ob-servatory (KCO), established by the Maldives government and the Scripps Institution
15
of Oceanography is located in the tropics (5.0◦N, 73.5◦E). The KCO played a cen-tral role in the INDOEX campaign (Ramanathan et al.,2001). At KCO measurements with O3-sondes and in-situ measurements of O3, carbon monoxide (CO), carbon diox-ide (CO2), methane (CH4), CFCs, other chlorinated gases, nitrous oxide (N2O) and sulfur hexafluoride (SF6) were carried out alongside meteorological measurements of
20
wind speed and direction, dry air temperature, relative humidity, atmospheric pres-sure and rain amount during the intensive INDOEX campaign. During INDOEX, the Institute of Environmental Physics and Remote Sensing of the University of Bremen, performed remote sensing measurements using the technique of dual-axis-DOAS (Dif-ferential Optical Absorption Spectroscopy) (off-axis and zenith-sky mode) at KCO. This
25
instrument was a precursor of the multi-axis DOAS instrument described in (Wittrock
ACPD
6, 9273–9296, 2006 O3 and NO2over Kaashidhoo A. Ladst ¨atter-Weißenmayer et al. Title Page Abstract Introduction Conclusions References Tables Figures J I J I Back CloseFull Screen / Esc
Printer-friendly Version
Interactive Discussion groups (Hoenninger et al.,2002), (Roozendael et al.,2003). Simultaneous
measure-ments of zenith-sky and off-axis scattered sunlight enables stratospheric and tropo-spheric amounts of atmotropo-spheric gases to be distinguished. Specifically the total and tropospheric column amounts of ozone (O3), nitrogen dioxide (NO2), as well as tropo-spheric amounts of BrO above KCO were to be investigated. The results of our O3
5
and NO2 measurements were to be compared with those from GOME (Global Ozone Monitoring Experiment) (Burrows et al.,1999). The subject of this contribution is the validation and synergistic use of ground based and remotely sensed GOME data, as well as O3-sonde measurements above the Indian Ocean during INDOEX.
2 Experimental set-up 10
2.1 Ground based DOAS measurements
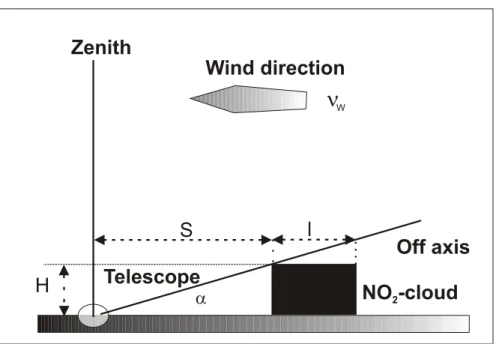
During the intensive INDOEX campaign, DOAS measurements were carried out at KCO using two selected viewing geometries (dual technique: zenith and off-axis) (see Fig.1). The dual-axis-DOAS-instrument is comprises of a Czerny Turner spectrometer (ARC 500, Acton Research Coporation) and a custom made telescope. High temporal
15
resolution was achieved by switching between zenith-sky and 2◦ above the horizon di-rection within a short time interval (typically a few minutes). We can therefore assume essentially no change in the vertical column amount between the two recordings. For the observations at the elevation angle of 2◦(angle between the horizontal direction and the viewing direction of the telescope) most of the light is scattered into the telescope
20
from the air close to the surface and a height of 2 km resulting in a higher sensitivity to the lower atmosphere compared to the observation of zenith scattered sunlight (90◦), which has a comparatively short path through the troposphere. These measurements were carried out each day between sunrise (average over the morning measurements = a.m.-value) and sunset (average over the evening measurements = p.m.-value) in the
25
wavelength region of 327–492 nm with a spectral resolution of 0.5 nm. For this study, 9276
ACPD
6, 9273–9296, 2006 O3 and NO2over Kaashidhoo A. Ladst ¨atter-Weißenmayer et al. Title Page Abstract Introduction Conclusions References Tables Figures J I J I Back CloseFull Screen / Esc
Printer-friendly Version
Interactive Discussion spectra in the wavelength region of 435–481 nm were analysed applying the DOAS
technique (Platt,1994), (Wittrock et al.,2004), (Heckel et al.,2005) to obtain the di ffer-ential slant column (DSC), the difference between the column amount of the absorber integrated along the light path through the atmosphere and the absorber amount in the background spectrum (SC0) at the smallest solar zenith angle of O3 and NO2. The
5
fifth order polynomial was fitted to the spectrum and absorptions by O3 (Burrows et
al.,1999), NO2 (Burrows et al.,1998), the oxygen dimer O4 (Greenblatt et al.,1990) as well as H2O (Rothman et al., 1992) were taken into account. The effect of Ra-man scattering (Grainger and Ring,1962) was compensated by fitting a synthetic Ring spectrum as an additional absorber (Vountas et al., 1998). Total vertical columns of
10
the trace gases O3and NO2for the location Kaashidhoo can be derived by the division of the slant columns (the SC is the sum of the DSC and the SC0 in the background spectrum) of the zenith measurements by the air mass factor (AMF) which describes the light path through the atmosphere and is calculated with GOMETRAN/SCIATRAN (Rozanov et al.,1997). Error analysis revealed a maximum relative error of 5% for the
15
total amount for either trace gas retrieval, taking into account the radiative transfer in the atmosphere for the AMF calculation including the assumed shape of the vertical profile of the absorber, the surface albedo, and the aerosol loading.
The total vertical column of the trace gases consists of a tropospheric as well as a stratospheric part. Using both observation modes and appropriate AMF
calcula-20
tions, tropospheric vertical columns and/or profiles can be separated from the mea-surements (Heckel et al.,2005), (Wittrock et al.,2004), as carried out in this study for the trace gas O3. The analysis of the tropospheric amount of NO2 is based on the results of dual-axis-DOAS measurements combined with model assumptions. The fol-lowing simplifying assumptions were made for the calculation of tropospheric NO2: (a)
25
a polluted and well mixed air mass (air masses with higher amounts of NO2than in the surrounding air) follows the wind from north to south, (b) this air parcel passes both observing modes without any exchange with the environment and (c) the air mass has a rectangular shape with homogenously high amounts of NO2(see Fig.2). With these
ACPD
6, 9273–9296, 2006 O3 and NO2over Kaashidhoo A. Ladst ¨atter-Weißenmayer et al. Title Page Abstract Introduction Conclusions References Tables Figures J I J I Back CloseFull Screen / Esc
Printer-friendly Version
Interactive Discussion assumptions the analysed air parcel is passing first the off-axis observing mode and
then the zenith observing direction (see Fig.2). 2.2 GOME and O3-sonde measurements
GOME was launched in April 1995 onboard the second European satellite ERS-2 in a sun-synchronous near polar orbit at a mean altitude of 795 km for measuring the
5
sunlight scattered from the Earth’s atmosphere and/or reflected by the surface in nadir mode in a wavelength region of 240 to 790 nm with a spectral resolution of 0.2–0.4 nm. The local equator crossing time is 10:30 a.m. With 14 orbits per day, global cover-age at the equator is reached after three days for a 960 km swath width (the size of one GOME ground pixel is 40×320 km2) (Burrows et al., 1999). For this study
10
GOME data reprocessed with WFDOAS (Weighting Function Differential Optical Ab-sorption Spectroscopy) Version 1 (Coldewey et al., 2005) and (Weber et al., 2005) were extracted with a maximum distance of 300 km away from the location of inter-est to derive vertical columns of O3. The analysis to derive slant columns of NO2 (Richter and Burrows,2002) in the 425–450 nm and of BrO in the 344–359 nm
wave-15
length region (Richter et al., 2002a) was carried out using the IUP Bremen DOAS algorithm. The retrieval method is similar to that used for ground-based zenith-sky measurements. For the comparisons with ground based DOAS measurements, only GOME level 1-spectra with a maximum distance of 300 km around Kaashidhoo were extracted. GOME observes both – the troposphere and the stratosphere (Burrows et
20
al.,1999) – and in cloudy conditions it is impossible for GOME to detect the exact in-fluence of trace gases below the cloud layer. For the comparison of the tropospheric column amounts from GOME with ground based DOAS measurements, only GOME-pixels under cloud free conditions (using measurements with a cloud fraction of less than 0.2 as determined by the FRESCO algorithm, Koelemeijer et al., 2001) were
in-25
cluded in the analysis. The tropospheric trace gas columns were derived by applying the tropospheric excess method (TEM) or reference sector approach. The TEM is based on the assumption that the columns of stratospheric trace gases such as NO2
ACPD
6, 9273–9296, 2006 O3 and NO2over Kaashidhoo A. Ladst ¨atter-Weißenmayer et al. Title Page Abstract Introduction Conclusions References Tables Figures J I J I Back CloseFull Screen / Esc
Printer-friendly Version
Interactive Discussion and O3 are approximately constant at a given longitude. This is a large over
simpli-fication but appears to work well for tropical and sub tropical conditions for O3 and NO2and to higher latitudes mainly for NO2. A number of studies have been published focusing on the retrieval of tropospheric NO2 (Leue et al., 2001), (Richter and
Bur-rows,2002), (Martin et al.,2002) and O3(Ladst ¨atter-Weißenmayer et al.,2004) from
5
GOME data. The error on the resultant tropospheric O3is estimated to be 4 DU (Dob-son Units) (Ladst ¨atter-Weißenmayer et al.,2004) and on the tropospheric columns of NO2 approximately 1.5×10¹⁵molecules cm−2 (Richter and Burrows, 2002) based on GOME data. During the INDOEX campaign in January to March 1999, in addition to the Vaisala radio sondes (Komhyr et al., 1995) a collection of 55 electrochemical
10
cell (ECC) ozone soundings (Lobert et al., 2002) and (Thompson et al., 2003) were launched about once per day at approximately 14:00 local time (09:00 Universal Time (UT)) at the KCO by the Scripps Institution of Oceanography. In order to obtain the tropospheric vertical columns of O3, the sonde data were summed up to the height of the tropopause defined in this case study to be at 4 PV (potential vorticity) Units.
15
3 Results and discussion
3.1 Total column amounts of O3and NO2
The ground based DOAS measurements were used to determine a.m.-, and p.m.-, values for O3 and NO2 total columns. The latter were determined from the observa-tions at SZAs between 83 and 90◦ in the morning and afternoon. The analysis of the
20
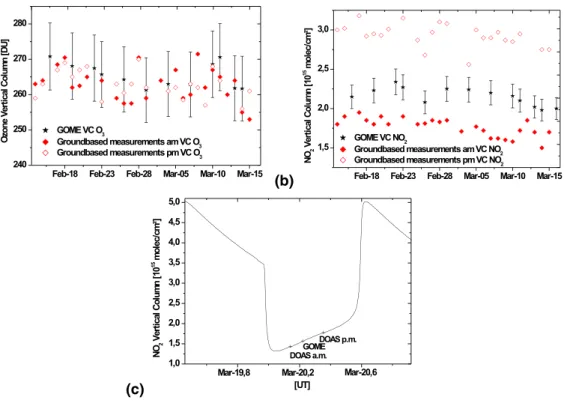
zenith-sky ground based measurements of O3 showed almost no difference between a.m. and p.m. values (Fig.3a). That means no diurnal variation for the vertical columns of O3can be seen during the whole INDOEX campaign. A mean value of 263 DU was determined using both a.m. and p.m. data. Deviations of up to 10 DU from the mean value which can be attributed to the transport of different air masses, are observed.
25
ACPD
6, 9273–9296, 2006 O3 and NO2over Kaashidhoo A. Ladst ¨atter-Weißenmayer et al. Title Page Abstract Introduction Conclusions References Tables Figures J I J I Back CloseFull Screen / Esc
Printer-friendly Version
Interactive Discussion shows agreement within 3% for the total columns. This value is smaller than the
com-bined errors of the ground based measurements and the satellite based measurements of 5%. Figure3b shows the a.m. and p.m. values for NO2 vertical columns (given in molecules cm−2) from the ground based DOAS measurements compared to the GOME results. The difference between the a.m. (around 06:30 a.m.) and the p.m. (around
5
17:30 p.m.) values of the ground based measurements was significant for NO2. The p.m. values were almost a factor of 1.7 higher than the a.m. values. This behaviour is attributed to the photolysis of N2O5in the stratosphere. The influence of the diurnal cycle is more intense in the tropics compared to mid-latitudes where the factor is typ-ically 1.4 (Solomon et al.,1987) for ground based measurements. A result of a NO2
10
daytime increase of 1×1014cm−2/h can be calculated from our ground based measure-ments. A similar result is obtained comparing ground based measurements carried out in the morning and GOME data. The retrieved a.m. columns of NO2 show roughly 25% lower values compared to the GOME results. In comparison to the ground based measurements, the total columns of NO2 from GOME are 4×1014cm−2 (mean value)
15
higher because of its later overpass time of 10:30 a.m. at KCO compared to the ground based measurements carried out 4 h earlier. While an increase of 1×1014cm−2/h can be calculated comparing ground based a.m. and p.m. results as well as ground based a.m. and GOME data, the output of a photochemical model (Sinnhuber et al.,2005) based on the chemistry scheme from the SLIMCAT model (Chipperfield,1999), with
re-20
action rate constants taken from the JPL-2002 recommendations (Sander et al.,2002) (see Fig. 3c) shows an increase of only 3×1013cm−2/h caused by the already men-tioned diurnal variations in stratospheric NO2.
3.2 Tropospheric column amounts of O3, NO2and BrO
The second scientific aim of this study was to determine the influence of pollution
25
events on the tropospheric column amounts of O3and NO2.
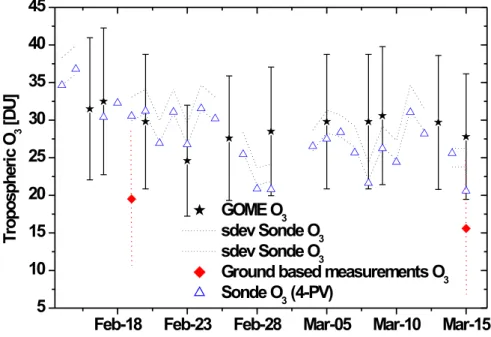
Figure4shows the comparison between the tropospheric column of O3determined
ACPD
6, 9273–9296, 2006 O3 and NO2over Kaashidhoo A. Ladst ¨atter-Weißenmayer et al. Title Page Abstract Introduction Conclusions References Tables Figures J I J I Back CloseFull Screen / Esc
Printer-friendly Version
Interactive Discussion as described above from GOME and that derived from the ozone sonde
measure-ments. The results of tropospheric amounts of O3 from both instruments are in the range of background conditions because the tropical Indian Ocean is dominantly in-fluenced by pristine air masses from the southern Indian Ocean including Antarctica during this time of the year. The results of two selected case studies, depicted in red
5
in Fig. 4, show lower tropospheric ozone columns for the ground based DOAS data compared to the results of either GOME (40%) or ozone sonde measurements (33%) on these two days, whereas the differences between the sonde data and the remotely sensed data are within a range of 4% (1.2 DU). Taking into account the error bars of both the O3-sondes and satellite based data, during this episode the two instruments
10
agreed within their error limits (see Fig.4).
The reason for the differences in the values between ground based, satellite, and ozone sonde measurements is likely a combination of limitations arising from the DOAS ground based measurements. One of the main error sources is poorly known type and amount of aerosol. Following from the high amount of aerosol over the Indian Ocean,
15
the use of the dual-axis-DOAS instrument, in contrast to the MAX (multi axis)-DOAS instrument (Wittrock et al.,2004), as used presently, can introduce large errors. That means, the calculation of the tropospheric AMFs taking into account only two different observing modes (zenith-sky and off-axis) consequently leads to an overall uncertainty of the analysis with estimated errors on the order of 10 DU, a value usually expected for
20
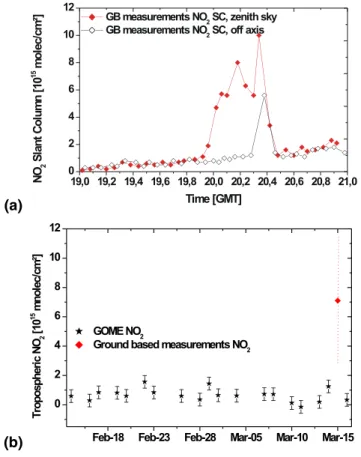
this type of study. Thus, within the combined error limits, the ground based measure-ments agree with the GOME results. In this study, in addition to the analysis of tropo-spheric O3, the influence of tropospheric pollution with respect to NO2was determined. Using the high temporal resolution of ground based data, a localised tropospheric NO2 plume could be observed on 15 March 1999. An increase of the slant column of NO2
25
due to polluted air masses was observed in the off-axis mode first. The same polluted air mass was later transported through the zenith-sky telescope’s field of view, and the slant columns of the zenith-sky measurements were increasing as well. After the air mass has passed the telescope, the slant columns of both observing modes were
ACPD
6, 9273–9296, 2006 O3 and NO2over Kaashidhoo A. Ladst ¨atter-Weißenmayer et al. Title Page Abstract Introduction Conclusions References Tables Figures J I J I Back CloseFull Screen / Esc
Printer-friendly Version
Interactive Discussion then decreasing back to the background value. Based on the measurements of both
observing modes, the increase and the following decrease of the NO2 slant columns can be determined as a function of time (see Fig.5a). Using the wind speed in off axis direction (vW=5 m s−1), as measured at KCO, the elevation angle of the off axis view-ing mode (α=2◦), the assumed vertical height of the plume (h=s*tan(α)=262 m) with
5
s=7500 m (the horizontal distance of the plume from the measuring point), its horizon-tal extension in the viewing direction (l=(time of decrease of SC of both viewing modes - time of the first increase of SC of zenith data)*v=900 m) and its horizontal distance from the measuring point at a defined time (see Fig.2) the tropospheric NO2 amount during a short pollution event can be obtained.
10
Dual-axis-DOAS reveals for the 15 March 1999 a maximum concentration of 1– 2×10¹¹molecules cm−3 (5 ppb) of NO2 based on the model assumption for a well mixed air mass over the Maldives (see Fig. 5b). On this day the observed total ver-tical column amount from ground based measurements was 1.8×10¹⁵molecules cm−2 (a.m. value, (see Fig. 3b). This means using the maximum concentration
15
of 1–2×10¹¹molecules cm−3, a tropospheric vertical column amount for NO2 of 7.1×10¹⁵molecules cm−2 was determined. Therefore, on this day an increase by a factor of 4 occurred over Kaashidhoo during this brief pollution event (see Fig.5b) for the total column amount of NO2.
Comparing this result with the tropospheric amount of NO2 measured with GOME
20
for the same day, a difference of 6.1×10¹⁵molecules cm−2 can be observed (see Fig. 5b). This case study shows that a local increase of tropospheric NO2 up to 7×1×1015molecules cm−2 could be observed with ground based DOAS measure-ments in the afternoon whereas GOME is measuring 1×10¹⁵molecules cm−2at 10:30 over this region, highlighting the importance of different spatial and temporal
reso-25
lutions of both instruments. Locally observed high values for tropospheric NO2 can be caused by different sources like combustion processes of anthropogenic or natu-ral origin, such as biomass burning, and lightning discharge (Wayne,1991). In this particular case, the increase of NO2 was probably caused by nitrogen oxide (NOx
ACPD
6, 9273–9296, 2006 O3 and NO2over Kaashidhoo A. Ladst ¨atter-Weißenmayer et al. Title Page Abstract Introduction Conclusions References Tables Figures J I J I Back CloseFull Screen / Esc
Printer-friendly Version
Interactive Discussion = NO + NO2) emissions from ships (Lawrence et al., 1999; Kasibhatla et al.,2000;
Richter et al.,2004;Wittrock et al.,2004). From GOME measurements the mean back-ground tropospheric amount of NO2 was determined to be 4×10¹⁴molecules cm−2, while the mean total column amount of NO2 during the INDOEX campaign was 1.7×10¹⁵molecules cm−2. That means an average tropospheric fraction of 24%
un-5
der clean air background conditions was observed.
Very large BrO columns have been detected in polar spring in both hemispheres. These events have already been studied and compared with model output, balloon-borne observations and ground based measurements in previous publications (
Wag-ner and Platt, 1998; Richter et al., 1998; Richter et al., 1999; Wagner et al., 2001;
10
Roozendael et al.,1999; Roozendael et al., 2002). They are attributed to boundary layer effects, in which photochemically produced active bromine can temporarily ac-cumulate to high abundances in a shallow surface layer, consuming ozone while not being sequestered in chemically more stable bromine species. The source of BrO has not been identified beyond doubt but active bromine species are presumed to be
re-15
leased either from sea salt, especially in the form of frost-flowers, or from biogenic organo-bromine species. In addition to the large values observed in polar spring, en-hanced BrO is also observed globally in GOME data (Hegels et al.,1998;Roozendael
et al.,1999;Richter et al.,2002a). This has tentatively been attributed to a significant background concentration of BrO in the free troposphere of several ppt, and direct
ev-20
idence for BrO in the free troposphere was found by (Fitzenberger et al.,2000). Here, this assumption has been tested by analysing ground-based DOAS measurements and satellite-based GOME data during the INDOEX campaign in the wavelength re-gion 344-359 nm where BrO shows strong absorption features. Since several power failures have had an impact on the stability of the ground based instrument, only a
25
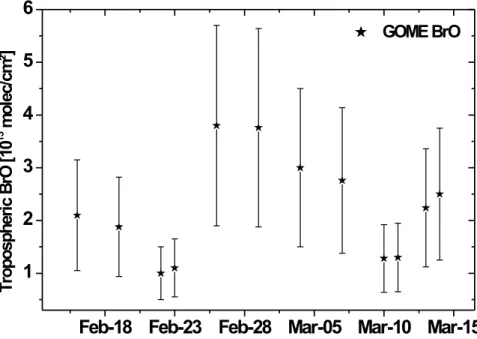
detection limit of 3×10¹⁴molecules cm−2was achieved for BrO from our ground based dual-axis-DOAS measurements. Using the difference of low (at 900–1013 mbar) and high cloud (at 0–600 mbar) situations during the INDOEX campaign an upper limit for the free tropospheric column of BrO of 3.8×10¹³molecules cm−2 from GOME pixels
ACPD
6, 9273–9296, 2006 O3 and NO2over Kaashidhoo A. Ladst ¨atter-Weißenmayer et al. Title Page Abstract Introduction Conclusions References Tables Figures J I J I Back CloseFull Screen / Esc
Printer-friendly Version
Interactive Discussion (see Fig.6) can be observed. Assuming a 4 km thick atmospheric layer at 1000 hPa,
4 ppt of BrO can be calculated for this time period. That means a small amount of BrO is present in the troposphere (Richter et al.,2002a). The value calculated in this study for the amount of tropospheric BrO during the campaign is representative for back-ground conditions as estimated in other studies (Richter et al., 1998; Richter et al.,
5
1999;Wagner and Platt,1998;Wagner et al.,2001;Pundt et al.,2002;Fitzenberger et
al.,2000;Dickerson et al.,1999).
4 Conclusions
During the INDOEX campaign in February and March 1999 on Kaashidhoo, ground based dual-axis DOAS measurements (zenith and off-axis-measurements) were
per-10
formed in the equatorial region. This method provides information of total as well as on tropospheric column amounts of O3 and NO2 and can distinguish between back-ground and polluted atmospheric situations. In addition, an upper limit for the free tro-pospheric amount of BrO could be given using cloud-affected GOME measurements. The comparison between ground based dual-axis DOAS, GOME (both detecting O3,
15
NO2, BrO), and O3-sonde data demonstrates that all measurement systems agreed within their error limits. The relatively large errors in the ground based data result from both instrumental and theoretical errors related to the assumed homogeneity of the tropical air masses encountered. Differences between ground based and satellite measurements can result from the temporal variability of the atmosphere when
mea-20
surements are not exactly coincident in time, and from the limited spatial resolution of GOME compared to ground based measurements. This dual-axis-DOAS-technique and in addition the calculation of the different AMFs allowed to calculate around 19 DU for tropospheric O3(two case studies on 19 February and 14 March 1999) and 263 DU for the total amount of O3. The results were compared to satellite based GOME-data
25
and O3-sondes launched over Kaashidhoo. Differences of up to 40% for the GOME (24.6–32.5 DU) data and of 33% for the O3-sonde measurements (20.6–36.8 DU) in
ACPD
6, 9273–9296, 2006 O3 and NO2over Kaashidhoo A. Ladst ¨atter-Weißenmayer et al. Title Page Abstract Introduction Conclusions References Tables Figures J I J I Back CloseFull Screen / Esc
Printer-friendly Version
Interactive Discussion the tropospheric part for both case studies and a discrepancy of 3% for the vertical
columns for the time period of the INDOEX campaign were obtained. Pollution events such as on 15 March 1999 could be detected by applying both, the zenith-sky and the off-axis mode of the ground based measurements. Therefore, this measurement method permits to differentiate between local tropospheric emissions of, e.g., NO and
5
stratospheric NO2 columns. A simple model based on a homogenous air mass with enhanced NO2-loading passing the two different observing modes yields an increase of up to 5–10 ppb in this case study. GOME satellite data from the same day show no significant increase in NO2, highlighting the strengths and weaknesses of the two di ffer-ent observing systems. While GOME has excellffer-ent spatial coverage but limited spatial
10
and temporal resolution and therefore limited sensitivity for the detection of localized events, the ground based measurements with the dual-axis-technique can observe lo-cal pollution events on a short time slo-cale at one location. Furthermore, we lo-calculated an upper limit of 3.8×10¹³molecules cm−2 from BrO satellite based measurements for the tropical free troposphere, comparing pixels of GOME measurements under high
15
and low cloud situations, and made possible by the high spectral resolution of GOME. This abundance confirms previous studies (Richter et al., 1998; Richter et al.,1999;
Wagner and Platt,1998;Wagner et al.,2001;Pundt et al.,2002;Fitzenberger et al.,
2000;Dickerson et al.,1999).
Acknowledgements. Parts of this work have been funded by the University of Bremen,
Ger-20
many, the DLR/DARA, the European Community, and the European Space Agency (ESA). We would like to thank H. Altmeyer who carried out with M. Bruns the measurements at KCO. We would like to thank R. B. A. Koelemeijer for providing the FRESCO data. We would like to thank the International sharing steering Group of the INDOEX campaign for great assistance, with-out which this work would not have been possible. We thank especially the organizers of the
25
INDOEX campaign P. Crutzen and V. Ramanathan, J. Lobert and the whole KCO team during the IFP 1999. We thank in particular R. Dickerson for great help during the campaign. We also appreciate the warm hospitality of the Maldivians on the island Kaashidhoo, Republic of Maldives. Discussions with R. v. Kuhlmann, M. G. Lawrence and A. M. Thompson were very helpful.
ACPD
6, 9273–9296, 2006 O3 and NO2over Kaashidhoo A. Ladst ¨atter-Weißenmayer et al. Title Page Abstract Introduction Conclusions References Tables Figures J I J I Back CloseFull Screen / Esc
Printer-friendly Version
Interactive Discussion
References
Burrows, J. P., Dehn, A., Deters, B., Himmelmann, S., Richter, A., Voigt, S., and Orphal, J.: Atmospheric remote-sensing reference data from GOME: Part 1, Temperature-dependant absorption cross-sections of NO2, J. Quant. Spectrosc. Radiat. Transfer, 60, 1025–1031, 1998. 9277
5
Burrows, J. P., Weber, M., Buchwitz, M., Rozanov, V. V., Ladst ¨atter-Weißenmayer, A., Richter, A., de Beek, R., Hoogen, R., Bramstedt, K., Eichmann, K.-U., Eisinger, M., and Perner, D.: The Global Ozone Monitoring Experiment (GOME): Mission Concept and First Scientific Results, J. Atm. Sci., 56, 151–175, 1999. 9276,9277,9278
Chipperfield, M. P.: Multiannual simulations with a three-dimensional chemical transport model,
10
J. Geophys. Res., 104, 1781–805, 1999. 9280
Coldewey-Egbers, M., Weber, M., Lamsal, L. N., de Beek, R., Buchwitz, M., and Burrows, J. P.: Total ozone retrieval from GOME UV spectral data using the weighting function DOAS approach, Atmos. Chem. Phys., 5, 5015–5025, 2005. 9278
Dickerson, R. R., Rhoads, K. P., Carsey, T. P., Oltmans, S. J., Burrows, J. P., and Crutzen, P. J.:
15
Ozone in the remote marine boundary layer: A possible role for halogens, J. Geophys. Res., 104, 21 385–21 395, 1999. 9284,9285
Fitzenberger, R., B ¨osch, H., Camy-Peyret, C., Chipperfield, M. P., Harder, H., Platt, U., Sinnhu-ber, B. M., Wagner, T., and Pfeilsticker, K.: First Profile Measurements of Tropospheric BrO, Geophys. Res. Lett., 27, 2921–2925, 2000. 9283,9284,9285
20
Grainger, J. F. and Ring, J.: Anomalous Fraunhofer line profiles, Nature, 193, 762, 1962. 9277 Greenblatt, G. D., Orlando, J. J., Burkholder, J. B., and Ravisahankara, A. R.: Absorption measurements of oxygen between 330 and 1140 nm, J. Geophys. Res., 95, 18 577–18 582, 1990. 9277
Heckel, A., Richter, A., Tarsu, T., Wittrock, F., Hak, C., Pundt, I., Junkermann, W., and Burrows,
25
J. P.: MAX-DOAS measurements of formaldehyde in the Po-Valley, Atmos. Chem. Phys., 5, 909-918, 2005. 9275,9277
Hegels, E., Crutzen, P. J., Kl ¨upfel, T., Perner D., and Burrows, J. P.: Global distribution of atmospheric bromine monoxide from GOME on earth observing satellite ERS-2, Geophys. Res. Lett., 25, 3127–3130, 1998. 9283
30
Hoenninger G. and Platt U.: The Role of BrO and its Vertical Distribution during Surface Ozone Depletion at Alert, Atmos. Environ., 36, 2481–2489, 2002. 9276
ACPD
6, 9273–9296, 2006 O3 and NO2over Kaashidhoo A. Ladst ¨atter-Weißenmayer et al. Title Page Abstract Introduction Conclusions References Tables Figures J I J I Back CloseFull Screen / Esc
Printer-friendly Version
Interactive Discussion Kasibhatla, P., Levy II, H., Moxim, W. J., Pandis, S. N., Corbett, J. J., Peterson, M. C., Honrath,
R. E., Frost, G. J., Knapp, K., Parrish, D. D., and Ryerson, T. B.: Do emissions from ships have a significant impact on concentrations of nitrogen oxides in the marine boundary layer?, Geophys. Res. Lett., 27, 2229–2232, 2000. 9283
Koelemeijer, R. B. A., Stammes, P., Hovenier, J. W., and de Haan, J. F.: A fast method for
5
retrieval of cloud parameters using oxygen A-band measurements from GOME, J. Geophys. Res., 106, 3475–3490, 2001.
Komhyr, W. D., Barnes, R. A., Brothers, G. B., Lathrop J. A., and Opperman, D. P.: Elec-trochemical concentration cell ozonesonde performance evaluation during STOIC 1989, J. Geophys. Res., 100, 9231–9244, 1995. 9279
10
Ladst ¨atter-Weißenmayer, A., J. Meyer-Arnek, A. Schlemm and J. P. Burrows: Influence of stratospheric airmasses on tropospheric vertical O3columns based on GOME (Global Ozone Monitoring Experiment) measurements and backtrajectory calculation over the Pacific, At-mos. Chem. Phys., 4, 903–909, 2004. 9279
Lawrence, M. G. and Crutzen, P. J.: Influence of NOx emissions from ships on tropospheric
15
photochemistry and climate, Nature, 402, 167–170, 1999. 9283
Lelieveld, J., Crutzen, P. J., Ramanathan, V., et al.: The Indian Ocean Experiment: Widespread Air Pollution from South and Southeast Asia, Sience, 291, 1031–1036, 2001. 9275
C. Leue, Wenig, M., Wagner, T., Klimm, O., Platt U., and J ¨ahne, B.: Quantitative analysis of NOx emissions from GOME satellite image sequences, J. Geophys. Res., 106, 5493–5505,
20
2001. 9279
Lobert, J. M. and Harris, J. M.: Trace gases and air mass origin at Kasshidhoo, Indian Ocean, J. Geophys. Res., 107, D19, 8013, doi:10.1029/2001JD000731, 2002. 9279
Martin, R. V., Chance, K., Jacob, D. J., Kurosu, T. P., Spurr, R. J. D., Bucsela, E., Gleason, J. F., Palmer, P. I., Bey, I., Fiore, A. M., Li, Q., Yantosca, R. M., and Koelmeijer, R. B. A.: An
25
improved retrieval of tropospheric nitrogen dioxide from GOME, J. Geophys. Res., 107(20), 4437, doi:10.1029/2001JD001027, 2002. 9279
Platt, U.: Differential optical absorption spectroscopy (DOAS), in: Air Monitoring by Spectro-scopic Techniques, Chem. Anal. Ser., edited by: Sigrist, M. W., John Wiley, New York, 127, 27-84, 1994. 9277
30
Pundt, I., Pommereau, J.-P., Chipperfield, M. P., Van Roozendael, M., and Goutail, F.: Climatol-ogy of the stratospheric BrO vertical distribution by balloon-borne UV-visible spectrometry, J. Geophys. Res., 107(D24), 4806, doi:10.1029/2002JD002230, 2002. 9284,9285
ACPD
6, 9273–9296, 2006 O3 and NO2over Kaashidhoo A. Ladst ¨atter-Weißenmayer et al. Title Page Abstract Introduction Conclusions References Tables Figures J I J I Back CloseFull Screen / Esc
Printer-friendly Version
Interactive Discussion Ramanathan, V., Crutzen, J. P., Lelieveld, J., et al.: Indian Ocean Experiment: An Integrated
Assessment of the Climate Forcing and Effects of the Great Indoasian Haze, J. Geophys. Res., 106(D22), 28 317–28 399, 2001. 9275
Richter, A., Wittrock, F., Eisinger, M., and Burrows, J. P.: GOME observations of tropospheric BrO in Northern Hemispheric spring and summer 1997, Geophys. Res. Lett., 25, 2683–2686,
5
1998. 9283,9284,9285
Richter, A., Wittrock, F., and Burrows, J. P.: GOME Observations of Tropospheric BrO, Euro-pean Symposium on Atmospheric Measurements from Space, ESA WPP-161., 407–413, 1999. 9283,9284,9285
Richter, A. and Burrows, J. P.: Retrieval of tropospheric NO2from GOME measurements, Adv.
10
Space Res., 29(11), 1673–1683, 2002. 9278,9279
Richter, A., Wittrock, F., Ladst ¨atter-Weissenmayer, A., and Burrows, J. P.: GOME measure-ments of stratospheric and tropospheric BrO, Adv. Space Res. 29, 1667–1672, 2002a. 9278, 9283,9284
Richter, A., Eyring, V., Burrows, J. P., Bovensmann, H., Lauer, A., Sierk, B., and Crutzen, P. J.:
15
Satellite Measurements of NO2from International Shipping Emissions, Geophys. Res. Lett., 31, L23110, doi:10.1029/2004GL020822, 2004. 9283
Richter, A., Wittrock, F., Weber, M., Beirle, S., K ¨uhl, S., Platt, U., Wagner, T., Wilms-Grabe, W., and Burrows, J. P.: GOME observations of stratospheric trace gas distributions during the splitting vortex event in the Antarctic winter 2002 Part I, J. Atmos. Sci., 62(3), 778–785,
20
2005.
Van Roozendael, M., Fayt, C., Lambert, J. C., Pundt, I., Wagner, T., Richter, A., and Chance, K. V.: Development of a bromine oxide product from GOME, in European Symposium on Atmospheric Measurements from Space, ESA, WPP-161, 1, 543–547, 1999. 9283
Van Roozendael, M., Wagner, T., Richter, A., Pundt, I., Arlander, D. W., Burrows, J. P.,
Chip-25
perfield, M., Fayt, C., Johnston, P. V., Lambert, J.-C., Kreher, K., Pfeilsticker, K., Platt, U., Pommereau, J.-P., Sinnhuber, B.-M., Toernkvist, K. K., and Wittrock, F.: Intercomparison of BrO Measurements from ERS-2 GOME, ground-based and Balloon Platforms, Adv. Space Res., 29(11), 1661-1666, 2002. 9283
Van Roozendael, M., Fayt, C., Post, P., Hermans, C., and Lambert, J.-C.: Retrieval of BrO
30
and NO2 from UV-Visible Observations, in: Sounding the troposphere from space: a new era for atmospheric chemistry, edited by: Borell, P., Borrell, P.M.; Burrows, J.P.; Platt, U., Springer-Verlag, ISBN 3-540-40873-8, 2003. 9276
ACPD
6, 9273–9296, 2006 O3 and NO2over Kaashidhoo A. Ladst ¨atter-Weißenmayer et al. Title Page Abstract Introduction Conclusions References Tables Figures J I J I Back CloseFull Screen / Esc
Printer-friendly Version
Interactive Discussion Rothman, L. S., Gamache, R. R., Tipping, R. H., Rinsland, C. P., Smith, M. A. H., Benner, C.
D., Devi, V. M., Flaud, J. M., Camy-Peyret, C., Perrin, A., Goldman, A., Massie, S. T., and Brown, L. R.: The HITRAN molecular database editions 1991 and 1992, J. Quant. Spectrosc. Radiat. Transfer, 48, 469–507, 1992. 9277
Rozanov, V., Diebel, D., Spurr, R. J., and Burrows, J. P.: GOMETRAN: A radiative transfer
5
model for the satellite project GOME – the plance parallel version, J. Geophys. Res., 102, 16 683–16 695, 1997. 9277
Sander, S. P., Friedl, R. R., Golden, D. M., et al., Chemical kinetics and photochemical data for use in atmospheric studies, JPL Publ. Jet Propul. Lab., Pasadena, Calif. 02-25, 335 pp., 2002. 9280
10
Sinnhuber, B.-M., Rozanov, A., Sheode, N., Afe, O. T., Richter, A., Sinnhuber, M., Wittrock, F., Burrows, J. P., Stiller, G. P., von Clarmann, T., and Linden, A.: Global observations of stratospheric bromine monoxide from SCIAMACHY, Geophys. Res. Lett., 32, L20810, doi:10.1029/2005GL023839, 2005. 9280
Solomon, S., Schmeltekopf, A. L., and Sanders, W. R.: On the interpretation of zenith sky
15
absorption measurements, J. Geophys. Res., 92, 8311–8319, 1987. 9280
Thompson, A. M., Witte, J. C., McPeters, R. D., Oltmans, S. J., Schmidlin, F. J., Logan, J. A., Fujiwara, M., Kirchhoff, V. W. J. H., Posny, F., Coetzee, G. J. R., Hoegger, B., Kawakami, S., Ogawa, T., Johnson, B. J., V ¨omel, H., and Labow, G.: Southern Hemisphere Additional Ozonesondes (SHADOZ) 1998–2000 tropical ozone climatology. 1. Comparison with Total
20
Ozone Mapping Spectrometer (TOMS) and ground-based measurements, J. Geophys. Res., 108, 8238, doi:10.1029/2002JD002241, 2003. 9279
Vountas, M., Rozanov V. V., and Burrows, J. P.: Ring Effect: Impact of Rotational Raman Scat-tering on Radiative Transfer in Earth’s Atmosphere, J. Quant. Spectrosc. Radiat. Transfer, 60, 943–961, 1998. 9277
25
Wagner, T. and Platt, U.: Satellite mapping of enhanced BrO concentrations in the troposphere, Nature, 395, 486–490, 1998. 9283,9284,9285
Wagner, T., Leue, C., Wenig, M., Pfeilsticker, K., and Platt, U.: Spatial and temporal distribution of enhanced boundary layer BrO concentrations measured by the GOME instrument aboard ERS-2, J. Geophys. Res., 106, 24 225–24 236, 2001. 9283,9284,9285
30
Wayne, R. P.: Chemistry of Atmospheres, 2nd Edition, Oxford, 565–566, 1991. 9282
Weber, M., Lamsal, L. N., Coldewey-Egbers, M., Bramstedt, K., Burrows, J. P.: Pole-to-pole validation of GOME WFDOAS total ozone with groundbased data, Atmos. Chem. Phys., 5,
ACPD
6, 9273–9296, 2006 O3 and NO2over Kaashidhoo A. Ladst ¨atter-Weißenmayer et al. Title Page Abstract Introduction Conclusions References Tables Figures J I J I Back CloseFull Screen / Esc
Printer-friendly Version
Interactive Discussion 1341–1355, 2005. 9278
Wittrock, F., Oetjen, H., Richter, A., Fietkau, S., Medeke, T., Rozanov, A., and Burrows, J. P.: MAX-DOAS measurements of atmospheric trace gases in Ny-Alesund, Atmos. Chem. Phys., 4, 955–966, 2004. 9275,9277,9281,9283
ACPD
6, 9273–9296, 2006 O3 and NO2over Kaashidhoo A. Ladst ¨atter-Weißenmayer et al. Title Page Abstract Introduction Conclusions References Tables Figures J I J I Back CloseFull Screen / Esc
Printer-friendly Version
Interactive Discussion
Fig. 1. Experimental setup of the DOAS telescope used in Kaashidhoo from 14 February to 16
ACPD
6, 9273–9296, 2006 O3 and NO2over Kaashidhoo A. Ladst ¨atter-Weißenmayer et al. Title Page Abstract Introduction Conclusions References Tables Figures J I J I Back CloseFull Screen / Esc
Printer-friendly Version
Interactive Discussion
Fig. 2. The conceptual model used for describing a plume with high NO2amounts as observed with zenith and off axis geometry.
ACPD
6, 9273–9296, 2006 O3 and NO2over Kaashidhoo A. Ladst ¨atter-Weißenmayer et al. Title Page Abstract Introduction Conclusions References Tables Figures J I J I Back CloseFull Screen / Esc
Printer-friendly Version
Interactive Discussion
(a) Feb-18 Feb-23 Feb-28 Mar-05 Mar-10 Mar-15
240 250 260 270 280 GOME VC O3 Groundbased measurements am VC O3 Groundbased measurements pm VC O3 O zo n e V er ti ca lC o lu m n [D U ]
(b) Feb-18 Feb-23 Feb-28 Mar-05 Mar-10 Mar-15
1,5 2,0 2,5 3,0 GOME VC NO2 Groundbased measurements am VC NO2 Groundbased measurements pm VC NO2 N O2 V er ti ca lC o lu m n [1 0 1 5m o le c/ cm ²] (c) 1,0 1,5 2,0 2,5 3,0 3,5 4,0 4,5 5,0 DOAS a.m. GOMEDOAS p.m. Mar-20,6 Mar-20,2 Mar-19,8 N O2 V er ti ca lC o lu m n [1 0 1 5m o le c/ cm ²] [UT]
Fig. 3. Total columns of O3 (a) and NO2 (b) measured by the ground based DOAS system
and with GOME during the INDOEX campaign from 14 February to 16 March 1999.(c) Model
calculation of the diurnal cycle of NO2for 19 to 20 March 1999 including the measuring time of ground based a.m. and p.m. as well as the overpass time of GOME.
ACPD
6, 9273–9296, 2006 O3 and NO2over Kaashidhoo A. Ladst ¨atter-Weißenmayer et al. Title Page Abstract Introduction Conclusions References Tables Figures J I J I Back CloseFull Screen / Esc
Printer-friendly Version
Interactive Discussion
Feb-18 Feb-23 Feb-28 Mar-05 Mar-10 Mar-15
5 10 15 20 25 30 35 40 45 GOME O 3 sdev Sonde O3 sdev Sonde O3
Ground based measurements O3
Sonde O3 (4-PV) T ro p o sp h er ic O 3 [D U ]
Fig. 4. Tropospheric columns of O3measured by the ground based DOAS system compared with the O3-sondes and with GOME data for the time period of 14 February to 16 March 1999 during the INDOEX campaign.
ACPD
6, 9273–9296, 2006 O3 and NO2over Kaashidhoo A. Ladst ¨atter-Weißenmayer et al. Title Page Abstract Introduction Conclusions References Tables Figures J I J I Back CloseFull Screen / Esc
Printer-friendly Version Interactive Discussion (a) 19,0 19,2 19,4 19,6 19,8 20,0 20,2 20,4 20,6 20,8 21,0 0 2 4 6 8 10 12
GB measurements NO2SC, zenith sky
GB measurements NO2SC, off axis
N O2 S la n t C o lu m n [1 0 1 5 m o le c /c m ²] Time [GMT]
(b) Feb-18 Feb-23 Feb-28 Mar-05 Mar-10 Mar-15
0 2 4 6 8 10 12 GOME NO2
Ground based measurements NO2
T ro p o sp h er ic N O2 [1 0 1 5m n o le c/ cm ²]
Fig. 5. Tropospheric slant columns of NO2(a) measured by ground based (GB) DOAS system
(off-axis and zenith-sky-data) for March 15, 1999. Tropospheric columns of NO2(b) measured
by ground based DOAS system and compared with tropospheric excess columns of GOME (GOME is only measuring at 10:30 a.m. and therefore not able to observe an enhancement of localised NO2in the afternoon) for the time period of 14 February to 16 March 1999 during the INDOEX campaign.
ACPD
6, 9273–9296, 2006 O3 and NO2over Kaashidhoo A. Ladst ¨atter-Weißenmayer et al. Title Page Abstract Introduction Conclusions References Tables Figures J I J I Back CloseFull Screen / Esc
Printer-friendly Version
Interactive Discussion
Feb-18 Feb-23 Feb-28 Mar-05 Mar-10 Mar-15
1
2
3
4
5
6
GOME BrO T ro p o sp h er ic B rO [1 0 1 3 m o le c/ cm ²]Fig. 6. Free tropospheric columns of BrO calculated from GOME data for the time period of
February to March 1999 during the INDOEX campaign using the difference between “low cloud” and “high cloud” observations.

![[PDF] Support de cours Arduino Bootloader pdf | Cours Arduino](data:image/gif;base64,R0lGODlhAQABAIAAAP///wAAACH5BAEAAAAALAAAAAABAAEAAAICRAEAOw==)