HAL Id: insu-01756056
https://hal-insu.archives-ouvertes.fr/insu-01756056
Submitted on 28 Mar 2019
HAL is a multi-disciplinary open access
archive for the deposit and dissemination of
sci-entific research documents, whether they are
pub-lished or not. The documents may come from
teaching and research institutions in France or
abroad, or from public or private research centers.
L’archive ouverte pluridisciplinaire HAL, est
destinée au dépôt et à la diffusion de documents
scientifiques de niveau recherche, publiés ou non,
émanant des établissements d’enseignement et de
recherche français ou étrangers, des laboratoires
publics ou privés.
Ice crystal number concentration estimates from
lidar–radar satellite remote sensing – Part 2: Controls
on the ice crystal number concentration
Edward Gryspeerdt, Odran Sourdeval, Johannes Quaas, Julien Delanoë,
Martina Krämer, Philipp Kühne
To cite this version:
Edward Gryspeerdt, Odran Sourdeval, Johannes Quaas, Julien Delanoë, Martina Krämer, et al.. Ice
crystal number concentration estimates from lidar–radar satellite remote sensing – Part 2: Controls
on the ice crystal number concentration. Atmospheric Chemistry and Physics, European Geosciences
Union, 2018, 18 (19), pp.14351-14370. �10.5194/acp-18-14351-2018�. �insu-01756056�
https://doi.org/10.5194/acp-18-14351-2018 © Author(s) 2018. This work is distributed under the Creative Commons Attribution 4.0 License.
Ice crystal number concentration estimates from lidar–radar
satellite remote sensing – Part 2: Controls on the ice crystal
number concentration
Edward Gryspeerdt1, Odran Sourdeval2,a, Johannes Quaas2, Julien Delanoë3, Martina Krämer4, and Philipp Kühne2 1Space and Atmospheric Physics Group, Imperial College London, London, UK
2Institute for Meteorology, Universität Leipzig, Leipzig, Germany
3Laboratoire Atmosphères, Milieux, Observations Spatiales/IPSL/UVSQ/CNRS/UPMC, Guyancourt, France 4Forschungszentrum Jülich, Institut für Energie und Klimaforschung (IEK-7), Jülich, Germany
anow at: Laboratoire d’Optique Atmosphérique, Université Lille 1, Villeneuve d’Ascq, France
Correspondence: Edward Gryspeerdt ([email protected]) Received: 5 January 2018 – Discussion started: 31 January 2018
Revised: 3 September 2018 – Accepted: 4 September 2018 – Published: 9 October 2018
Abstract. The ice crystal number concentration (Ni) is a key
property of ice clouds, both radiatively and microphysically. Due to sparse in situ measurements of ice cloud properties, the controls on the Nihave remained difficult to determine.
As more advanced treatments of ice clouds are included in global models, it is becoming increasingly necessary to de-velop strong observational constraints on the processes in-volved.
This work uses the DARDAR-Nice Niretrieval described
in Part 1 to investigate the controls on the Ni at a global
scale. The retrieved clouds are separated by type. The ef-fects of temperature, proxies for in-cloud updraft and aerosol concentrations are investigated. Variations in the cloud top Ni (Ni(top)) consistent with both homogeneous and
hetero-geneous nucleation are observed along with differing rela-tionships between aerosol and Ni(top)depending on the
pre-vailing meteorological situation and aerosol type. Away from the cloud top, the Nidisplays a different sensitivity to these
controlling factors, providing a possible explanation for the low Nisensitivity to temperature and ice nucleating particles
(INP) observed in previous in situ studies.
This satellite dataset provides a new way of investigat-ing the response of cloud properties to meteorological and aerosol controls. The results presented in this work increase our confidence in the retrieved Niand will form the basis for
further study into the processes influencing ice and mixed phase clouds.
1 Introduction
Clouds play a central role in the Earth’s energy budget, as they are responsible for large variations in the reflected short-wave and emitted longshort-wave radiation (Stephens et al., 2012). The response of clouds to changing greenhouse gases and aerosols remains one of the largest uncertainties in under-standing past and future climate changes (Boucher et al., 2013). Significant advances have been made into modeling and observing the role of aerosols in liquid clouds (e.g. Wang et al., 2011; Wood et al., 2011; Seifert et al., 2015; Get-telman, 2015; Ghan et al., 2016; Zuidema et al., 2016), es-pecially through the use of retrievals of the cloud droplet number concentration (e.g. Quaas et al., 2008; Gryspeerdt et al., 2016), but the impact of aerosols on high clouds re-mains uncertain (Gettelman et al., 2012; Jensen et al., 2016; Zhou et al., 2016; Heyn et al., 2017). A large part of this un-certainty comes from the difficulty in retrieving cirrus cloud properties at a large enough scale to separate the roles of in-dividual factors controlling the ice crystal number concentra-tion (Ni).
i
A key microphysical property of ice clouds, the Ni links
the aerosol environment to dynamic effects driving cloud updrafts and the generation of supersaturation (Pruppacher and Klett, 1997). Through changes in the ice crystal size, changes in the Ni can have far-reaching implications
for a cloud, impacting the radiative (Liou, 1986; Fusina et al., 2007), precipitation and cloud lifetime properties (Lindsey and Fromm, 2008). The Niis often used as a
prog-nostic variable in two-moment cloud microphysics schemes (e.g. Lohmann et al., 2007; Salzmann et al., 2010). This high-lights a requirement to understand the controls on the Niin
order to improve our understanding and parameterization of cloud processes. While aircraft measurements of the Ni
ex-ist, they are restricted in space and time. They can also be affected by shattering of ice crystals at the instrument in-let (McFarquhar et al., 2007; Jensen et al., 2009; Korolev et al., 2013) and difficulties in measuring the smallest crys-tals (O’Shea et al., 2016). In this paper, the new DARDAR-Nice satellite dataset described in Part 1 (Sourdeval et al., 2018a) allows the processes that control the Nito be
investi-gated globally.
It is known that the temperature plays a strong role in de-termining the ice crystal nucleation rate. The homogeneous nucleation rate is a strong function of temperature and su-persaturation (Koop et al., 2000), with atmospherically rele-vant nucleation only taking place at temperatures colder than 235 K. This strong temperature dependence in the nucleation rate does not necessarily correspond to a strong temperature dependence in the Ni(Heymsfield and Miloshevich, 1993).
A weak Ni temperature dependence was found by Gayet
et al. (2004). Krämer et al. (2009) found similar results, with a slight reduction in the Ni for the coldest measurements.
Higher Ni values have been observed at cold temperatures
during ATTREX (Jensen et al., 2013a, 2016) than in Krämer et al. (2009), leading to a weak combined temperature de-pendence. However, using different datasets targeting differ-ent cloud types, Muhlbauer et al. (2014) and Jensen et al. (2013b) both showed an increase in Niwith decreasing
tem-perature, demonstrating that there is still considerable uncer-tainty regarding the Nitemperature dependence.
The in situ homogeneous nucleation of ice crystals is also dependent on the supersaturation (Koop et al., 2000; Lohmann and Kärcher, 2002), which is often generated through cooling due to vertical air motion. Large-scale up-drafts cannot reproduce observed cirrus properties on their own, the smaller scale variation in updraft provided by grav-ity waves is necessary (Kärcher and Ström, 2003) and is oc-casionally able to produce cirrus in regions of large-scale subsidence (Muhlbauer et al., 2014). These small-scale up-drafts can produce Ni values as high as 50 000 L−1 (Hoyle
et al., 2005), highlighting the important role that vertical mo-tion can play in determining the Ni.
Although ice can form by in situ nucleation, many ice crystals also form through the freezing of liquid condensate. This liquid-origin cirrus often originates from high updraft
regions in mixed-phase clouds, forming thicker cirrus than those composed of in situ ice (Krämer et al., 2016; Lue-bke et al., 2016). Synoptic-scale updrafts can also produce liquid-origin cirrus in the midlatitudes (Wernli et al., 2016). The Niformed through these liquid-origin processes is also
strongly dependent on the cloud-scale updrafts, with higher updrafts maintaining higher ice supersaturations and produc-ing larger Ni values (Kärcher and Seifert, 2016; Kärcher,
2017).
Aerosol also plays a role in determining the Ni, although
its impact is complicated by variations in ice crystal nucle-ation pathways and aerosol properties. While any particle can theoretically act as a homogeneous nucleation center given a high enough supersaturation, in practice these aerosols are often hydrophilic liquid aerosols (Kojima et al., 2004). Increases in the aerosol number can result in an increase in Nithrough increased homogeneous nucleation. However,
in many situations, the Niis limited by dynamical concerns,
which limits the impact of aerosols (DeMott et al., 1997; Lohmann and Kärcher, 2002; Kay and Wood, 2008; Bara-hona and Nenes, 2008; Jensen et al., 2013a, 2016).
A second class of aerosols, known as ice nucleating par-ticles (INP) are able to nucleate ice heterogeneously and can freeze liquid water droplets at temperatures warmer than 235 K. At these warmer temperatures, the presence of INP will often control the Ninear nucleation locations (Kärcher
and Lohmann, 2003), as they form the sites for creating an ice crystal, although the nucleating ability of these INP is also a strong function of temperature (Hoose and Möhler, 2012). As heterogeneous nucleation can take place at a lower su-persaturation than homogeneous nucleation, the introduction of INP has the ability to prevent homogeneous nucleation by depressing the supersaturation. As the Niproduced through
homogeneous nucleation events is typically higher than the INP concentration (and so the Nifrom heterogeneous
nucle-ation), this implies that the introduction of INP into a clean atmosphere can reduce the Ni(DeMott et al., 1997; Kärcher
and Lohmann, 2003). In situ (Gayet et al., 2004) and satellite studies (Chylek et al., 2006) have provided some evidence for a possible decrease in Ni with increasing aerosol based
on regional and hemispheric differences in ice crystal prop-erties, although it has proved difficult to conclusively link these Nichanges to a change in INP.
The relative role of heterogeneous and homogeneous nu-cleation in the atmosphere is unclear, making it difficult to develop observational constraints on the impact of aerosols on the Ni(e.g. Cziczo et al., 2013; Gasparini and Lohmann,
2016; Kärcher and Seifert, 2016; Jensen et al., 2016). In ad-dition, changing conditions over the life cycle of a cloud can result in a switch between nucleation mechanisms (Krämer et al., 2016); nucleation is also not the only control on the Ni.
The rarity of INP suggests that other processes, such as ice multiplication, are required to explain the Niobserved in the
i
These four factors (temperature, supersaturation/updraft, ice origin and aerosol environment) are all thought to influ-ence the Niin high clouds, but significant uncertainties
re-main in assessing the role of these factors on the Ni. First,
al-though they have been investigated using aircraft and balloon measurements (Podglajen et al., 2016, 2017), the ice origin and in-cloud updraft are difficult to determine from observa-tions at a global scale and over a significant period of time. A recent classification (Gryspeerdt et al., 2018a) has shown some skill at determining these quantities when compared to a convection permitting model and is used in this work to account for this issue.
Second, the Niis a difficult property to measure at a global
scale. Aircraft measurements are limited in space and time and have been afflicted by shattering of crystals on the tips of measurement probes, casting doubt on some earlier mea-surements of the Ni (McFarquhar et al., 2007; Jensen et al.,
2009; Korolev et al., 2013). Additionally, due to the highly variable nature of cirrus clouds and their strong sensitivity to environmental conditions, it can be difficult to separate the relative roles of aerosol and dynamics (Gayet et al., 2004).
The retrieval presented in Part 1 of this work (Sourde-val et al., 2018a) has demonstrated that the Ni can be
re-trieved using a combined radar–lidar retrieval, and that this compares well to new in situ aircraft measurements where shattering is accounted for. Combined with simultaneous re-trievals of the ice water content, this allows the global distri-bution of the Niand the factors that control it to be
investi-gated. Using reanalysis aerosol concentrations and a proxy for the INP concentration, the impact of aerosols on high clouds is also investigated, highlighting avenues for future research into cirrus cloud processes.
2 Methods
The Nidataset used in this work (DARDAR-Nice) has been
described in detail in Part 1 of this work (Sourdeval et al., 2018a), so only the main features are outlined here. The DARDAR-Nice product is based on the DARDAR retrieval (Delanoë and Hogan, 2010), a combined raDAR–liDAR re-trieval of ice cloud water content (IWC) and ice crystal ef-fective radius using data from the CloudSat and CALIPSO satellites at approximately 13:30 LST (local solar time). Only daytime data from the period from 2006 to 2013 is used in this work due to constraints in the reanalysis data availabil-ity. The properties are retrieved at a horizontal resolution of 1.7 km and a vertical resolution of 60 m. Both the DARDAR IWC and the DARDAR-Nice Niretrieval compare favorably
to in situ aircraft data (Deng et al., 2013; Sourdeval et al., 2018a). The best agreement is at temperatures below −30◦C, where the retrievals are more accurate due to the dominance of unimodal ice crystal size distributions and reduced ambi-guity in the cloud phase.
To investigate the controls on ice crystal nucleation, a more in-depth study is performed of the Ni near the cloud
top (Ni(top)). As the cloud top is the location of the coldest
temperature in the cloud, it has the highest theoretical nucle-ation rates. Although the cloud top is close to the nuclenucle-ation region in wave clouds (e.g. Spichtinger and Gierens, 2009a), this is not always the case and the Ni(top) can be rapidly
reduced by differential sedimentation and entrainment (e.g. Jensen et al., 2013a). However, as the coldest temperature, it provides a limitation on the maximum nucleated Ni within
the cloud, restricting the impact of temperature variability due to the vertical extent of the cloud. The cloud top is taken to be the top 120 m of the cloud and only the uppermost cloud layer (in multilayer situations) is used to avoid issues with ice being seeded by ice crystals falling from overlying layers. The data are also restricted to locations where the retrieval has gone through at least two iterations, limiting the impact of prior assumptions about the cloud structure.
Four main controls on the Ni(top) are considered in
this work: temperature, cloud-scale updraft, ice origin and aerosol. Temperature data in this study are taken from the ECMWF ERA-Interim reanalysis (Dee et al., 2011). Infor-mation about the cloud-scale updraughts and the ice-origin (liquid/ice) cannot yet be directly obtained at a global scale using satellites. To provide an indication of these cloud properties, the IC-CIR classification from Gryspeerdt et al. (2018a) is used. This classification is based on the assumed cirrus source (orographic, frontal, convective or synoptic) and determined at 13:30 LST using cloud retrievals from the MODIS instrument (Platnick et al., 2017) and reanaly-sis data. This classification selects orographic clouds by as-suming the product of the topographic variation and the wind speed is related to the in-cloud updraft, similar to global cli-mate model parameterizations (e.g. Joos et al., 2008). The Oro 2 and Oro 1 regimes are the regimes with the respec-tive highest and second highest sextiles of the parameterized in-cloud updraft. Frontal and convective regimes are selected as connected regions of high level cloud that intersect with reanalysis fronts and regions of large-scale updraft, respec-tively. Finally, the synoptic regime is taken as a residual, with clouds being considered synoptic if they do not fit any of the other classes. Through comparisons with convection permit-ting model data and classifications based on reanalysis data, this classification has been shown to provide useful informa-tion on the cloud scale updrafts and the ice origin. While not a direct retrieval of these properties, it does allow some inferences to be made regarding the response of the Ni to
these factors. The results in this paper are restricted to day-time data, which in turn restricts it to 13:30 LST due to the orbit of the satellites used to construct the DARDAR-Nice dataset.
To investigate a possible aerosol link to Ni, we use the
“monitoring atmospheric composition and climate” (MACC) aerosol reanalysis product (Morcrette et al., 2009; Benedetti et al., 2009), which assimilates MODIS aerosol optical
i
depth (AOD) retrievals into the ECMWF integrated forecast system. The MACC product provides altitude information for aerosols along with speciation information. Although the MACC speciation has not yet been validated, the MODIS cloud droplet number concentration shows a stronger sensi-tivity to hydrophilic aerosol types than hydrophobic aerosols, suggesting that the MACC speciation conveys useful infor-mation about the aerosol type (Gryspeerdt et al., 2016). Fur-ther from sources, where ageing and oFur-ther assumptions come into play, the speciation may be less accurate. In the up-per troposphere, liquid aerosol is thought to be the domi-nant aerosol component (Kojima et al., 2004), although re-cent studies have noted that glassy organic aerosols are abun-dant in the upper atmosphere and can act as INP at tempera-tures below −55◦C (Murray, 2008; Wilson et al., 2012). This work takes the MACC total mass concentration as a measure of the liquid aerosol concentration – high (low) aerosol is more (less) than 6 µg m−3, with the caveat that this measure of aerosol may shift towards a measure of INP at the coldest temperatures considered in this work.
The response of the Ni to aerosol is likely to vary by
aerosol type (Pruppacher and Klett, 1997). Although MACC provides a dust speciation, it is not clear whether this can be used to determine the presence of INP. Previous studies have suggested that high altitude aerosol may be responsible for glaciating clouds between 0 and −35◦C (Choi et al., 2010; Kanitz et al., 2011; Zhang et al., 2012; Tan et al., 2014). Based on this previous work, the glaciation of clouds be-tween 0 and −35◦C is used as a proxy for the occurrence of INP.
Cloud phase is determined using the DARDAR phase de-tection algorithm (v1.1.4; Delanoë and Hogan, 2010). This algorithm uses the different response of lidar backscatter and radar reflectivity to liquid and ice hydrometeors to identify glaciated clouds. Clouds with a peak in lidar backscatter at the cloud top are treated as liquid or mixed phase and those with only a strong radar return are treated as glaciated. Expe-rience suggests that the retrieved phase can be unreliable for clouds less than 600 m thick, so these are excluded from this part of the analysis.
Using this cloud top phase product, a “glaciation index” is developed using the phase retrievals between 0 and −35◦C. As approximately half of cloud tops are glaciated at −20◦C, glaciated clouds with a top temperature warmer than −20◦C are identified as “warm ice”, and liquid topped clouds colder than −20◦C are identified as “cold liquid”. The warm ice pixels are taken to indicate the presence of INP within 100 km (the approximate spatial scale of aerosol variabil-ity from Weigum et al., 2012), whilst the cold liquid pix-els are taken to indicate a relatively INP-free environment. If both (or neither) are detected within 100 km, that pixel is excluded from the analysis. The cloud phase is only used for the uppermost cloud layer when determining this INP proxy to reduce the impact of overlying ice clouds seeding ice in lower layers. In addition, regions with nearby higher cloud
layers (those within a 10 : 1 glide slope) are also excluded from the glaciation index. To reduce the impact of random errors in the phase retrieval, two or more neighboring pixels are required for a detection of warm ice or cold liquid. This glaciation index is produced for each DARDAR vertical pro-file and is then used as a proxy for the occurrence of INP at temperatures colder then −35◦C in that profile. The use of cloud glaciation as an INP proxy for colder temperatures in the atmosphere assumes that cloud glaciation is correlated to INP between 0 and −35◦C and that there is a sufficient ver-tical correlation in INP occurrence. These assumptions are discussed in Sect. 4.2.1.
This combination of reanalysis temperature and aerosol data, along with previously determined clouds regimes and a proxy for INP are used globally for daytime data over the period from 2006 to 2013 to investigate the role of different processes on the Ni.
3 Results
3.1 Global Ni(top)distribution
The global Ni(top) distribution for crystals larger than
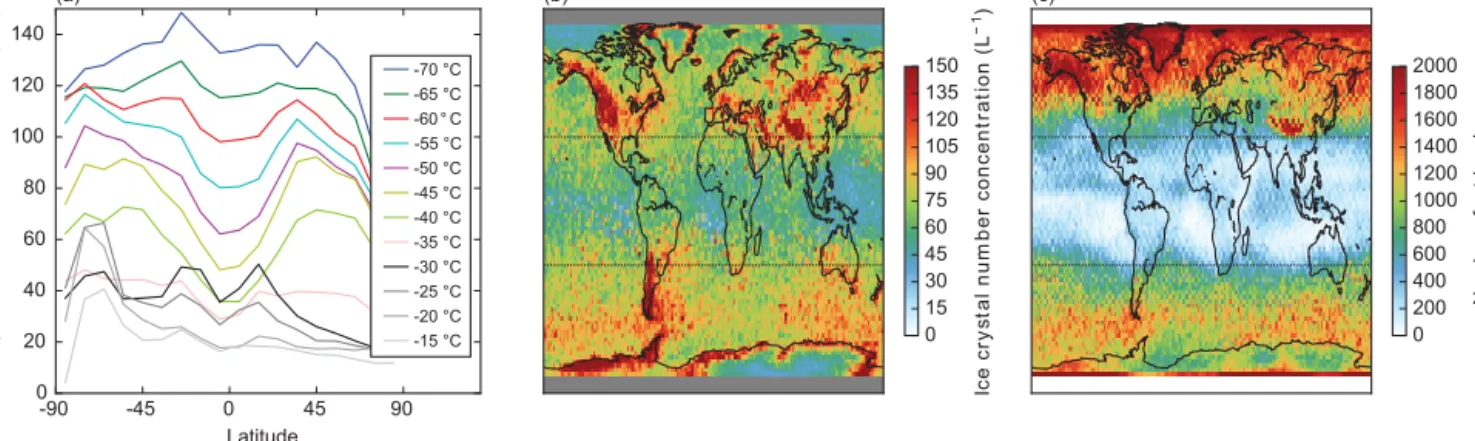
5 µm (Ni(top)5 µm) displays several features that highlight the role of different cloud processes in controlling the Ni(top)5 µm. The zonal mean Ni(top)5 µm (Fig. 1a) shows a strong tempera-ture dependence, with significant increases in the Ni(top)5 µm as the temperature decreases from a mean of around 40 L−1at −35◦C to almost 140 L−1at −70◦C. This temperature de-pendence is particularly strong at temperatures colder than −40◦C in both the northern and the southern midlatitudes.
There is also a strong Ni(top)5 µm increase in the tropics, al-though the initial increase in Ni(top)5 µm at −40◦C is weaker. Al-though the Niproduced by heterogeneous nucleation should
also increase as temperatures decrease due to increasing INP concentrations (DeMott et al., 2010), this strong increase in Ni(top)5 µm at −40◦C along with a continuing Ni increase
at colder temperatures is indicative of homogeneous nucle-ation, which is only significant at temperatures below around −35◦C.
At temperatures warmer than −35◦C, the mean Ni(top)5 µm is relatively small, especially in the Northern Hemisphere where it averages less than 50 L−1. This is expected from het-erogeneous nucleation, where the Ni(top)5 µm is limited by avail-able INP. The mean Ni(top)5 µm is much larger in the Southern Hemisphere and the tropics, although this is skewed by the long tail of the Ni(top)5 µm distribution (Fig. 2). A phase mis-classification, with liquid topped cloud being mistaken for ice cloud might explain this hemispheric contrast, due to the large amounts of supercooled water in the Southern Hemi-sphere (Choi et al., 2010). A strong lidar backscatter at the
i
cloud top would lead to a large retrieved Ni(top)5 µm (if it was misclassified as an ice cloud). As liquid topped clouds at sub-zero temperatures are more common in the Southern Hemi-sphere, this would result in an erroneously large mean Niin
the Southern Hemisphere.
There are large geographical variations in Ni(top)5 µm. At −50◦C, the Ni(top)5 µm is strongly affected by the topography (Fig. 1b). High Ni(top)5 µm values are retrieved in mountainous regions over land and around the edge of the Antarctic ice sheet, similar to results from orographic cirrus parameteriza-tions in global climate models (e.g. Joos et al., 2008; Bara-hona et al., 2017) and other satellite retrievals (Mitchell et al., 2016, 2018). This is consistent with a high Ni(top)5 µm being generated through orographic uplift, which can generate the strong updrafts and high supersaturations required for homo-geneous nucleation. While it is possible that the increased Ni(top)5 µm is due to an increase in the vertical transport of INP, the lack of a similar pattern in the cloud supercooled fraction at −20◦C (Choi et al., 2010) makes this explanation unsatis-factory. The Ni(top)5 µm in the tropics is comparatively low, even in regions of significant topography such as the Ethiopian highlands. This is due to low wind speeds in the tropics re-ducing the in-cloud orographic updraft, similar to the GCM results of Joos et al. (2008). The high orographic Ni(top)5 µm also partially explains the hemispheric asymmetry in Ni(top)in the
midlatitude and polar regions, due to the high Ni(top)5 µm gen-erated by orographic clouds over the Andes and around the edge of the East Antarctic ice sheet. The Ni(top)5 µm in the tropics is significantly lower than the Ni5 µmat −50◦C (Part 1). This is partly due to the low number of cloud tops at this temper-ature in the tropics, meaning that there is a clear sampling bias. Additionally, the cloud top temperature plays an impor-tant role in determining the Ni5 µm, giving it a much weaker temperature dependence. This temperature dependence is in-vestigated further in the following two subsections.
3.2 Cloud regime dependence
The location map and temperature dependence of the Ni(top)5 µm (Fig. 1) and the results from Part 1 hint that there may be a significant regime dependence in the Ni(top), in particular
a strong role for orographic clouds and a possible role for convective clouds, given the low Ni(top) in the tropics.
Sep-arating the Ni(top)data by regime using the classification of
Gryspeerdt et al. (2018a) allows this dependence to be inde-pendently investigated. Due to the strong temperature depen-dence and the large variability of the Ni(top), joint probability
histograms, showing the probability of a Ni(top) retrieval at
a given temperature are shown in Fig. 2. Following the re-sults of Part 1, the Ni(top)is investigated for crystals bigger
than 5 µm (Ni(top)5 µm) and 100 µm (Ni(top)100 µm). With a minimum size of 5 µm, Ni(top)5 µm typically lines up with the smallest sizes
measured by in situ instruments, while with a larger mini-mum size, Ni(top)100 µm covers a size range where less shattering is expected and where the normalized size distribution per-forms well (Delanoë et al., 2005; Sourdeval et al., 2018a). As noted in the previous section, the skewed Ni(top)
distribu-tion makes a simple linear average complicated to interpret. For the remainder of this work, normalized joint histograms are used, showing the probability of finding a particular Ni,
given that a certain temperature has been observed.
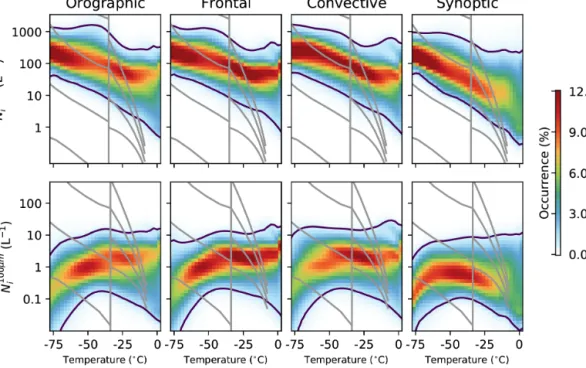
There are a number of broad similarities between the regimes. Each regime shows a very similar increase in Ni(top)5 µm with decreasing temperature, with the decrease becoming weaker at very colder temperatures, rising to around 100 L−1 at −75◦C. While this is larger than the Ni values reported
from many measurements of tropical tropopause layer cirrus (e.g. Jensen et al., 2013a), this may be due to sampling dif-ferences between the satellite and in situ measurements, with some of the thinnest clouds being missed by the DARDAR retrieval. It is also possible that uncertainties in the shape of the particle size distribution (PSD) can lead to overesti-mations of Ni(top)5 µm by as much as a factor of 2 (Sourdeval et al., 2018a). The temperature dependence is similar to that observed during the SPARTICUS and MACPEX campaigns (Jensen et al., 2013b; Muhlbauer et al., 2014), although the temperature dependence is stronger than that observed in Krämer et al. (2009) where the Ni was sampled in cloud,
rather than at the cloud top. However, if the satellite data are sampled in a manner similar to previous work, it reproduces the in situ results (Sourdeval et al., 2018a), giving confidence in the magnitude and temperature dependence of the results presented here. There is evidence of possible retrieval errors, as both the orographic and convective regimes have a small number of retrievals of over 30 L−1, with some as high as 50 L−1, around −15◦C. This suggests that the possible phase misclassification and the high Ni(top)values observed in the
zonal mean are more common in certain regimes.
All of the regimes also show a peak in the highest Ni(top)5 µm percentiles at temperatures just colder than −35◦C. The
strength varies by regime, with the orographic regime show-ing a stronger peak and only a weak peak beshow-ing observed in the frontal and convective regimes. The peak is barely present in the synoptic regime. An increase in the largest Ni(top)5 µm val-ues at this temperature is consistent with homogeneous nu-cleation, either through an increase in the freezing of liquid droplets or by increased homogeneous nucleation through the freezing of unactivated aqueous haze particles. At these colder temperatures, the Ni(top) is roughly parallel with the
contours of Niexpected through homogeneous nucleation at
a constant updraft (Krämer et al., 2009), especially in cases where the peak in Ni(top)5 µm at −40◦C is small (Fig. 2). Warmer than −35◦C, the Ni(top)5 µm is broadly consistent with the num-ber of INP predicted by the DeMott et al. (2010) parameter-ization, but the Ni(top)5 µm becomes increasingly large compared
i -90 -45 0 45 90 Latitude 0 20 40 60 80 100 120 140 Ic e cr y st a l n u m b er c on ce n tr a ti on ( L −1 ) (a) -70 °C -65 °C -60 ° C -55 °C -50 °C -45 °C -40 °C -35 °C -30 °C -25 °C -20 °C -15 °C (b) 0 15 30 45 60 75 90 105 120 135 150 Ic e cr y st a l n u m b er c on ce n tr a ti on ( L −1 ) (c) 0 200 400 600 800 1000 1200 1400 1600 1800 2000 Number of retrievals
Figure 1. (a) The zonal mean DARDAR-Nice cloud top Ni (Ni(top)5 µm) for crystals larger than 5 µm as a function of temperature from DARDAR-Nice data for the period from 2006 to 2013. Temperatures warmer than −35◦C are in greyscale. (b) The mean Ni(top)5 µm at −50◦C. Grey indicates missing data. (c) The number of cloud top retrievals at −50◦C. Zonal means and maps of Niare available in Part 1.
Figure 2. The conditional Ni(top)(L−1) for 5◦C temperature bins for each of the main cloud regimes (orographic, frontal, convective and synoptic) from Gryspeerdt et al. (2018a, O2, F, C and S). The top row shows the Ni(top)for particles greater than 5 µm (Ni(top)5 µm) and the
bottom row shows the Ni(top)for particles greater than 100 µm (Ni(top)100 µm). The columns are normalized so that they sum to 100 %. The
vertical line is drawn at −35◦C – approximately the homogeneous nucleation threshold temperature. At temperatures warmer than −35◦C, the grid lines show the INP numbers predicted by the DeMott et al. (2010) parameterization for 0.1, 1, 10 and 100 L−1aerosols > 0.5 µm. The grid lines at temperatures below −35◦C are the Nivalues following Koop et al. (2000) for 1, 10 and 100 cm s−1updraft speeds for a
mean pressure and an aerosol particle number of 300 cm−3, following Krämer et al. (2009). The regime names and definitions are given in Table 1 of Gryspeerdt et al. (2017). Note the log scale for Ni(top).
to the number of INP as the temperature increases. As the DARDAR-Nice retrieval has not been evaluated at this tem-perature, it is unclear if this is a real effect, or if it is due to the possible phase classification issue mentioned previously.
The variation in the strength of this peak is clearly seen when comparing the Oro 2 and Oro 1 regimes (the highest and second highest sextiles of the estimated in-cloud updraft) in Fig. 3a. While there is little difference between the regimes at warmer temperatures, below −35◦C there is a strong
in-i
Figure 3. (a) The difference in the Ni(top)5 µm as a function of tempera-ture between the Oro 2 and Oro 1 regimes (highest and second high-est sextiles of high-estimated in-cloud updraft, respectively). Red above blue at a given temperature indicates an increased Ni(top)5 µm in the Oro 2 regimes compared to Oro 1. (b) The difference between the frontal and synoptic regimes. Note the different color scale from (a).
crease in the Ni(top)5 µm in the Oro 2 regime. This increase peaks at about −50◦C, reducing and then almost disappearing at the coldest temperatures studied. The high Ni(top)5 µm retrieved in these clouds and the strong dependence on the in-cloud updraft explain the geographical pattern shown in Fig. 1b, where high Ni(top)5 µm are observed in mountainous regions. A high Ni(top)5 µm in these regimes is supported by results from pre-vious in situ studies, where large Ni values were recorded
in orographic clouds (Jensen et al., 1998; Field et al., 2001; Baker and Lawson, 2006).
It is possible that this increased Ni(top)5 µm is the result of in-creased aerosol concentrations carried to lower temperatures in the stronger updrafts of the Oro 2 regime. However, the lack of a difference in Ni(top)5 µm between the regimes at tempera-tures warmer than −35◦C indicates that an increase in INP is not driving this change in Ni(top)5 µm, which in turn makes it less likely that this change is due to a change in liquid aerosol. As the Oro regimes are defined by the estimated in-cloud up-draft (Gryspeerdt et al., 2018a), the difference between the regimes shown in Fig. 3 is likely due to a change in the up-draft environment impacting freezing processes.
A change in the updraft environment could modify the Ni(top)5 µm by changing the likelihood of homogeneous nucle-ation, either through allowing more liquid droplets to reach temperatures where they can freeze homogeneously or by in-creasing the nucleation of haze droplets (Koop et al., 2000). These processes cannot be easily distinguished in the current study, although the lack of a significant occurrence of liquid-topped cloud in orographic regions (Tan et al., 2014) sug-gests that an increased cloud droplet number concentration is not the leading contributor to the increase in Ni(top)5 µm. This strong response to updraft changes would support previous studies that highlighted the updraft limited nature of many cirrus clouds (Kay and Wood, 2008; Barahona and Nenes, 2008). A larger difference exists between the frontal and syn-optic regimes (Fig. 3b), indicating that the magnitude of this updraft effect could be stronger than is shown here. How-ever, the difference between the frontal and synoptic regimes cannot be easily attributed to updraft variations.
The temperature dependence of crystals larger than 100 µm (Ni(top)100 µm) at the cloud top displays a different pat-tern (Fig. 2, bottom row). While Ni(top)100 µmand temperature are negatively correlated at warmer temperatures, the Ni(top)100 µm reaches a peak at around −50◦C and there is a decrease in the Ni(top)100 µmas temperatures reduce further, with the strongest de-crease observed in the orographic regime. This is consistent with a shift towards smaller ice crystals at the cloud top with colder temperatures. The synoptic regime shows a weaker decrease in Ni(top)100 µm, indicating a slightly larger role for larger ice crystals in this regime. This shift towards smaller crystals at the cloud top is expected due to slower depositional growth and aggregation of ice crystals at colder temperatures result-ing in crystals precipitatresult-ing from the cloud top region before they grow larger than 100 µm.
3.3 The Niwithin clouds
The behavior of the Niwithin clouds as a function of
tem-perature displays some significant contrasts to the Ni(top)5 µm (Fig. 4). While all of the regimes show an increase in the Ni5 µm with decreasing temperature, this increase is much weaker than the increase in the Ni(top)5 µm. Similarly, although the peak that is visible in the Ni(top)5 µm at about −40◦C is still
visible in Ni5 µmin the orographic and frontal regimes, it is much weaker than the peak observed at the cloud top. The synoptic regime has the strongest temperature dependence of all of the regimes. One explanation is the lower average cloud depth, such that the Ni5 µm retrieved is often closer to the cloud top than in the other regimes. In all of the regimes, the Ni5 µm is much larger in-cloud than at the cloud top for temperatures warmer than −30◦C, with values up to 100 L−1 being commonly observed. The smaller Ni5 µmvalues that are more typically observed in the synoptic regime than the other
i
regimes suggest that seasonal variations of the cloud classes (Gryspeerdt et al., 2018a) are likely responsible for the sea-sonal variations in Ni5 µmobserved in Part 1.
Similar to the Ni5 µm, the temperature dependence of the Ni100 µm is very different internally within clouds compared to at cloud tops. The temperature dependence is much weaker, with almost no temperature dependence at tempera-tures warmer than −50◦C. There is a decrease in the Ni100 µm at the lowest temperatures, similar to the decrease in the Ni(top)100 µm seen in Fig. 2 and is explained by the retrievals at these temperatures being closer to the cloud top than at warmer temperatures. The synoptic regime has the lowest Ni100 µm at warmer temperatures, which may again be due to the lower geometrical thickness of clouds in this regime, such that the Ni100 µmis typically located closer to the cloud top, resulting in a lower Ni(top)100 µm for any given temperature inside a cloud.
The larger Ni100 µm values at warmer temperatures mean that larger crystals comprise a larger proportion of the Ni5 µm, with a reduced contribution of small crystals to the Ni5 µm. A weaker temperature dependence of the Ni5 µm, especially at temperatures colder than −35◦C, is in better agreement with
the results from Krämer et al. (2009), although a temperature dependence remains. It is possible that the weak tempera-ture dependence in previous results could be due to a lack of measurements near the cloud top, where the temperature dependence is strongest. This may also explain the apparent mismatch between the INP and Niconcentration in aircraft
data (e.g. Kanji et al., 2017), as the retrieved Ni(top) values
are a much closer match to the INP concentrations predicted by the DeMott et al. (2010) parameterization than the inter-nal Niat temperatures warmer than −35◦C (Fig. 2). Further
sampling differences between the satellite and in situ stud-ies due to the detection limits of satellite instruments and the structuring of flight campaigns may explain the remaining differences between Nidetermined using different methods.
3.4 Vertical structure of Ni
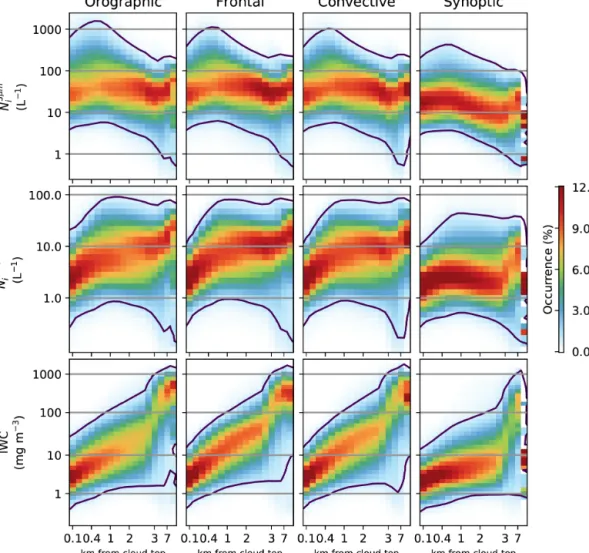
The Ni5 µm, Ni100 µmand ice water content (IWC) all change significantly as a function of depth through the cloud (Fig. 5). For clouds with a top temperature between −40 and −50◦C (Fig. 2), the Ni5 µm continues to increase until about 500 m from the cloud top, at which point it starts to decrease again (Fig. 5, top row panels). The Ni5 µmdistribution width stays approximately constant from about 1 km into the cloud until around 2–3 km from the cloud top, when it reaches a temper-ature of around −30◦C where liquid water can form more easily. At this point the Ni5 µm distribution broadens signifi-cantly. Similar to the Ni5 µm, the Ni100 µmalso grows quickly when moving down through the cloud, moving to a slower growth regime after the first 500 m from the cloud top. This
shift in the Ni100 µmgrowth regime is roughly coincident with the location of the Ni5 µmpeak. All of the regimes also show an increase in the IWC (Fig. 5, bottom row) with increas-ing depth in the cloud, which displays a sharp increase over 2.5 km from the cloud top. This sharp increase is consistent with a possible increase in ice through liquid water processes in warmer parts of the cloud.
There are some differences between the regimes. The syn-optic regime has a much weaker peak in Ni5 µm below the cloud top and a consequently lower Ni5 µm throughout the depth of the regime. Despite having similar values at the cloud top to the other regimes, the Ni100 µm and the IWC in the synoptic regime remain lower than the other regimes through the cloud, possibly due to lower in-cloud updrafts. At about 2.5 km from the cloud top, both Ni100 µm and IWC increase until they are roughly comparable to the other regimes, suggesting that the signal from liquid water swamps any signal based on ice nucleation.
The peak is also temperature dependent, almost disappear-ing in clouds with colder tops (see supplementary informa-tion) and varying in size and location between the regimes. When the peak occurs in the synoptic regime, it is within 300 m of the cloud top in 67 % of cases, compared to only 48 % of cases for the frontal regime. These distances are comparable to the thickness of nucleation regions of between 20 and 500 m noted in Jensen et al. (2016). The enhance-ment of the Ni5 µmwithin this peak in the synoptic regime is also smaller, with an average peak of 130 L−1, compared to 270 L−1in the frontal regime and 325 L−1for the orographic regime. The increased strength of this peak in regimes ex-pected to have a stronger updraft along with its location close to the cloud top may indicate homogeneous nucleation. Model studies of cirrus clouds suggest that homogeneous nucleation can produce peaks in Ni cloud to the cloud top
(Spichtinger and Gierens, 2009a, b), with an increased Ni
at higher updraft velocities. The disappearance of the peak at colder temperatures gives it a similar temperature depen-dence to the peak in the Ni(top)5 µm (Fig. 2) providing further sup-porting evidence of the impact of homogeneous nucleation on Niin this temperature range.
It is possible that the varying sensitivities of the CloudSat radar and the CALIOP lidar to crystal size and the attenu-ation of the CALIOP lidar in the upper levels of the cloud could be generating this vertical structure. The lower verti-cal resolution and sensitivity to small crystals of the radar could result in it missing the cloud top, which would gener-ate a peak in the Ni5 µmat the level where the retrieval starts to include radar information. However, the results in Part 1 show no evidence of a bias in the Niretrieval as a function of
the instruments contributing to the retrieval (Sourdeval et al., 2018a). This is primarily due to the sensitivity of the instru-ments to different ice crystal size distributions. Although the lidar-only retrievals have a higher expected error, they
usu-i
Figure 4. As in Fig. 2, but using the Nifrom throughout the cloud, rather than just the cloud top. The temperature scale is the temperature of
the Niretrieval, rather than that of the cloud top.
ally only occur in cases where there is a monomodal size distribution dominated by small crystals that can be accu-rately constrained by the lidar alone. Additionally, the disap-pearance of the peak at colder temperatures indicates that it is a physical property of the clouds, rather than a property of the retrieval, as the instrument sensitivities would not be expected to strongly vary with temperature.
4 The relationship to aerosol
4.1 The relationship to liquid aerosol
Figure 6 shows how the Ni(top)5 µm distribution changes as a func-tion of temperature and MACC reanalysis aerosol (used to indicate high concentrations of liquid aerosol). In most of the regimes, there is a positive relationship between MACC aerosol and Ni(top)5 µm at temperatures below −35◦C (shown by red above blue in Fig. 6). In the synoptic regime, this posi-tive aerosol–Ni(top)5 µm relationship only exists for temperatures warmer than −60◦C – at temperatures colder than this, the relationship becomes weak and noisy. In the other regimes, the positive relationship is maintained to very cold tempera-tures. At temperatures warmer than −35◦C, the relationship becomes a lot weaker, with almost no aerosol–Ni(top)5 µm rela-tionship existing in the orographic and convective regimes. In the frontal regime, there is a slight negative relationship, with a stronger negative relationship in the synoptic regime. It is possible that this negative relationship is related to a mis-classification of ice and liquid at these warmer temperatures
being a function of the MACC aerosol, particularly in regions where INP rich aerosol constitute a majority of the aerosol population.
The aerosol–Ni(top)100 µmrelationship shows a weaker pattern than the aerosol–Ni(top)5 µm relationship, with the smaller en-hancement of the Ni(top)100 µm at colder temperatures in most regimes indicating a shift to smaller crystal sizes. The change in the synoptic regimes is the strongest, likely related to the strong relationship for the Ni(top)5 µm. A negative relationship be-tween the aerosol environment and the crystal size has been noted in previous work (Jiang et al., 2011; Zhao et al., 2018) and often corresponds to an increase in Ni(top), although
pos-itive relationships have been observed over the Indian Ocean (Chylek et al., 2006).
It is difficult to demonstrate causality with observed aerosol–cloud relationships, to the extent that it is not clear that this relationship is a change in Ni(top) due to a change
in aerosol. However, this strong relationship between MACC aerosol and Ni(top)is consistent with an increased ice crystal
nucleation through homogeneous nucleation, which can be sensitive to the concentration of liquid aerosol (e.g. Kärcher and Lohmann, 2002). In situations where the Ni(top) is
pri-marily determined by the freezing of liquid droplets, an in-crease in cloud droplets in high aerosol regions could also lead to an increased Ni(top), although the number of droplets
frozen is relatively insensitive to the total number of liq-uid droplets (Kärcher and Seifert, 2016). As with the im-pact of in-cloud updraft on Ni(top), further investigation is
i
Figure 5. Retrieved properties as a function of the distance from the cloud top. This is for clouds with tops between −40 and −50◦C. Note the nonlinear scale on the horizontal axis.
required to determine if one of these mechanisms is domi-nant. As liquid water has been found in clouds at tempera-tures as cold as −40◦C, increased droplet freezing cannot be ruled out, even though many clouds are frozen before reach-ing this temperature (Choi et al., 2010). At colder temper-atures, it seems likely that homogeneous nucleation plays a role, as liquid droplets cannot form at these temperatures. In this case, the stronger updrafts in the frontal and convective regimes are important for generating the high supersatura-tions in which homogeneous nucleation can occur. Changing aerosol types may also play a role at temperatures colder than −60◦C, where the increasing impact of glassy aerosols may lead the aerosol to nucleate ice heterogeneously. A combina-tion of the weak expected updrafts and the increasing ability of glassy aerosol to act as an INP at low temperatures may explain the weak aerosol–Ni(top) relationship in the
synop-tic regime below −60◦C. While there is a clear relationship in Fig. 6, the change in the mean Ni(top) is small, even for
this large aerosol perturbation. At −50◦C, the mean Ni(top)5 µm
increases from around 140 to 175 L−1, an increase of 25 %. Much of this change is driven by changes in the high up-draft tail of the distribution, and producing a 25 % change in Ni(top) at −50◦C would require an updraft in excess of
1 m s−1 (Kärcher and Lohmann, 2002). While plausible for the convective and orographic regimes (Gryspeerdt et al., 2017), the large updrafts required to generate such a sen-sitivity may indicate that this relationship is affected by an updraft mediated covariation.
4.2 The relationship to an INP proxy
The sparse nature of INP measurements (e.g. Mamouri and Ansmann, 2016) and the high sensitivity of the Ni to low
INP concentrations means that it is difficult to use retrieved aerosol properties to investigate the effect of INP on the Ni(top). To avoid this issue, the glaciated fraction of clouds
lower in the atmosphere (−20◦C) is used as a proxy for the presence of INP at other levels in the atmosphere.
i
Figure 6. The difference in the conditional histograms between cases with high MACC total aerosol mass concentration (> 6 µg m−3) and low total mass concentration (< 6 µg m−3) for the four main regimes. The grid lines are the same as Fig. 2. The upper set of plots show the difference in Ni(top)5 µm and the lower in Ni(top)100 µm. The changes sum to zero vertically; red over blue indicates an increase in the Ni(top)5 µm/Ni(top)100 µm for a given temperature and regime.
4.2.1 Cloud glaciation and INP
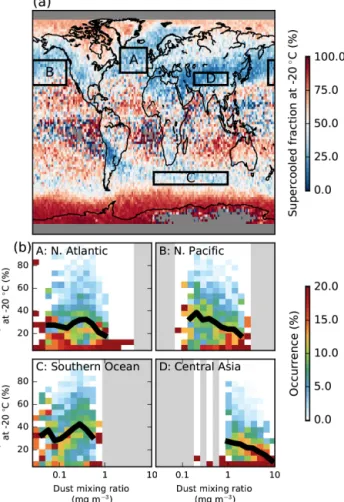
The addition of the CloudSat data in the DARDAR phase re-trieval allows smaller quantities of ice to be detected than in the lidar-only studies, but it produces a very similar pattern of cloud glaciation (Fig. 7) to the previous CALIOP studies (Choi et al., 2010; Tan et al., 2014). The supercooled frac-tion is calculated as the number of DARDAR liquid phase retrievals divided by the total number of liquid and ice re-trievals between −17.5 and −22.5◦C from 2006 to 2013. Only the phase of the top cloud layer is considered and only where this layer is more than 600 m thick.
There is a strong hemispheric contrast with a higher glaciated fraction over the Northern Hemisphere and a high supercooled fraction over the Southern Ocean and Antarc-tica, as observed in previous aircraft (Huang et al., 2012) and satellite studies (Choi et al., 2010; Tan et al., 2014). High glaciated fractions are observed over desert locations in central Asia and Iran, stretching across the North Pacific to the Americas. This is consistent with previous studies sug-gesting that dust is a good INP. Previous studies have found Asian dust over California, suggesting that transport across the Pacific is not unexpected (Creamean et al., 2013). There is also a significant proportion of glaciated cloud downwind of the Andes, which appears to originate near the Altiplano and Patagonia. These are sources of high altitude dust (Gi-noux et al., 2012) and would support the hypothesis that high
altitude dust is able to glaciate clouds. While glaciated cloud in this region has previously been noted (Choi et al., 2010), the lower resolution of the previous study made it difficult to determine the source of possible INP. The longer dataset and increased spatial resolution of Fig. 7a make the source in the upper Andes much clearer. Although southern Africa and Australia are also sources of dust (Ginoux et al., 2012), this dust is emitted at lower altitudes, which would explain the lower glaciated fractions downwind of these regions.
The origin of the glaciated region over the north Atlantic is less clear, as there are not many local sources of high level dust in the region. It is possible that the dust here has been transported across the Sahara and lofted by cyclone sys-tems crossing the Atlantic. Furthermore, it is possible that the black carbon or ash (Grawe et al., 2016) from North America may act as an INP. This might explain the lower supercooled fraction over Siberia, where black carbon from fires typically occurs without the other aerosols that are found in industrial pollution, allowing it to act as an INP (Rosenfeld et al., 2011) despite the low amounts of high level dust in this region.
The role of the ice nucleation impact of dust for driving the cloud glaciated fraction is supported by comparing the cloud glaciated fraction to reanalysis aerosol fields (Fig. 7b). Strong negative correlations between the occurrence of su-percooled liquid cloud at −20◦C and the mass concentration of reanalysis dust (Fig. 7b) are observed in some regions, with glaciated cloud dominating at high mass concentrations
i
Figure 7. (a) The DARDAR supercooled fraction at −20◦C, de-fined as the fraction of the DARDAR cloud top phase retrievals be-tween −17.5 and −22.5◦C from 2006 and 2013 that are classed as liquid. (b) The conditional probability of observing a daily mean supercooled fraction, given a specified MACC dust mixing ratio for the regions specified in (a). The black line shows the mean super-cooled fraction for each aerosol bin.
of reanalysis dust. However, this correlation varies by re-gion. A stronger relationship is found in regions close to dust sources, such as over the N. Pacific (B) and central Asia (D); the relationship is much weaker in the N. Atlantic (A) and the Southern Ocean (C) where the dust is further from source (Fig. 7b).
The stronger dust–glaciation relationship close to the dust source, where the MACC aerosol speciation is best, suggests that the supercooled fraction of clouds at −20◦C is strongly related to the occurrence of INP. The weaker relationship fur-ther from source suggests that although the MACC specia-tion has been shown to provide useful informaspecia-tion on aerosol type, this speciation is less reliable further from source. This is supported by results in liquid clouds, where the dust optical depth–cloud droplet number concentration relationship be-comes stronger further from dust sources (Gryspeerdt et al., 2016).
Due to the reduced speciation skill from MACC far from dust sources, the occurrence of glaciated cloud at −20◦C is
used as a proxy for the occurrence of INP instead of the re-analysis aerosol. This relies on the following two assump-tions: (1) cloud glaciation at −20◦C is related to INP at −20◦C; and (2) INP at −20◦C are correlated to INP at other temperatures.
Based on the relationship to MACC dust aerosol, the first assumption holds in many cases. Although the second as-sumption is tenuous, previous studies have found similar relationships between cirrus cloud properties and both col-umn and layer aerosol optical depth (AOD) (Zhao et al., 2018), similar to model results showing a significant corre-lation between high altitude cloud condensation nuclei con-centration and column AOD (Stier, 2016). Significant verti-cal aerosol autocorrelation has also been observed in global climate models (Weigum, 2014). Additionally, there is very unlikely to be a negative correlation between the INP at the two temperature levels, with the worst case being no corre-lation. As such, the relationship between the Niand the INP
proxy is unable to give a quantitative result for the impact of INP on the Ni(top)5 µm, but it is able to provide a qualitative indication of the sign of the INP impact.
4.2.2 The INP relationship to Ni(top)
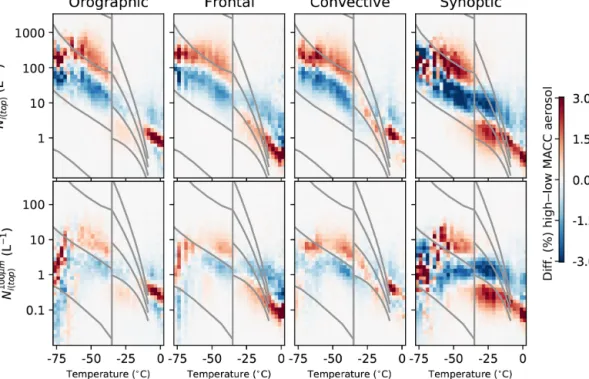
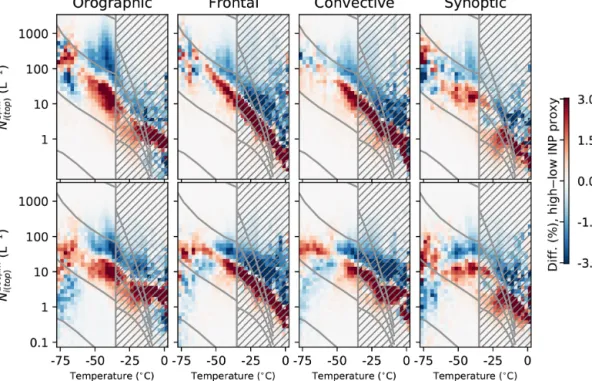
The relationship of the Ni(top)5 µm to the proxy for INP is shown in Fig. 8. There are a number of features that are similar between the regimes, in particular the strong negative rela-tionship between INP occurrence and Ni(top)5 µm at temperatures warmer than −35◦C. As with the large mean Ni(top)5 µm val-ues shown in Fig. 1a, this may be due to liquid clouds be-ing misclassified as ice, resultbe-ing in large Ni(top)5 µm values be-ing retrieved. The requirement for “warm-ice” means that supercooled liquid occurs less frequently in the high INP cases, and as such it is less likely to be misclassified as ice. The lower frequency of this misclassification then reduces the Ni(top)5 µm and Ni(top)100 µm in cases of high INP. The weaker Ni(top)5 µm response in the synoptic and orographic regimes sup-ports this, as the misclassification in these regimes is weaker (Fig. 2). The warmer temperatures are shaded out in Fig. 8 due to the impact of this potential misclassification.
At colder temperatures, the INP–Ni(top)5 µm relationship starts to vary between the regimes. All of the regimes show a de-crease in the Ni(top)5 µm between around −35 and −50◦C, the temperatures where the peak in Ni(top)5 µm is observed connected with in-cloud updraft (Fig. 3). This decrease is strongest in the orographic regime and weakest in the synoptic regime, similar to the Ni(top)5 µm peak observed in the different regimes (Fig. 2). At temperatures colder than −50◦C, the relation-ship becomes different again. In all of the regimes, there is an increase in Ni(top)100 µmwith increasing INP. This is consistent
i
Figure 8. As in Fig. 6, but showing the difference in the conditional histograms as a function of the INP proxy. Red indicates an increase in the occurrence of a particular bin at a higher inferred INP and blue indicates a decrease, meaning that red above blue indicates an increase in Ni(top)with increased INP for a given temperature. The shaded regions are likely affected by a phase misclassification at warmer
temperatures.
with an increasing number of INP shifting the size distribu-tion towards a smaller number of larger ice crystals. In the orographic and synoptic regimes, this increase also appears in the Ni(top)5 µm, generating a positive relationship between the INP proxy and the occurrence of small ice crystals.
As with the previous section, the impact of meteorologi-cal covariations cannot be ruled out when interpreting these plots. However, they are consistent with a reduction in Ni(top)5 µm due to a suppression of homogeneous nucleation by INP at around −50◦C. This relationship has previously been found in satellite relationships between the aerosol environment and the ice crystal size, with an increase in the crystal radius in situations where heterogeneous nucleation controls the Ni
(Chylek et al., 2006; Zhao et al., 2018). This would fit with the results in previous sections, suggesting that the Ni(top)
at this temperature range just slightly colder than −35◦C is influenced by homogeneous nucleation. This effect would only be expected in a narrow range of updrafts (Kärcher and Lohmann, 2002), so further work is necessary to understand the cause of this relationship.
The increase in large crystals at the coldest temperatures (below −60◦C) is consistent with an INP effect on Ni(top)
if heterogeneous nucleation was dominant at these temper-atures. This would fit with the results from Fig. 6, where at the coldest temperatures, there was a relatively small re-sponse of the Ni(top)5 µm to MACC total (liquid) aerosol,
sug-gesting that homogeneous nucleation was not controlling the Ni(top)5 µm in synoptic cirrus. At these coldest temperatures, dust can act as an INP at very low supersaturations (as low as 105 %; Möhler et al., 2006) and organic aerosol can occur in a glassy state allowing it to act as an INP. This may explain relationships consistent with heterogeneous nucleation and a classical Twomey effect at these temperatures. It is important to note that this proxy for INP relies upon the correlation be-tween cloud glaciation at −20 and INP at −50◦C, but the absence of this correlation would produce no relationship in Fig. 8, giving some confidence to the qualitative nature of these results.
If the peak in Ni(top)5 µm at temperatures colder than −35◦C is primarily due to droplet freezing, an increase glaciated frac-tion at warmer temperatures could also result in this reduc-tion of Ni(top)5 µm with increasing INP. As the number of INP and Niwarmer than −35◦C is much lower than the cloud droplet
number concentration, the increase in cloud glaciation could result in a reduction in the number of cloud droplets avail-able to form ice crystals at −35◦C. This would result in a negative relationship between cloud glaciation at −20◦C and the Ni(top)5 µm at colder temperatures as observed in Fig. 8. As with the relationship of Ni(top) to updraft (Fig. 3) and
aerosol (Fig. 6), the difference between an aerosol impact on homogeneous nucleation, a change in droplet freezing or
i
an updraft-mediated covariation (no causal effect of aerosol) cannot be distinguished by this analysis.
5 Vertical information propagation
The changes in Ni(top)5 µm observed in the previous section have impacts throughout the depth of the cloud. Figure 9 shows how Niand IWC information propagates vertically within a
cloud. The cloud profiles are split into two categories, based on whether they have above or below median values of the cloud top properties (Ni(top), IWC(top)). The difference in the
vertical structure of the clouds (in a similar manner to Fig. 5) is shown, with red over blue indicating an increase in the retrieved quantity at a given distance from the cloud top for profiles that were above median in that property at the cloud top.
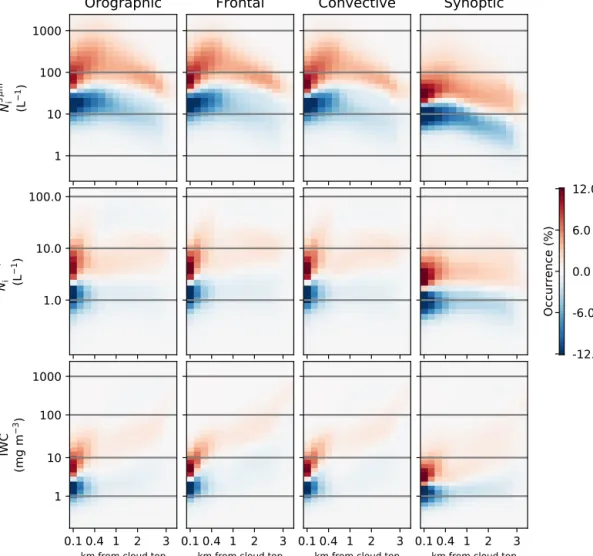
The top row of Fig. 9 shows that Ni5 µminformation propa-gates a significant distance through the cloud. Clouds with an increased Ni(top)5 µm maintain a higher Ni5 µmat distances at least 3km from the cloud top in all regimes. However, as shown in the second row, vertical information about the Ni100 µm does not propagate nearly as far through the cloud. The vertical propagation is the highest in the synoptic regime. The ver-tical propagation of IWC information is very similar to the Ni100 µm, with the relationship to the cloud top IWC being significantly reduced more than 500 m from the cloud top.
The large vertical propagation of the Ni5 µmindicates that the changes in Ni5 µmat the cloud top found in the previous section can have considerable impacts at lower levels in the cloud. However, the lower vertical propagation of the infor-mation about the larger crystals (Ni100 µm, IWC) would sup-port the suggestion that the growth of the ice crystals after nucleation is primarily controlled by meteorological factors that do not play a large role in the nucleation processes that control Ni100 µm. Note that the temperature of the cloud top and the distance from the cloud top can still play a large role in determining the Ni(Figs. 4 and 5).
6 Discussion
These results show that the Ni(top)5 µm is strongly affected by sev-eral factors including temperature (Fig. 1), cloud type (Fig. 2) and updraft (Fig. 3), and that changes in the Ni(top)5 µm can be maintained at large distances from the cloud top (Fig. 9). The dependence of the Ni(top)5 µm on the in-cloud updraft and the relationship to reanalysis liquid aerosol (Fig. 6) at tempera-tures between −35 and −60◦C is consistent with the impact of homogeneous nucleation processes on the Ni(top)5 µm. This is supported by the relationship of the Ni(top)5 µm to the INP proxy (Fig. 8), where a reduction in Ni(top)5 µm with increasing INP could be indicative of an INP suppression of homogeneous
nucleation (Kärcher and Lohmann, 2003). The relationship with INP is also consistent with heterogeneous nucleation having a strong role to play in determining the Ni(top)5 µm in syn-optic cirrus clouds at temperatures colder than −60◦C.
Uncertainties in the retrieval have been covered in Part 1 of this work (Sourdeval et al., 2018a). However, there are a few points to note with regards to the relationship of the Ni
to other cloud and meteorological properties. Although there is significant uncertainty in the Ni retrieval, many of these
uncertainties are random errors and not systematic functions of the meteorological properties investigated here. Even ice crystal shape, which can be a major issue in ice cloud re-trievals, is a function of temperature (to first order) and so does not impact the majority of the results which are pre-sented in this work stratified by temperature. The geographi-cal variations in Fig. 1b show a similar pattern to those from Mitchell et al. (2016, 2018), with high Ni(top) observed in
mountainous regions and a reduced Ni(top)in the tropics. The
similarity of the results from these two different retrieval products, each with a different physical basis supports the conclusions drawn from these datasets regarding the global distribution of Ni. There is also little evidence to suggest that
there are large biases caused by the retrieval only being able to use one instrument (radar or lidar). Cases where only the lidar detects a cloud are often characterized by monomodal ice distributions, which are well represented by the Delanoë et al. (2005) parameterization. As such, these cases are re-trieved with similar accuracy to the full radar–lidar retrieval (Sourdeval et al., 2018a).
The cloud phase classification is of critical importance to the warmer clouds included in this study and there is evi-dence of the misclassification of a small number of cases at temperatures warmer than −35◦C (Fig. 8). This can make it difficult to interpret results at these temperatures, so they are not a focus of this work. The change in phase of these clouds as a function of aerosol is likely to dominate the radiative response of clouds to aerosols at these temperatures.
There are a number of limitations of this study that could be addressed in future work. The lack of information about the location of INP is a serious issue when investigating the impact of aerosol on Ni. While the INP proxy in this work
is able to provide a qualitative estimate of the role of INP in determining the Ni, for a quantitative estimate a better proxy
or measure of the global INP concentration is required. Additionally, the impact of meteorological covariations makes it difficult to assign causality to the aerosol–Ni(top)
relationships observed in Fig. 6. The lack of a complete pic-ture of the atmosphere makes it difficult to directly con-trol for meteorological variability. The causal link between aerosol and Ni(top) is thought to be strong (e.g. Kärcher and
Lohmann, 2002), but the lack of observations of in-cloud updrafts also limits how accurately the impact of aerosol on the Ni can be determined. Although the cloud regimes
i 1 10 100 1000 N 5 m i (L 1) Orographic 1.0 10.0 100.0 N 1 0 0 m i (L 1) 0.1 0.4 1 2 3
km from cloud top
1 10 100 1000 IWC (m g m 3) Frontal 0.1 0.4 1 2 3
km from cloud top
Convective
0.1 0.4 1 2 3
km from cloud top
Synoptic
0.1 0.4 1 2 3
km from cloud top
-12.0 -6.0 0.0 6.0 12.0 Occurrence (%)
Figure 9. As in Fig. 5, but showing the difference in the retrieved properties depending on the cloud top properties. Red over blue indicates that clouds with above median properties at the cloud top (Ni(top)5 µm, IWC(top)) have higher values of the retrieved properties at a specified
depth from the cloud top. Note the nonlinear scale on the horizontal axis.
(Gryspeerdt et al., 2018a), the updraft is a critical compo-nent in determining the Ni through its influence on the
su-persaturation. The in-cloud updraft is assumed to be largely independent of the aerosol properties in this work, but it is possible that the reanalysis aerosol is related to the in-cloud updraft, such that more aerosol is vertically transported in conditions with high in-cloud updrafts. In this case, a posi-tive correlation between the Niand MACC reanalysis aerosol
could be generated. However, as MACC does not explicitly simulate in-cloud updrafts, the impact of this confounding issue is likely to be small.
It is also possible that using cloud glaciation as a proxy allows other meteorological covariations, which could gen-erate apparent relationships between the INP and Ni.
How-ever, the in-cloud updraft is of a second-order importance in determining the cloud top phase compared to the INP con-centration (Bühl et al., 2013). The inclusion of a glide-slope test when determining the INP proxy means that it is also
unlikely that clouds are being glaciated by undetected ice falling from higher cloud layers. The separation into cloud regimes also limits the impact of these kind of meteorologi-cal covariations, which might be expected between different regimes, but would be weaker within them.
The behavior of the Ni retrieval in this work follows the
expected behavior of the Ni determined in several previous
studies based on satellite remote sensing, in situ, theoreti-cal and modeling results. This provides further evidence that the DARDAR-Nice Niretrieval described in Sourdeval et al.
(2018a) is able to retrieve the Niin a variety of situations.
7 Conclusions
Few global studies exist of the controls on the ice crystal number concentration (Ni), especially regarding the role of