HAL Id: hal-03003210
https://hal.sorbonne-universite.fr/hal-03003210
Submitted on 13 Nov 2020
HAL is a multi-disciplinary open access
archive for the deposit and dissemination of sci-entific research documents, whether they are pub-lished or not. The documents may come from teaching and research institutions in France or abroad, or from public or private research centers.
L’archive ouverte pluridisciplinaire HAL, est destinée au dépôt et à la diffusion de documents scientifiques de niveau recherche, publiés ou non, émanant des établissements d’enseignement et de recherche français ou étrangers, des laboratoires publics ou privés.
Intracellular Fate of Hydrophobic Nanocrystal
Self-Assemblies in Tumor Cells
Alba Nicolas-boluda, Zhijie Yang, Illia Dobryden, Florent Carn, Naomi
Winckelmans, Christine Péchoux, Pierre Bonville, Sara Bals, Per Claesson,
Florence Gazeau, et al.
To cite this version:
Alba Nicolas-boluda, Zhijie Yang, Illia Dobryden, Florent Carn, Naomi Winckelmans, et al.. In-tracellular Fate of Hydrophobic Nanocrystal Self-Assemblies in Tumor Cells. Advanced Functional Materials, Wiley, 2020, 30 (40), pp.2004274. �10.1002/adfm.202004274�. �hal-03003210�
Intracellular Fate of Hydrophobic Nanocrystal Self-Assemblies in Tumor Cells
Alba Nicolas-Boluda, Zhijie Yang, Illia Dobryden, Florent Carn, Naomi Winckelmans, Christine Péchoux, Pierre Bonville, Sara Bals, Per Martin Claesson, Florence Gazeau,* and Marie Paule Pileni*
Dr. A. Nicolas-Boluda, Dr. F. Carn, Dr. F. Gazeau Université de Paris,Laboratoire MSC, CNRS UMR 7057, Paris 75013, France, E-mail: florence.gazeau@u-paris.fr, Prof. Z. Yang Key Laboratory of Colloid and Interface Chemistry of MOE School of Chemistry and Chemical Engineering Shandong University China, Dr. I. Dobryden, Prof. P. M. Claesson Department of Chemistry Division of Surface and Corrosion Science KTH Royal Institute of Technology School of Engineering Sciences in Chemistry Biotechnology and Health Drottning Kristinas väg 51, Stockholm SE-100 44, Sweden , Dr. N. Winckelmans, Prof. S. Bals Physics EMAT-University of Antwerp Groenenborgerlaan 171, Antwerp B-2020, Belgium, Dr. C. Péchoux Université Paris-Saclay, INRAE, AgroParisTech GABI Jouy-en-Josas 78350, France, Dr. P. Bonville, SPEC-CEA CNRS, Université Paris Saclay Cedex, Gif-sur-Yvette 91191, France, Prof. P. M. Claesson RISE Research Institutes of Sweden Division of Bioscience and Materials Box 5607, Stockholm SE 114 86, Sweden Prof. M. P. Pileni Chemistry Department Sorbonne Université 4 Place Jussieu, Paris 75005, France, E-mail: mppileni@orange.fr
The ORCID identification number(s) for the author(s) of this article can be found under https://doi.org/10.1002/adfm.202004274.
Control of interactions between nanomaterials and cells remains a biomedical challenge. We propose a strategy to modulate the intralysosomal distribution of nanoparticles through the design of 3D suprastructures built by hydrophilic nanocrystals (NCs) coated with alkyl chains. We compare the intracellular fate of two water-dispersible architectures of self-assembled hydrophobic magnetic NCs: hollow deformable shells (colloidosomes) or solid fcc particles (supraballs). These two self-assemblies display increased cellular uptake by tumor cells compared to dispersions of the water-soluble NC building blocks. Moreover, the self-assembly structures increase the NCs density in lysosomes and close to the lysosome membrane. Importantly, the structural organization of NCs in colloidosomes and supraballs are maintained in lysosomes up to 8 days after internalization, whereas initially dispersed hydrophilic NCs are randomly aggregated. Supraballs and colloidosomes are differently sensed by cells due to their different architectures and mechanical properties. Flexible and soft colloidosomes deform and spread along the biological membranes. In contrast, the more rigid supraballs remain spherical. By subjecting the internalized suprastructures to a magnetic field they both align and form long chains. Overall, we highlight that mechanical and topological properties of the self-assemblies direct their intracellular fate allowing the control intralysosomal density, ordering and localization of NCs.
1. Introduction
In the last decades, nanomaterials have been designed for a range of biomedical applications, including diagnostics, gene and drug delivery, therapeutic applications for treatment of cancer and infectious diseases, regenerative medicine and others. However, the majority of the administered nanomaterials are sequestered and with time accumulated in organs such as the liver, which reduces their efficiency at their intended tissular, cellular or intracellular targets. Thus, one of the challenges of nanomedicine remains the tight control of
nanomaterial interactions with the encountered biological environments.[1] For this reason a considerable effort
has been made to understand how the size, shape, and material properties of nanocarriers, and the interplay among these, affect cellular uptake.[2-4]
The first stages of nanomaterial interactions with the plasma membrane are becoming better understood and reveals important analogies with biological nanocarriers such as viruses. [5-6] However, the fate of nanoparticles
once inside the cell is poorly controlled and understood. [7-8] This is unfortunate since the intracellular
localization of nanoparticles will directly shape their biological effects. Most nanoparticles are internalized by endocytosis and converge to lysosomes. Upon nanoparticles internalization, cells continuously adapt their endosomal traffic and lysosome biogenesis in order to process them. However, the way lysosomes adapt to the presence and sequestration of nanomaterials, and whether such mechanisms depend on nanoparticle characteristics remain elusive. [9-10] Consequently, despite the tremendous variety of nanocarriers that have been
developed, there is still few attempts to fully control or modulate their subcellular intralysosomal distribution and fate.
It must be emphasized that the precise localization, density, aggregation state and organization of nanocrystals within intracellular compartments are of crucial importance for imaging and therapeutic applications. As an example, intracellular localization and clustering of nanoparticles having a high Z number critically affect the mechanisms of radiosensitization due to the local dose distribution, diffusion of secondary species, and the proximity of sensitive biological structures. [11] When internalized into lysosomes, plasmonic nanoparticles
change their initial optical absorption spectra due to uncontrolled clustering, which affects plasmon coupling
with drastic consequences for light to heat conversion, photoacoustic imaging and photothermal therapy. [12]
Magnetic nanoparticles also drastically change their dynamical magnetic response upon lysosomal sequestration due to clustering, uncontrolled dipole-dipole interactions, inhibition of the Brownian relaxation, and, at longer times, nanocrystal degradation. [13-14] Conversely, lysosomal confinement of iron oxide nanoparticles enhances
detection of labeled cells by magnetic resonance imaging. [15] The proximity of nanoheaters to the lysosomal
membrane has also been emphasized as a key requirement for induction of cell death. [16] Generally the
biological outcome of local heating, mechanical stress or magnetic forces generated at the nanoscale by nanoparticles strongly depends on the distance from vital structures or from heat-sensitive membrane channels in order to activate specific molecular pathways. [17-18] Nevertheless, crucial parameters such as the lysosomal
density of nanoparticles, their distance from lysosome membranes as well as lysosome remodeling consecutive to nanoparticle uptake have never been explored in detail as a function of the nanocarrier properties.
It is clear that there is a need to conceive nanocarriers whose intracellular fate can be modulated by their design. Here we propose an approach in which nanocrystals are self-assembled into prescribed architectures with different topology and mechanical properties in order to direct the intracellular distribution. Nanocrystals with low size distribution and coated with alkyl chain, are able to self- assemble in 3D superlattices called supracrystals. [19-20] The length of the coating agents controls the distance between the NCs. Such artificial
properties. [21-23] We recently built water-dispersible hybrid self-assemblies with different architectures, while
featuring sizes of a few hundreds of nm. Hydrophobic NCs are used as building blocks to produce either flexible shell forming closed vesicles (colloidosomes) or spherical solid fcc supracrystals (supraballs) dispersed in aqueous solution. [24] These new hybrids are highly stable over time (more than years). The exploration of their
physical properties, which appear to depend on the application medium, is still in its infancy. [25] We observed
that they can act as nanoheaters in aqueous solution due to the high penetration depth of visible light in the hybrid structures, with the coating agents acting as an internal reservoir for efficient accumulation of energy. [26]
In this study, we investigate for the first time the intimate interactions of soft colloidosomes and solid supraballs with tumor cells and highlight their intracellular fate over a period of one week in cells, and compare it to the internalization of dispersions of isolated nanocrystals. We pay particular attention to the intracellular distribution of nanocrystals and the data reveal that the topological and mechanical properties of the self-assembly structures dramatically influence cellular uptake, lysosomal sensing and lysosomal distribution and organization of their building blocks. Importantly, our findings suggest that the distribution of nanocrystals in lysosomes can be optimized and modulated by the design of the self-assembly structures, opening avenues to control the intracellular fate of nanocrystals and their biological effect.
2. Results and Discussion
We have organized this section as follows: First the structure of the colloidosomes and supraballs are characterized, including their nanomechanical and magnetic properties. Next, we consider the up-take of these structures by tumor cells in com- parison to the up-take of individual NCs. This includes their distribution in the cells as well as the organization of the NCs within the cells. Of particular interest is the interaction between colloidosomes and supraballs with the lysosomes of the tumor cells, and this is reported in the next section. In the last section we consider the magnetic response of colloidosomes and supraballs internalized in the tumor cells. We find large differences between individual NCs and the suprastructures in tumor cells, and also between colloidosomes and supraballs. The latter is related to the different organization, leading to differences in mechanical properties.
2.1. Self-Assembly of Iron Oxide Nanocrystals into Colloidosomes and Supraballs
We synthesized spherical ferrite NCs coated with oleic acid (OA) with 9.6 nm diameter and 8% polydispersity as building blocks for colloidosomes and supraballs. The same NCs were also coated with dopamine to serve as a reference for isolated nonassembled positively charged NCs dispersed in water (Figure S1, Supporting Information). Independent of the coating agents, the structural study of the NCs indicates a ferrite inverted spinel structure with presence of wüstite (Figure S1 and Table S1, Sup- porting Information). Consequently, we conclude that the NCs used in this study are mainly Fe3O4. However, we cannot neglect the presence of γ Fe2O3 and wüstite structure.
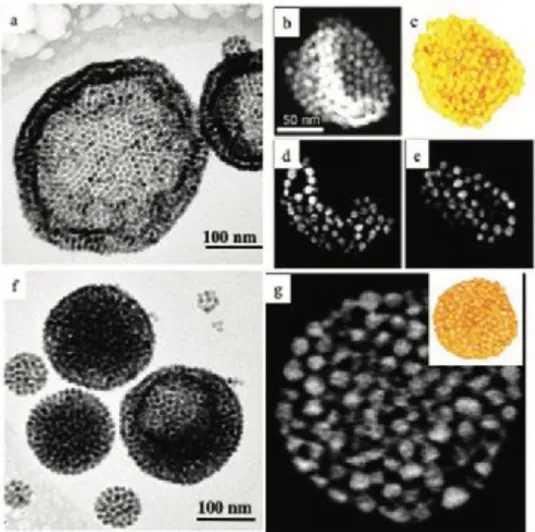
We designed two types of water dispersive self-assemblies of hydrophobic NCs as illustrated in Figure 1. Colloidosome, empty vesicles with a crystalline colloidal shell of NCs, were built via a template confined chemical reaction (Figure 1a-e). Supraballs, homogeneous supracrystals of NCs, were generated via superlattice-matched epitaxial overgrowth (Figure 1f,g). [24] CryoTEM images in water reveal spherical shapes of the
hydrated colloidosomes (Figure 1a) and supraballs (Figure 1f). The shell of the colloidosome is composed of an ordered self-assembly of NCs in one to three layers. We underline that the colloidosomes were produced in presence of oleic acid (OA), dodecyltrimethylammonium bromide (DTAB) and octadecene (ODE). As previously shown ,[24] the supraballs are fcc supracrystals of NCs coated with OA where the external layer of the
OA molecules are associated with DTAB.
The size distributions of the self-assembly structures and their building blocks were obtained from TEM images of dried samples and cryoTEM images on hydrated samples (Figure S2). We found an average diameter of 10.1±1.3 nm for dopamine-coated NCs in water, 187±93 nm for colloidosomes and 91±44 nm for fcc supraballs in their hydrated form. Note that the different size distribution of the supraballs and colloidosomes are imposed by the process of self-assembly and could not be varied by synthesis parameters in this study. A 3D reconstruction obtained by electron tomography on a dried sample shows deformation and collapse of the colloidosome spherical structure (Figure 1b-e) while supraballs retain their shape (Figure 1f-g). Thus, the colloidosomes appear more deformable than the supraballs.
The zeta potential of dispersed NCs coated with dopamine and that of colloidosomes and supraballs dispersed in deion- ized water are +48, +43, and +46 mV, respectively. The similarity between these various values clearly indicates that the zeta potential has a negligible influence on the data presented below.
!
Figure 1. Self-assemblies of ferrite nanocrystals: Colloidosomes: a) CryoTEM image in water. b) 2D HAADF–STEM projection image of dried sample. c) 3D visualization of an electron tomogram. d,e) Orthoslices through the 3D. Supraballs: f) Cryo-TEM image in water. g) 2D HAADF–STEM orthoslice through the 3D tomogram shown in the inset.
2.2. Nanomechanics of Colloidosomes and Supraballs
Nanomechanical properties were extracted by analysis of force versus distance curves obtained using scanning probe microscopy (SPM), as explained in numerous articles, e.g., in ref. [50]. Here we determined the nanomechanical properties
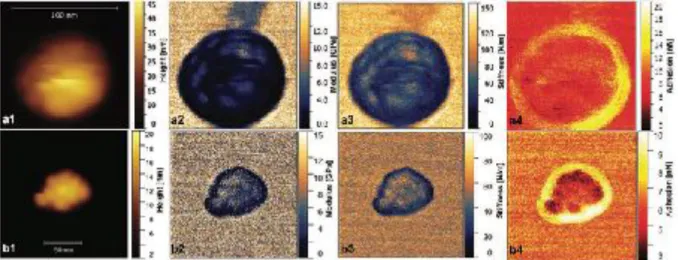
of single colloidosome and supraball self-assembly structures dried on a mica substrate in air (Figure 2). The sample stiff- ness and tip-sample adhesion were directly extracted from the force curve as the slope of the repulsive force at short separations and the force minimum, respectively. In contrast, the apparent elastic modulus is model depended and it was here obtained by fitting the Derjaguin, Muller, and Toporov (DMT) model to the measured force curves on approach. The ultrastructure of the colloidosome is slightly blurred, which signifies a slight lateral motion of the NCs caused by inter- actions with the probing cantilever tip, see Figure 2a1. The supraball ultrastructure image, Figure 2b1, has a sharper contrast, and all individual NCs are clearly visible. This can be attributed to less lateral motion due to the denser NC packing. The adhesion force maps in Figure 2a4,b4 show higher adhesion in the edge region of the colloidosomes and supraballs. This is due to larger contact area of the organic coating with the tip at the edges. In contrary to the stiffness maps (Figure
2a3,b3), which provide a model free mechanical property, the apparent elastic modulus maps, shown in Figure 2a2,b2, provide a somewhat model-dependent but more common measure of the mechanical response. The variation in elastic modulus along the ultrastructures shows a higher modulus on top of the NCs and lower in between the NCs. This variation is clearer for the supraball than for the colloidosome due to a lower mobility of the NCs during their interaction with the probing AFM tip. The evaluated average elastic modulus and stiffness parameters are shown in Table S2 in the Supporting Information. The average adhesion force is about 5.4 nN ± 0.5 nN for supraball and is about 4.4 nN ± 0.9 nN for colloidosome, as measured in the central region.
!
Figure 2. a1–a4) Scanning probe microscopy of one single colloidosome and b1–b4) supraball. a1,b1) Topography, a2,b2) elastic modulus, a3,b3) stiff- ness, and a4,b3) adhesion using QI mode with SPM.
The comparison of the nanomechanical properties of colloidosomes and supraballs demonstrates that the dried fcc supra- balls have an elastic modulus that on average is about 55% larger than the colloidosomes. Similarly, the evaluated stiffness is about 26% higher for supraballs than for colloidosomes. For both supraballs and colloidosomes the modulus value and stiffness are lower at the edge of the structures due to the pres- ence of the organic shell (Table S2, Supporting Information).
Evidence for a higher local flexibility for colloidosomes than for fcc supraballs is obtained from the evaluated average deformation measured over a single ultrastructure at the maximum imaging force. The deformation is 2.2 nm for 25 nN applied force for colloidosomes, and 1.1 nm for 27 nN applied force for fcc supraballs. Thus, the SPM analysis demonstrates a higher flexibility and lower stiffness of colloidosome structures in comparison to more rigid supraballs. We will later show how the different mechanical properties affect the distribution within tumor cells.
22.3 Magnetic properties of dispersed NCs, colloidosomes and supraballs
Magnetic measurements (zero-field-cooled versus field cooled (ZFC/FC) temperature dependent magnetization measurements) performed on dispersed NCs, colloidosomes and supraballs in aqueous suspension indicate blocking temperatures of 75K, 101K and 129K, respectively (Figure S3). As already observed,[21] when magnetic
temperature as observed with colloidosomes and supraballs.Nevertheless, since the blocking temperature of supraballs and colloidosomes are of 129K and 101K, they are still superparamagnetic at room temperature either in solid or liquid state. The progressive increase of the blocking temperature from dispersed NCs, colloidosomes to supraballs is the signature of enhancement of dipolar interactions between NCs.
2.4. Colloidosomes and Supraballs Uptake into Tumor Cells
We investigated the interactions of dispersed NCs, colloidosomes, and supraballs with A431 epidermoid carcinoma cells. The cells were exposed to the nanomaterials in serum- complemented culture medium for 30 min to 24 h. No sign of NCs aggregation in culture medium was observed. None of the nanocarriers presented cytotoxicity at concentration [Fe] from 11 to 112 μg mL−1 as assessed by metabolic activity measurements that were similar to the control nonexposed cells (Figure S4, Supporting Information). Consistently, the necrosis level did not exceed 7% in all conditions.
The transfer of magnetic properties to the tumor cells incu- bated with dispersed NCs, colloidosomes, and supraballs was investigated. After 24 h incubation, the cells were rinsed, har- vested from culture flasks, and then suspended. They were exposed to a calibrated and uniform gradient magnetic field in order to measure their magnetophoretic mobility. The velocity of single cells toward the magnet directly quantify each cell magnetization, reflecting the balance between the magnetic force (proportional to cell magnetic moment) and the viscous force (proportional to cell radius and cell velocity) in the constant velocity regime (Figure S5, Supporting Information). Histograms of cell velocity represented in Figure S5b in the Supporting Information show markedly enhanced magnetic mobility when the cells were exposed to colloidosomes and supraballs as compared to NCs in their dispersed form (Table S3, Supporting Information). To evaluate the iron mass per cell from the measured magnetophoretic mobility, we assumed identical saturation magnetization for dispersed NCs and such NCs in the self-assembly structures. The data show that the iron uptake per cell was a factor of 2 larger for colloidosomes and supraballs compared to dispersed NCs. Hence self-assembled NCs have a better ability to be internalized by tumor cells in comparison to the dispersed NCs at equivalent iron dose.
2.5. Internal Distribution of Colloidosomes and Supraballs in Tumor Cells
2.5.1. Nanocrystal Dispersions
In order to elucidate the intracellular distribution and fate of NCs in tumor cells, we followed the particle’s uptake by TEM at different points of time for up to one week after exposure to the nanostructures. Dopamine-coated isolated NCs early interact as loose clusters with the cell plasma membrane (30 min incubation) and are promptly internalized into membrane-closed endosomes in which their relatively dispersed state is preserved (Figure 3). After 2 days, the NCs become more concentrated in lysosomes and are seen as aggregates surrounded by an electron dense lysosomal matrix, which suggests the implication of endogeneous lysosomal proteins in the process of nanoparticle transformation. The diameters of the intracellular NCs were significantly reduced at day
5 and day 8 in comparison to the first two days, while the spherical shape was conserved (Figure S6). This suggests a gradual dissolution of the NCs, as observed in previous studies for iron oxide nanoparticles with different shapes and coatings that underwent degradation in lysosomes and Fe recycling into ferritin proteins.
[27-29]
!
Figure 3. 2D TEM slices images of A431 cells incubated with Fe O NCs ([Fe] = 28 μg L−1) for different points of times (30 min, 4 h, 1 day, and at 8 days postinternalization after 1 day incubation.
!
Figure 4. 2D TEM slices images of colloidosomes at different points of time (1, 2, and 8 days) in A431 tumor cells incubated for 1 day with 28 μg L−1 iron concentration.
2.5.2. Colloidosomes
In contrast to isolated NCs, colloidosomes show very distinct intracellular distribution. The most striking difference is that the NC shells of colloidosomes are closely located to the cell mem- branes, adapting to the shape of intracellular vesicles (Figure 4). This is clearly facilitated by their flexible structure. Colloidosome internalization is slightly delayed compared to that of the smaller isolated NCs and was barely observed at 30 min and 4 h incubation (Figure S7, Supporting Information). After 24 h incubation, most of colloidosomes are entirely encapsulated within intracellular membranes in the cell cytoplasm and some of them show an empty lumen, indicating that they have been internalized without losing their core–shell structure. However, in com- parison to the size of colloidosomes in water suspension, the colloidosomes size increased in cells from early time points, suggesting cell-induced deformation, rearrangement, and/or fusion of the self-assemblies (Figure S6, Supporting Information).
In the 2D TEM slices shown in Figure 4, some curved fragments of colloidosomes embedded into intracellular membranes without conspicuous lumen can also be found. This shows that colloidosomes can be flattened and shaped by cells to form anisotropic inclusions of several (most often organized) layers of NCs closely interacting with the intracellular membranes. This flattening increases over time as colloidosomes or fragments seem to condense into autophagosomes and lysosomes. This important reorganization of the NC assemblies upon contact with cell membrane suggests competing interactions between adjacent NCs coated with oleic acid within the colloidosome shell and between NCs and the hydrophobic parts of the cell membrane.
It is likely that interparticle interactions remain stronger than those of NCs with the biolipids, as NCs tend to assemble again through an interdigitation process of oleic acid molecules inside. After 8 days, organized layered structures of NCs reminiscent of the colloidosome shell structure were clearly seen, demonstrating the enduring self-organization of supracrystals within intracellular compartments. Similar to isolated NCs, we noticed an electron dense protein matrix and ferritin close to ferrite NCs suggesting that the lysosomal degradation process might be ongoing although the individual NCs still look intact.
2.5.3. Supraballs
Supraballs collectively interact with the plasma membrane at short times (Figure S8, Supporting Information), mostly con- serving their spherical structure after entering intracellular compartments (Figure 5). Endosomes are found to frequently contain intact supraballs in their lumen. These compartments fuse with lysosomes over time, showing, at 8 days, an electron dense matrix surrounding well preserved self-organized NCs within supraballs. Similar to colloidosomes, but to a lesser extent, the apparent size of supraballs was found to be larger in cells compared to that in water suspension, suggesting fusion and reorganization. However, after entering the cell, the apparent size did not significantly demonstrating that the reorganization mostly occurred at early times (Figure S6, Sup- porting Information). Importantly, we continuously observe compact structures and spherical shapes of supraballs when they transit in the different intracellular compartments up to lysosomes. This is different compared to the colloidosomes that underwent significant shape deformations upon cell internalization. Clearly, this different fate in cells is due to differences in flexibility, stiffness, and internal mobility of NCs as observed by SPM.
Figure 5. 2D TEM slices images of supraballs at different points of time (4 h, 1, and 8 days) in A431 tumor cells incubated for 1 day with 28 μg L−1 iron concentration.
It is interesting to notice that whether NCs have been self- organized into colloidosome or supraball structures before cell internalization, they conserve a locally ordered organization within the cell compartment for up to 8 days, the final point of time of our experiment.
2.6. Structural Organization of NCs in Tumor Cells
In order to investigate the average structural organization and integrity of NCs in cells with a high-statistics, we carried out small angle X-ray scattering (SAXS) experiments at different time-points from 30 min to 48 h during cell processing of isolated NCs, colloidosomes and supraballs (Figure S9, Supporting Information). To isolate the contribution of NCs to the scattering intensity, the scattered intensity of nonlabeled cells was subtracted from each signal profile.
The signature of NCs is detectable already after 30 min of incubation, and the signal/noise ratio improves with time. This shows that the cellular uptake is progressive and starts from the very beginning of the incubation period. In all spectra, the SAXS pattern at high q fit the form factor P(q) of spheres with radius around 5 nm in line with the cryoTEM size and spherical shape of individual NCs (Figure S1, Supporting Information). The structure factor S(q) can thus be obtained by dividing the scattered intensity by the form factor P(q) of individual NCs.
The structure factor at low q provides information on the local organization of NCs. For cells incubated with isolated NPs (Figure S9a,b, Supporting Information), the structure factor at low q is characterized by a power law decay with an exponent of −1.7, which extends to lower q values when the time of incubation is increased. This indicates the cell-induced formation of NC aggregates with an open structure and increasing aggregation number. This intracellular fractal aggregation of NCs, similar to diffusion limited aggregation, is fully consistent with the TEM observations reported above and with previous small angle neutron scattering results on endosomal clustering of iron oxide nanoparticles. In contrast, for cells incubated with colloidosomes and supraballs, the structure factor is characterized by a power law decrease of the scattered intensity, with exponent of −2.3 and −2.9 for colloidosomes (Figure S9 c,d, Supporting Information) and supraballs (Figure S9e,f, Supporting Information), respectively. This demonstrates a dense packing of NCs, further accentuated with supraballs. Unfortunately, the Guinier regime cannot be reached in the available q range which prevents determination of the overall size of the colloidosomes and the supra- balls based on these measurements. Importantly, these SAXS profiles did not change over 48 h, confirming that the preassembly of NCs into colloidosomes or supraballs enables maintaining of their ordered organization after cell internalization. Taken together, the SAXS and TEM structural analysis reveal drastic differences in cellular internalization of isolated NCs in comparison to their self-assemblies as deformable colloidosomes or as rigid supraballs. Isolated NCs are internalized in the form of loose fractal aggregates with rather low fractal dimension (1.7). In contrast, the local organization and interparticle distance of preassembled NCs into colloidosomes and supraballs persist in cell
organelles up to one week postlabeling. This might be explained by the hydrophobic coating agents of the NCs that maintain the attractive interactions between NCs in the hydro- philic medium. However, the crystalline order can only be partially retained due to reorganization and amorphous assemblies.
!
Figure 6. a) Illustrative example of image analysis by manually delimiting the lysosomal membrane (pink line) and thresholding the area covered by NCs (in white), hence analyzing the NC inside the lysosomes at day 1 and day 8 after internalization. b) Area of the lysosomes containing NCs. c) Circularity of lysosomes containing NCs. d) Area covered by NCs within the lysosome. e) Percentage of area covered by NCs in the lysosome sur- face. One-way ANOVA Kruskal–Wallis test, Dunn’s multiple comparison: ***p < 0.0001, **p < 0.001, *p < 0.05
(It is a nonparametric method used for comparing two groups, for testing whether samples originate from the same distribution.)
We note that the small distance between NCs in internalized colloidosomes and supraballs facilitates collective properties due to magnetic dipolar interactions. The fact that the NC organization can endure biological processing by tumor cells is of upmost importance when considering that magnetic and optical properties of NCs drastically depend on their local organization. For example, dipole-dipole interparticle interactions, magnetic ordering and local arrangement of nanoparticles[31-33] strongly affect the magnetic to heat conversion of magnetic
NCs under alternating magnetic field. We and others have demonstrated that cell internalization can change the magnetic response and jeopardize the heating efficiency of different magnetic structures through uncontrolled magnetic interactions elicited by endosomal nanoparticle confinement and fractal clustering. [14, 34] Similar to
dispersed nanoparticles, liposome encapsulating nanoparticles in their aqueous phase or in polymersomes invariably disintegrate in the intracellular compartments. This leads to uncontrolled nanoparticle fractal aggregation, hampering any sustained and predictable magnetic responsivity in the cellular environment. Here, we demonstrated that self-organization of NCs into either colloidosomes or supraballs outperform current nanosystems in prescribing the intracellular organization of NCs for at least one week. Note the data obtained around q=0.15 Å-1 are particularly noisy consequently it is impossible to observed the expected [111] peak of the
2.7. Interactions with Lysosomes
Isolated NCs, colloidosomes, and supraballs show very distinct organizational evolution in tumor cells, suggesting that they are not sensed and processed in the same way by endo/lysosomal compartments. As a consequence, we hypothesize that we could leverage their different structural and mechanical characteristics in order to modulate the intralysosomal distribution of NCs in tumor cells. Based on TEM image analysis (Figures 6,7a), we have defined objective descriptors in order to characterize i) the lysosome response to NCs (lysosome size and circularity), and ii) the intralysosomal distribution of NCs (NC density and proximity to the lysosomal membrane). Elec- tron dense NCs were identified as areas that are darker than biological structures and that can be detected by image analysis and thresholding (Figure 6a). We focused on lysosomes that contained NCs by contouring lysosomal membranes at day 1 or day 8 postlabeling (Figure 6a). To evaluate whether lysosomes can adapt to the presence and organization of NCs, we com- pared the apparent lysosome area at each condition and how it changed with time (Figure 6b).
2.7.1. Lysosome Size
Surprisingly, at day 1, the lysosomes that contained colloidosomes were more than twofold larger than those containing initially dispersed NCs (mean area of 4.1 μm2 vs 1.8 μm2) and tenfold larger than lysosomes encapsulating supraballs (4.1 μm2 vs 0.4 μm2). This suggests that the lysosomal compartment not only adapts to the carrier size, but also to its ability to deform and to interact with the cell membrane dynamics. Deformable colloidosomes were internalized in much larger endosomes/lysosomes than the more rigid and less deformable supraballs. Supraballs were internalized in smaller compartments than isolated NCs. These differences arise from the early mechanisms of intracellular sequestration (day 1) as they tend to reduce at longer times. In particular, lysosomes containing colloidosomes drastically shrank in size between day 1 and day 8, whereas lysosomes containing isolated NCs or supraballs did not change their size significantly during the same period of time.
2.7.2. Lysosome Shape
To further elucidate the lysosome sensing and adaptation to our nanostructures, we examined the shape of the lysosome membrane and calculated its circularity index (Figure 6c; Figure S10, Supporting Information). Interestingly, lysosomes loaded with supraballs were the most circular and their cir- cularity, like their size (Figure 6b), did not change from day 1 to day 8 (circularity of 0.77 and 0.78, respectively) (Figure 6c; Figure S10, Supporting Information). This suggests that the rigid supraballs induce sustained membrane tension in the lysosomes
.
Figure 7. Proximity of NCs to the lysosomal membrane: a) A region of interest within 100 nm from the lysosomal membrane is defined followed by quantification of NCs in this region. b) Percentage of area occupied by NCs within 100 nm of the lysosome membrane at 1 day and 8 days postinter- nalization. c) Percentage of the total number of NCs in the lysosomes located within 100 nm from the lysosome membrane. One-way ANOVA Krustal– Wallis test. Dunn’s multiple comparison ***p < 0.0001, **p < 0.001, *p < 0.05.
In contrast, colloidosomes were sequestered into lysosomes with much lower circularity (circularity of 0.64 at day 1), further decreasing at day 8 (0.53), and showing membrane bending undulations, analogous to flickering vesicles (Figure 6c, Figure S10). [35] The large excess of membrane in colloidosome-loaded lysosomes accounts
for the colloidosome flexibility, suggesting a reciprocal adaptation of host membranes to the colloidosome mechanical properties. [36] The coupling of membrane fluctuations to the colloidosome shell, giving rise to the
so-called Helfrich entropic repulsion, [37-38] might favor colloidosome flattening and their concentration into the
smaller, still more undulated, lysosomes observed at day 8. Lysosomes encapsulating dispersed NCs, that could be considered as the least perturbed system, shows circularity of 0.75 at day 1 and it decreased to 0.59 at day 8. In conclusion, the host compartments clearly adapt to their cargo, with striking differences between rigid and deformable structures or isolated NCs. The high flexibility of colloidosomes favor their elastic deformation by cells, extended wrapping and close interactions with cellular membrane with reciprocal adaptation and distortion of the colloidosomes and of the host vesicle at short times which normalize at longer times. [36] It might be
compared to cellular uptake and clearance of flexible erythrocytes, cell membrane fragments or extracellular vesicles. [39] In contrast, the rigid and poorly deformable supraballs suffer few deformations over more than one
week post-internalization. Supraballs can be compared with viruses that adapt their mechanical properties to favor their entry into host cells and infectivity. [40] Overall, we observed dynamical changes in size, morphology
and membrane undulations of intracellular host compartments that reflect the mutual adaptation of intracellular membranes to the mechanical properties of self-assemblies.
Lysosomal adaptation has important consequences for the density and spatial distribution of NCs in these compartments. First, we evaluated the area covered by NCs within the lysosome (Figure 6d), which reflects the amount of NCs in each lysosome. The area covered by NCs was found more than 20-fold higher and far more distributed for colloidosomes (mean of 2.4 μm2) in comparison to isolated NC (0.12 μm2) and supra- balls (0.2 μm2) at day 1. The area covered by NCs in lysosomes evolved over time in a different way for isolated NCs and colloidosomes, mitigating at day 8 the initial differences found at day 1. At day 8, the NC area was increased to 0.33 μm2 for isolated NC, reflecting accumulation of NC clusters in lysosomes. In contrast, the NC area dropped
to 0.3 μm2 for colloidosomes and was not significantly changed for supraballs. These evolutions parallel the
change in size of the endolysosomal compartments reported above. Colloidosomes are collectively engulfed at day 1 in very large and highly deformed compartments that became much smaller at day 8, suggesting intense reshaping and active membrane dynamics. On the other hand, supraballs- containing lysosomes were much more stable over one week.
Considering the concomitant evolution of the lysosome size and NC load, we examined a local parameter featuring the surface density of NCs in lysosomes (ratio of surface occupied by NCs over lysosome area) (Figure 6e). A first observation was that the use of supraballs maximize the local density of NCs, representing 52% of the lysosome area in average at day 1 and 32% at day 8. Hence a compelling conclusion is that supraballs are particularly efficient to concentrate a large density of NCs within small sized lysosomes which do not change significantly in size and NC content over time. Remarkably, colloidosomes also optimize the local density of NCs: it counts for 34% of the lysosome surface at day 1 and 48% at day 8. In comparison, isolated NCs only fill 4% of the lysosome surface area at day 1, increasing to 11% at day 8. The increase in the NCs local density over time is due to the concurrent reduction of the size of host compartments which highlights lysosome accumulation and maturation in a way that depends on lysosomal cargo. Overall, the local density of NCs increased from 5 to 12-fold by using colloidosomes or supraballs instead of isolated NCs. This is of crucial importance for controlling the physical response and biological outcome of intralysosomal NCs. For example, cooperative magnetic properties that arise from supracrystalline organization of NCs, or ultrafast light to heat conversion demonstrated earlier with the same assemblies, [26] could be easily transferred to cellular lysosomes, eliciting
enhanced local effects. We anticipate that the optimized density of NCs in the restricted area of lysosomes could amplify hot spot toxicity (local heating), mechanical stress, or radiosensitization for radiation therapy, although these effects were not investigated here.
2.7.4 Proximity of NCs to the lysosome membrane
The lysosomal membrane is recognized as a key target to induce cell death. [41] Indeed, lysosomal membrane
permeabilization or breakdown causes the release of cathepsins and other hydrolases to the cytosol, which results in indiscriminate degradation of vital proteins. Lysosomal destabilization can be induced by the production of
reactive oxygen species (ROS) through iron-catalyzed Fenton reactions, [42] and it has been reported as a
cytotoxic effect of local hyperthermia generated by magnetic nanoparticles. [43] Importantly, as ROS have a
spatially limited range of activity, the localization of ROS mediators such as iron oxide nanoparticles with respect to the lysosomal membrane is of utmost importance. Therefore, we quantified the amount of NCs that were localized at an arbitrary distance of 100 nm from the lysosome membrane (Figure 7a) in order to assess whether the proximity of NCs to lysosome membrane can be modulated by the use of colloidosomes and supraballs.
At day 1, the surface density of NCs in the vicinity of the membrane (percentage of area occupied by NCs within 100 nm of the lysosome membrane) reached a mean value of 35% for colloidosomes and 41 % for supraballs being 10-fold and 12-fold larger than for isolated NCs (3.3%) (Figure 7b). This confirms membrane wrapping of the self-assemblies at the early stage of internalization. After 8 days, the density of NCs close to the membrane was 48% for colloidosomes, but decreased to 25% for supraballs, in comparison to 8% for isolated NCs. This again reflects the durable interactions of colloidosomes with the lysosomal membrane, while lysosome maturation tends to push aside the supraballs from the cell membrane.
Another relevant quantity is the fraction of the total NCs in the lysosomes that lies close to the membrane (Figure 7c). Both colloidosomes and supraballs maximize this fraction after 8 days with 63% and 51% of the total number of NCs being located within 100 nm from the lysosome membrane. In contrast, isolated NPs distribute randomly as fractal clusters within the lysosome with a fraction close to the membrane of about 30%. We conclude that colloidosomes and supraballs are valuable nanostructures to optimize the density of NCs close to the lysosomal membrane, which could enhance any biological effect on these vital cell components.
2.8 Magnetic response of internalized NCs
The response of intracellular NCs to a uniform magnetic field was analyzed in order to assess whether the organization of NCs as colloidosomes or supraballs could favor intracellular magnetic manipulation. After 24 hours incubation with isolated NCs, colloidosomes and supraballs, followed by careful lavage, cells were exposed for 4 hours to a uniform magnetic field of 1T. Optical microscopy shows conspicuous dark rods in cells with length from 1 to 20 µm, all aligned along the direction of the applied magnetic field for cells exposed to colloidosomes and supraballs (Figure S11b,d). In contrast, no anisotropic structures were observed for cells incubated with isolated NCs. The The anisotropic assembly of colloidosomes or supraballs could be rotated by changing the direction of the magnetic field (Figure S11b,d) and the formation of chains could be monitored live (Figure S11a,c) as previously observed for magnetic endosomes, [44] iron oxide nanoparticles-filled carbon
nanotubes[45] or magnetic nanorods. [46-47] TEM observation of cells that were fixed in presence of the magnetic
field show chains of colloidosomes and supraballs aligned along the field direction (Figure 8b, c). Some of them are fully intracellular consisting of lysosome alignments, whereas others are surrounded by a cell membrane and anchored to the cell but partly in the extracellular space (Figure S12). This markedly contrasts with the absence of any alignment of lysosomes containing dispersed NCs (Figure 8a). Formation of such long chains of
colloidosomes or supraballs can be explained by the large magnetic dipolar interactions induced by the self-assemblies of NCs both inside and close to the lysosome membrane. Overall, the field-induced arrangement of supraballs as well as colloidosomes can facilitate magnetic manipulations that are not possible with isolated NCs under our conditions. These observations, together with the sustained organization of NCs within the cells, pave the way for the use of supracrystalline magnetic structures for biological or medical applications based on magnetic stimulation to activate specific molecular pathways or ion channels by magnetic force-torque based methods.
!
Figure 8. 2D TEM slices images of A431 cells upon exposure to a magnetic field of 1 T during 4 h following 24 h incubation with a) dispersed NCs, b) colloidosomes, and c) supraballs.
3. Conclusion
We propose a new concept for modulating intracellular distribution, organization, fate and manipulation of nanocrystals within intracellular organelles. The present study investigated for the first time the interactions of magnetic NCs self-organized into colloidosomes or fcc supraballs with tumor cells, in comparison to their isolated NC components. Colloidosomes were characterized as a flexible shell of ordered NCs, while supraballs
were described as rigid spherical NC assemblies. Remarkably, these supramolecular organizations of NCs were differently sensed by tumor cells, triggering distinct intracellular fates mostly related to their different mechanical properties.
Structural and mechanical analogy of rigid supraballs with viruses could account for their full membrane wrapping and long-lasting integrity within intracellular endosome/lysosome compartments for up to one week. In contrast, colloidosomes were rather seen by cells as “extracellular vesicles” exhibiting a deformable shell that complied with cellular membranes from the early stage of cell entry to the late stage of lysosomal processing. In turn, intracellular compartments strongly adapted to the uptake of colloidosomes by increasing first their size and then their membrane undulations at longer times.
Importantly, these differences in cellular sensing of nano- structures also influenced their fate within lysosomes, making it possible to modulate the density of magnetic NCs in lysosomes and their proximity to the lysosome membrane. Even better than supraballs, colloidosomes could maximize the intralysosomal and close-to-membrane concentration of iron oxide NCs particularly after 8 days of lysosome maturation, transferring magnetic responsiveness to their host lysosomes.
While isolated NCs formed uncontrolled fractal aggregates in lysosomes, the spatial ordering of NCs into their self-assembled colloidosome and supraball structures could be maintained within the cell lysosomes up to at least 8 days. This opens crucial opportunities for an enhanced control of physical properties of NCs in the intracellular environment. Along with a tailored intracellular distribution of NCs, a plethora of physical cooperative properties such as magnetic order or plasmon coupling could thus be translated to cellular components allowing for more precise and tunable biological outcomes.
4. Experimental Section
Chemicals. All chemicals were used as received without any further purification: iron (III) chloride hexahydrate (Sigma-Aldrich, 97%), oleic acid (Sigma-Aldrich, >90%), chloroform (Sigma-Aldrich, ≥99.5%), isopropyl alcohol (Aldrich, ≥99.7%), hexane (Sigma-Aldrich, 95%), toluene (Sigma-Aldrich, 99.8%), Tetraethyl orthosilicate (TEOS, Aldrich, 99.999%), ammonia solution (VWR, 27-30%), anhydrous ethanol (VWR, 99%), ethylene glycol (Sigma-Aldrich, 99.8%), dodecanethiol (Aldrich, ≥98%), 1-octadecene (Aldrich, 90%), octyl ether (Aldrich, 99%), dodecyltrimethylammonium bromide (TCI, >98%).
Synthesis of hydrophobic ferrite nanocrystals (NCs). NCs with narrow size distribution were synthesized by modifying the method reported elsewhere. [48] Iron oleate precursors were prepared as follows: 10.8 g of iron(III)
chloride, 36.5 g of sodium oleate, 40 mL of deionized water, 40 mL of ethanol, and 80 mL of hexane were mixed
into a 500 mL three-neck flask. The mixture was refluxed at 60 oC for 4 h. The red-black colored iron oleate
precursors were dissolved in 100 mL of hexane. The hexane solution was further washed 3 times by warm DI
water (~50 oC) and separated in a separatory funnel. The viscous product was obtained by evaporating the
hexane in a rotary evaporator. A stock precursor solution with a concentration of 0.5 mol/kg was prepared by adding 1.5 g of octadecene to each gram of iron oleate. In a typical synthesis of 9.6 nm NCs, 4.8 g of precursor
solution was mixed with 0.38 g oleic acid and with 6.0 g octadecene. The mixture was heated to 110 oC and
maintained at this temperature for 60 min under N2 protection. Then the solution was heated to the boiling point
of the solution (~308 oC) and was kept at this temperature for 30 min followed by removal of the heater. The
colloidal solution was washed 5 times using isopropyl alcohol/hexane (1:1 v/v) by sedimenting and redispersing using centrifugation. Finally, theNCs were weighted and dispersed in chloroform with desired NC concentration. Water dispersion of isolated NCs. NCs were coated with dopamine to be dispersed in aqueous phase. A ligand exchange process was carried out as follows: 1) dopamine hydrochloride solution was prepared by dissolving 50 mg of dopamine hydrochloride in 0.5 mL of DI water, followed by the addition of 2 mL of tetrahydrofuran; 2) 15 mg of NCs coated with oleic acid was dissolved in 1.5 mL of tetrahydrofuran before the addition of as-prepared dopamine hydrochloride solution. The mixture was maintained at 50 oC for 4 hours before adding acetonitrile to
cause the aggregation of NCs. The precipitate was washed twice with tetrahydrofuran and dispersed in DI water for further use.
Synthesis of colloidosomes. As reported before, [24] 3 mg of NCs were dispersed in a mixed solvent containing
200 μL of chloroform and 8 μL of octadecene added to an aqueous solution containing 18 mg of dodecyltrimethylammonium bromide (DTAB). The resulting emulsion was severely vortexed for 30 s. Subsequently 5 mL of ethylene glycol solution containing 0.4 g polyvinylpyrrolidone (PVP, K30, Mw = 40000) was added swiftly into the emulsion and vortexed for another 30 s. The emulsion was then heated to 70oC under
N2 protection and kept at this temperature for 15 min to evaporate the inner chloroform phase. The suspension
was then allowed to cool to room temperature. The resulting NCs assemblies were washed twice with ethanol and dispersed in deionized water.
Synthesis of fcc supraballs. The same synthesis as described above for colloidosomes was performed in absence of octadecene.
High-resolution HAADF-STEM imaging. High-resolution HAADF-STEM images were acquired using an aberration-corrected cubed FEI-Titan electron microscope at an operating voltage of 200 kV. A camera length of 115mm was used to guarantee incoherent imaging of the NCs.
Electron tomography.The HAADF-STEM tilt series was acquired using a FEI Tecnai Osiris electron microscope
operated at 200kV. For the acquisition of the tilt series a Fischione model 2020 singe tilt holder was used and the series was acquired using a tilt range from -76° to +70° with a tilt increment of 2°. The projection images were aligned using a cross-correlation algorithm together with a manual tilt axis adjustment and the reconstruction
was performed using SIRT implemented in the FEI Inspect 3D software.[49]
CryoTEM. A 4 μL droplet of sample dispersed in aqueous solution was deposited on a Quantifoil® (Quantifoil Micro Tools GmbH, Germany) holey carbon grid. The excess of liquid on the grid was absorbed with filter paper and the grid was quench-frozen quickly in liquid ethane to form a thin vitreous ice film. The grid was then placed in a Gatan 626 cryo-holder and cooled down with liquid nitrogen. The sample was then transferred to the microscope and observed at a low temperature (−180 °C). Cryo-TEM images were taken with a 2k × 2k Gatan Ultrascan 1000 CCD camera (Gatan, USA), using a LaB6 JEOL JEM2100 (JEOL, Japan) cryo-microscope
operating at 200 kV (IMPMC, Sorbonne Université – CNRS UMR 7590, Paris, France). Images were taken with the JEOL low dose system (Minimum Dose System, MDS) to protect the thin ice film from any irradiation before imaging and to reduce the irradiation damages during the image capture.
Magnetization measurements. Magnetometry measurements were performed in a Quantum Design. commercial Vibrating Sample Magnetometer (VSM). The ZFC/FC measurements were performed in a low pressure He atmosphere and the magnetization of the samples dispersed in water was measured in a magnetic field of 10G as a function of temperature.
Nanomechanical characterizations. A small droplet of about 50-100 µL of colloidosome and supraball aqueous suspensions was deposited on a freshly cleaved mica surface prior scanning probe microscopy (SPM) measurements. The samples were dried at about 65 ˚C for 5 min. Scanning probe microscopy measurements were conducted with a JPK NanoWizard 3 AFM (JPK Instruments AG, Germany). The measurements were conducted using Quantitative Imaging mode (QI™). This mode is a single frequency SPM method which allows capturing a force curve during every cantilever tip contact with surface and minimizing the lateral forces acting in between the tip and surface. In this mode, captured force curves are further analyzed to extract various surface properties, such as adhesion, stiffness, elastic modulus, deformation, etc. The adhesion force (the maximum attractive force on separation between the tip and surface) and stiffness (the slope of the linear repulsive part on the approach curve) are directly determined from the force curve. However, extraction of elastic modulus requires application of a contact mechanics model, such as Derjaguin, Muller, and Toporov (DMT) to fit a part of the retrace force curve. Thus, evaluated elastic modulus maps presented in this paper are model dependent. Also, a substrate contribution to the evaluated elastic modulus cannot be fully neglected since NCs are quite small and hard. A more detailed description on how the nanomechanical parameters are determined and evaluated from
measured force curves in QI mode is provided in reference [50]. Rectangular SPM cantilevers with a
diamond-like carbon coating and a nominal spring constant of 40 N/m (Budget Sensors, Tap300 DLC) were used. The exact value of spring constant value was determined using the Sader method implemented in the JPK software. The end tip radii of the cantilevers were evaluated by measuring the elastic modulus on a reference sample with known modulus (polystyrene) and found to be in the range of 9–15 nm. The recorded data were analyzed using the JPK Data Processing Software (version 4.3) and data-processing software Gwyddion (version 2.44). The maximum imaging force was 25-35 nN and the acquisition speed was 31 µm/s in case of supracrystals and 44 µm/s in case of colloidosomes.
Cell culture. A431 human epidermoid carcinoma cells were cultured in Roswell Park Memorial Institute medium
(RPMI) supplemented with 10% fetal bovine serum and 1% penicillin and maintained at 37°C and 5% CO2.
Cells were incubated with dispersed NCs, colloidosomes and supraballs in complete medium at different concentrations according to the experiment for 4hours, 30min, 1 and 2 days and after careful washing cell were maintained in culture in complete medium for 3, 5 and 8 days at 37°C and 5% CO2.
Cytotoxicity assay. Cellular metabolic activity was evaluated using Alamar Blue assay (Life Technologies). Cell viability was checked after cellular incubation with isolated NCs, colloidosomes and supraballs at different iron
concentrations (11, 28, 56 and 112 µg/mL) in serum-supplemented RPMI medium in 48 well plates (≈ 9 x 10⁴
cells per well) for 1 day. The medium was then removed and the cells were washed with RPMI. Cells were then incubated with 10% Alamar Blue in DMEM without phenol red for 2 hours. The medium was then transferred to a 96-well plate for analysis with a microplate reader (EnSpire Multimode Plate Reader, Pelkin Elmers, Waltham, MA, USA) at an excitation wavelength of 550nm, with fluorescence emission detection at 590 nm. Cell viability was determined by comparing with control non-exposed cells. Cells incubated with DMSO 10% were used as a positive control (high cytotoxicity). All experiments were performed in triplicate.
Cell necrosis assay. 1.5 x 10⁴ cells were seeded in each well of 18 well µ-slides (Ibidi, Germany). The cells were
then incubated with isolated NCs, colloidosomes or supraballs at 28 µg/mL of iron overnight. Cell necrosis was evaluated by the Chromatin Condensation & Membrane Permeability Dead Cell Apoptosis Kit, purchased from Molecular Probes-Invitrogen Detection Technologies (Eugene, OR) used according to the manufacturer’s protocol. Briefly, the cells were washed with Phosphate Buffer Saline (PBS) and incubated with 1 μl each of
Hoechst 33342 stock solution and propidium iodide stock solution at 37°C in an atmosphere of 5% CO2 for 15
minutes. The cells were observed using a Andor Technology with Olympus JX81/BX61 Device/Yokogawa CSU Device spinning disk microscope (Andor Technology plc, Belfast, Northern Ireland) using appropriate filters. The dead cells were stained with red-fluorescent propidium iodide dye whilst the blue-fluorescent Hoechst 33342 stains the chromatin of the cells. 30 images were taken for each condition. All experiments were performed three times. To quantify the level of cell death, the number of propidium iodide labeled nuclei as well as Hoechst 33342 labeled nuclei were counted using ImageJ Cell Counter plugin.
Cell magnetophoresis. Cells were incubated with dispersed NCs, colloidosomes or supraballs at 28 µg/mL of
iron for 1 day at 37°C and 5% CO2. The medium was then removed and cells were washed with PBS. Cells were
then detached by trypsinization and re-suspended in RPMI medium.
The magnetophoretic mobility’s of labeled cells were measured according to the protocol described elsewhere.
[51] Briefly, labeled cells were introduced in a quartz chamber and submitted to a magnetic field gradient gradB of
17T/m induced by a permanent magnet (B= 0.15T). The motion of each single cell was recorded using video microscopy in order to assess cell velocity vcell towards the magnet in a permanent regime in which the magnetic
force (McellgradB) is counterbalanced by Stokes’ viscous force (6πηRcellvcell). Mcell is the cell magnetic moment,
h the viscosity of the aqueous medium, Rcell is the cell radius. For each condition, 40-50 individual cells were
recorded. The calculation of the cellular iron mass is deduced from each cell velocity. The magnetic moment can be transformed into the mass of internalized iron via the volumic magnetization (50emu/g for the field B of 0.15 T).
Transmission Electron Microscopy of cells. TEM images of cells were acquired using a Hitachi HT7700 operating at 80 kV (MIMA2 platform, INRA, Jouy-en- Josas, France, https://doi.org/ 10.15454/1.5572348210007727E12). A431 cells were exposed to dispersed NCs, colloidosomes and supraballs at 28 µg/mL of iron for 30 min, 4 hours and 1 day and after washing let in culture for 2, 5 and 8 days at 37°C. Cells were detached by trypsinization, washed twice with PBS and fixed with 2% glutaraldehyde in 0.1 M Na
cacodylate buffer pH 7.2, for 1 hour at room temperature. Samples were then contrasted with Oolong Tea Extract (OTE) 0.5% in cacodylate buffer for 1 hour at room temperature, post fixed with 1% osmium tetroxide containing 1.5% potassium cyanoferrate for 1 hour at room temperature, gradually dehydrated in ethanol: 70% 5min incubation, 90% - 5 min incubation, 100% - 5min incubation 3 times. Ethanol was then substituted gradually in mix of ethanol-Epon under vacuum for 1 hour and finally embedded in Epon (Delta microscopie – Labège France). Thin sections (70 nm) were collected onto 200 mesh copper grids, and counterstained with lead
citrate. Images were acquired with a charge-coupled device camera (AMT). Images were processed with ImageJ
(NIH, USA). To quantify the presence of NCs 100 nm from the endosome membrane the image was processed by an own written code in Python (Version 3.5).
Small angle X-ray scattering (SAXS). A431 cells (2.106 cells) were exposed to dispersed NCs, colloidosomes and
supraballs at 28 µg/mL of iron for 30 min, 4 hours and 1, 2 days at 37 °C. Following incubation cells were detached by trypsinization, washed twice with PBS and fixed with 4 % paraformaldehyde for 1 hour at room temperature. The fixed cells were then dispersed in 100 µL of PBS to reach a concentration of 2 107 cells/mL and
inserted into cylindrical quartz capillary of 1.5mm diameter that were sealed and left vertical in the field of gravity. In this configuration, the cell concentration at a given time evolves with time. Small angle X-ray scattering (SAXS) experiments were performed on SWING beamline (SOLEIL synchrotron, Saint-Aubin, France) and P12 beamline (DESY synchrotron, Hamburg, Germany) with a photon energy of 12 keV and a sample-to-detector distance of 6 m leading to the following q-ranges: 0.0016 Å-1 ≤ q SWING ≤ 0.23 Å-1 and 0.0025
Å-1 ≤ q P12 ≤ 0.20 Å-1. We recall that q=(4π/λ)sinθ, where 2θ is the scattering angle and λ = 1.033 Å is the
wavelength. The scattering patterns were always isotropic and radially averaged to obtain the scattering curves I(q). We stress that the absolute value of the scattered intensity cannot be analyzed in a quantitative manner due to the above mentioned variation of the concentration of cells illuminated by the beam. In other words, we can detect the presence of internalized NCs but we cannot derive their concentration from the scattered intensity. We underline that the introduction of agarose in the suspending media was tested to limit the variation of cell concentration but the presence of agarose makes signal subtraction difficult, therefore this protocol was not applied.
Measurements were performed on dispersed NCs and hybrid structures after cell internalization as a function of incubation times (tincub.) between 4 hours and 2 days at fixed iron concentration in the incubation medium. For
tincub. ≥4 h, the total scattered intensity of cells incubated with dispersed NCs, colloidosomes or supraballs was
always higher than the control cells. To clarify the contribution of NCs, we subtracted the contribution of the
control cells from the total scattered intensity, , to obtain (Figures S9).
Although the absolute value of the scattered intensity cannot be analyzed in a quantitative manner due to concentration effect, the shape of the curves can be analyzed quantitatively to extract the form factor P(q) and eventually the structure factor S(q) of internalized NCs.
Magnetic alignment and manipulation of NCs in cells. 3 x 10⁵ A431 cells were seeded in 35mm cell culture
dishes, incubated with the isolated NCs, colloidosomes and supraballs at 28 µg/mL of iron overnight and
washed. Cells were then placed on a uniform magnetic field created by two parallel magnets (B = 1 T) immobilized in a solid structure at 10cm distance from each other. The cell plate is placed exactly in the middle of these two magnets. During 4 hours under this magnetic field and at 37°C and 5% CO2., intracellular
alignments of nanostructures are formed. Without removing them from the magnetic field, cells were washed twice with PBS and fixed with 2% glutaraldehyde in 0.1 M Na cacodylate buffer pH 7.2, for 1 hour, which was then replaced by 0.1 M Na cacodylate buffer for storage until sample preparation for TEM. The TEM sample preparation protocol was the same as that explained above. Alternatively, unfixed live cells were placed under a brightfield microscope with a x40 objective. The cells were then submitted to a magnetic field gradient of 145 mT-17T/m induced by a magnet. The formation of the alignment was recorded by videomicroscopy. The magnetic field gradient was then shifted 90°C, the formation of the new alignments was then recorded.
Supporting Information
Supporting Information is available from the Wiley Online Library or from the author.
Acknowledgements
We thank Dr J. Teixeira from Laboratoire Leon Brillouin CEA Saclay for fruitful discussions on SAXS measurement, to Dr. J.M. Guinier for cryoTEM experiments. ANB received a PhD fellowship by the Institute thematique multi-organismes (ITMO) Cancer and the doctoral school Frontières du Vivant (FdV) – Programme Bettencourt and the Fondation ARC pour la recherche sur le cancer.
Conflict of Interest
The authors declare no conflict of interest.
[1] Wilhelm, S.; Tavares, A. J.; Dai, Q.; Ohta, S.; Audet, J.; Dvorak, H. F.; Chan, W. C., Nat. Rev. Mater.
2016, 1 (5), 16014.
[2] Anselmo, A. C.; Zhang, M.; Kumar, S.; Vogus, D. R.; Menegatti, S.; Helgeson, M. E.; Mitragotri, S.
ACS Nano 2015, 9 (3), 3169-3177.
[3] Anselmo, A. C.; Mitragotri, S., Adv. Drug Delivery Rev. 2017, 108, 51-67.
[4] Benne, N.; van Duijn, J.; Kuiper, J.; Jiskoot, W.; Slütter, B., J.Controlled Release 2016, 234, 124-134.
[5] Zhang, S.; Gao, H.; Bao, G., ACS Nano 2015, 9 (9), 8655-8671.
[6] Myerson, J. W.; Braender, B.; Mcpherson, O.; Glassman, P. M.; Kiseleva, R. Y.; Shuvaev, V. V.;
Marcos-Contreras, O.; Grady, M. E.; Lee, H. S.; Greineder, C. F., Adv. Mater. 2018, 30 (32), 1802373.
[7] Muro, S., Biomimetics 2018, 3 (3), 19.
[8] Hartmann, R.; Weidenbach, M.; Neubauer, M.; Fery, A.; Parak, W. J., Angew. Chem., Int. Ed. 2015, 54
[9] Song, W.; Soo Lee, S.; Savini, M.; Popp, L.; Colvin, V. L.; Segatori, L., ACS Nano 2014, 8 (10), 10328-10342.
[10] Ma, X.; Wu, Y.; Jin, S.; Tian, Y.; Zhang, X.; Zhao, Y.; Yu, L.; Liang, X.-J., ACS Nano 2011, 5 (11), 8629-8639.
[11] Retif, P.; Pinel, S.; Toussaint, M.; Frochot, C.; Chouikrat, R.; Bastogne, T.; Barberi-Heyob, M., Theranostics 2015, 5 (9), 1030.
[12] Comenge, J.; Fragueiro, O.; Sharkey, J.; Taylor, A.; Held, M.; Burton, N. C.; Park, B. K.; Wilm, B.;
Murray, P.; Brust, M., ACS Nano 2016, 10 (7), 7106-7116.
[13] Levy, M.; Wilhelm, C.; Luciani, N.; Deveaux, V.; Gendron, F.; Luciani, A.; Devaud, M.; Gazeau, F.,
Nanoscale 2011, 3 (10), 4402-4410.
[14] Cabrera, D.; Coene, A.; Leliaert, J.; Artés-Ibáñez, E. J.; Dupré, L.; Telling, N. D.; Teran, F. J., ACS Nano 2018, 12 (3), 2741-2752.
[15] Lévy, M.; Wilhelm, C.; Devaud, M.; Levitz, P.; Gazeau, F., Contrast Media Mol. Imaging 2012, 7 (4),
373-383.
[16] Pérez-Hernández, M.; del Pino, P.; Mitchell, S. G.; Moros, M.; Stepien, G.; Pelaz, B.; Parak, W. J.; Gálvez, E. M.; Pardo, J.; de la Fuente, J. s. M., ACS Nano 2014, 9 (1), 52-61.
[17] Moros, M.; Ambrosone, A.; Stepien, G.; Fabozzi, F.; Marchesano, V.; Castaldi, A.; Tino, A.; de la
Fuente, J. M.; Tortiglione, C., Nanomedicine 2015, 10 (14), 2167-2183.
[18] Etoc, F.; Lisse, D.; Bellaiche, Y.; Piehler, J.; Coppey, M.; Dahan, M., Nat. Nanotechnol. 2013, 8 (3), 193.
[19] Motte, L.; Billoudet, F. a.; Pileni, M., J. Phy. Chem. 1995, 99 (44), 16425-16429.
[20] Murray, C. B.; Kagan, a. C.; Bawendi, M., Annu. Rev. Mater. Sci. 2000, 30 (1), 545-610.
[21] Pileni, M.-P., J. Phys. Chem. B 2001, 105 (17), 3358-3371.
[22] Pileni, M.-P., Acc. Chem. Res. 2007, 40 (8), 685-693.
[23] Boles, M. A.; Engel, M.; Talapin, D. V., Chem. rev. 2016, 116 (18), 11220-11289.
[24] Yang, Z.; Altantzis, T.; Zanaga, D.; Bals, S.; Tendeloo, G. V.; Pileni, M.-P., JACS 2016, 138 (10), 3493-3500.
[25] Yang, N.; Deeb, C.; Pelouard, J.-L.; Felidj, N.; Pileni, M.-P., ACS Nano 2017, 11 (8), 7797-7806.
[26] Mazzanti, A.; Yang, Z.; Silva, M. G.; Yang, N.; Rizza, G.; Coulon, P.-E.; Manzoni, C.; de Paula, A. M.;
Cerullo, G.; Della Valle, G., PNAS 2019, 116 (17), 8161-8166.
[27]. Lartigue, L.; Alloyeau, D.; Kolosnjaj-Tabi, J.; Javed, Y.; Guardia, P.; Riedinger, A.; Péchoux, C.; Pellegrino, T.; Wilhelm, C.; Gazeau, F., ACS Nano 2013, 7 (5), 3939-3952.
[28] Kolosnjaj-Tabi, J.; Javed, Y.; Lartigue, L.; Volatron, J.; Elgrabli, D.; Marangon, I.; Pugliese, G.; Caron, B.; Figuerola, A.; Luciani, N., ACS Nano 2015, 9 (8), 7925-7939.
[29] Volatron, J.; Carn, F.; Kolosnjaj-Tabi, J.; Javed, Y.; Vuong, Q. L.; Gossuin, Y.; Ménager, C.; Luciani, N.; Charron, G.; Hémadi, M., Small 2017, 13 (2), 1602030.
![Figure 3. 2D TEM slices images of A431 cells incubated with Fe O NCs ([Fe] = 28 μg L −1 ) for different points of times (30 min, 4 h, 1 day, and at 8 days postinternalization after 1 day incubation.](https://thumb-eu.123doks.com/thumbv2/123doknet/12974752.377925/9.892.174.719.224.663/figure-slices-images-incubated-different-points-postinternalization-incubation.webp)


