The photoionization of ammonia revisited.
The vibrational autoionization of NH
3and its three isotopomers in the 10-12
eV photon energy range
R. Locht, B. Leyh
Département de Chimie Générale et de Chimie Physique, Institut de Chimie, Bât. B6, Université de Liège, Sart-Tilman par B-4000 Liège 1, Belgium
W. Denzer, G. Hagenow and H. Baumgärtel
Institut für Physikalische und Theoretische Chemie, Freie Universität Berlin, Takustrasse 3, W-1000 Berlin 33, Germany
Abstract
The photoionization efficiency curves of NH3 and its three isotopomers have been investigated in the
photon energy range of the first ionized state. From the analysis of the corresponding vibrational structure, wavenumbers (ωe) and anharmonicity constants (ωexe) are deduced. The detailed investigation of the abundant
autoionization structure tends to show the adiabatic ionization energy to be 10.072 ± 0.010 eV for NH3, NH2D
and NHD2 and 10.083 ± 0.010 eV for ND3. All autoionization features were classified in vibrational progressions
(v2 bending mode) belonging to nsa1 (or nd) and npe (n=5, 6, 7) Rydberg series. Vibrational autoionization
occurs through ∆v transitions up to -9. A qualitative analysis of the intensity distribution of these series strongly supports that transitions involving odd ∆v values are favoured. This observation can be understood by applying group theoretical considerations to the theory of vibrational autoionization.
1. Introduction
Below the first ionization limit the vibronic spectrum of NH3 has been abundantly investigated by
numerous workers using various techniques [1-8]. It is generally well established that all the ammonia electronic excited states are of Rydberg character arising from the excitation of one of the nitrogen non-bonding lone pair electrons. The dominant features in these spectra are long vibrational progressions in the v2 inversion mode
arising because the excited states are planar whereas the ground state is pyramidal.
Few investigations of these spectra were extended above the first ionization limit [3,4,7,8]. The most salient feature is the extension of more or less well resolved vibrational progressions up to about 10.8 eV (115 nm ) vanishing in a continuum.
Photodissociation of NH3 in the vacuum UV region into neutral species, e.g. NH2 and NH, has also
been investigated both experimentally and theoretically [9-11]. Emission thresholds for photodissociation were measured.
In the framework of our dissociative ionization study of NH3 by electron impact [12] and
photoionization [ 13 ], the contribution of autoionization was shown to play a role. However autoionization in this molecule has scarcely been investigated [14].
The aim of this paper is to report about the autoionization of NH3 investigated first in the 10-12 eV
photon energy range. The present study has been extended to the examination of this phenomenon in the three isotopomers NH2D, NHD2 and ND3. The abovementioned energy range lying below the lowest appearance
energy for dissociative photoionization of NH3 into the NH2 +
+H channel, the photoionization mass spectrometric technique has been used.
2. Experimental
The experimental setup used in the present experiment is described in detail in a previous paper [15]. Synchrotron radiation provided by the electron storage ring BESSY (Berlin) was used as a light source. It was
dispersed by a 1 meter NIM-monochromator (McPherson 225) equipped with a 1200 l/mm grating. The
entrance and exit slits were set to give a resolution of about 0.2 nm. The absolute calibration of the wavelength was better than ±0.2 nm.
The dispersed photon flux passed through an ion chamber and has been measured by a sodium salicylate sensitized photomultiplier. The produced photoions are mass analyzed in a quadrupole mass filter and detected by a channeltron multiplier. The pho-toion yield is continuously normalized to the photon flux.
The sample pressure of 10-5 mbar in the ionization region is maintained below 10-7 mbar in the monochromator by differential pumping.
The NH3 sample gas of 99.99% purity was used without further purification. A sample of a mixture
ND3, NH2D and NHD2 was obtained from Merck, Sharp and Dohme.
3. Experimental results
Typical photoionization efficiency curves, measured between 9.77-11.80 eV (105-127 nm) photon energy, for the four molecular ions NH3
+ , NH2D + , NHD2 + and ND3 +
are displayed in figs. 1 and 2.
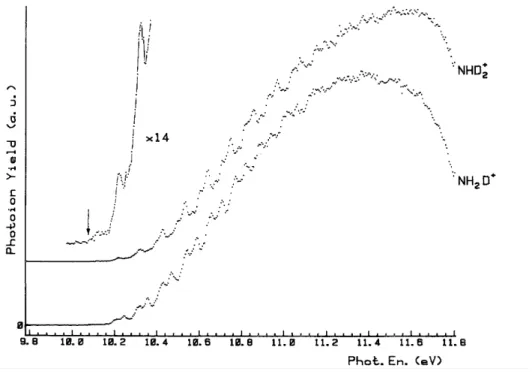
An abundant and fairly well resolved autoioniza-tion structure, superposed on a more or less distinguishable "step shaped" ionization continuum, is observed. Very noteworthy is the drastic isotope effect on the shape and intensity of the autoionization structure. Whereas the presence of the underlying step-like continuum is obvious in the deuterated species, it is rather difficult to observe in NH3. Furthermore, in the low
energy range of 9.9-10.0 eV. ( 123.98-125.2 nm) very weak features are detected in ND3 +
. These are even weaker in NHD2
+
and are almost not detectable in NH2D +
and NH3 +
.
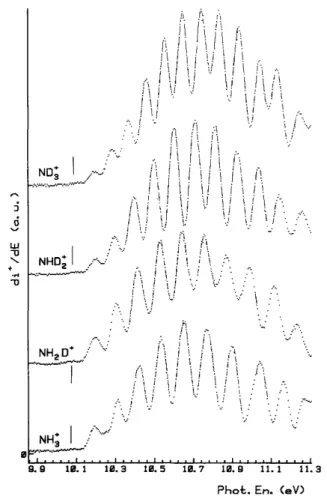
To determine the shape and the structure of the underlying ionization continuum, the photoion yield curves were apodized and filtered by fast Fourier transform to quench the autoionization structure. The yield curves handled in this way were numerically differentiated. A simulated photoelectron spectrum is obtained for the four isotopic species. The result is shown in fig. 3.
Fig. 1. The photoionization efficiency curves of NH3 and ND3. Vertical bars indicate the adiabatic ionization
Fig. 2. The photoionization efficiency curves of NH2D and NHD2. Vertical bars indicate the adiabatic ionization
energy. The NHD2+ ion signal is amplified in the threshold region.
The well known vibrational structure of the ground electronic state of ionized ammonia is observed. The ionization energies deduced from the present work are compared to photoelectron spectroscopic results [16,17] in table 1 in the case of NH3+ and ND3+. The same data obtained for NH2D+ and NHD2+ are gathered in
table 2.
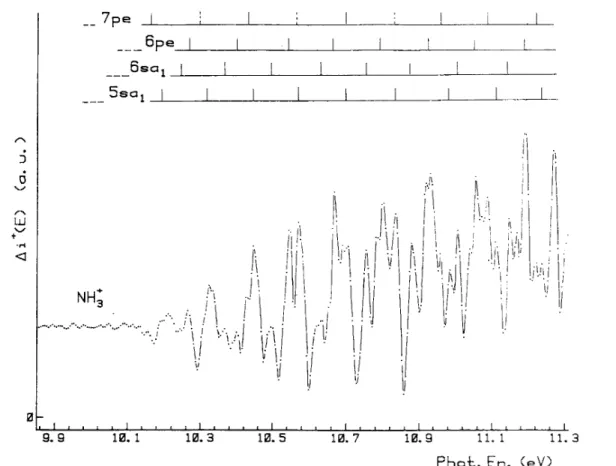
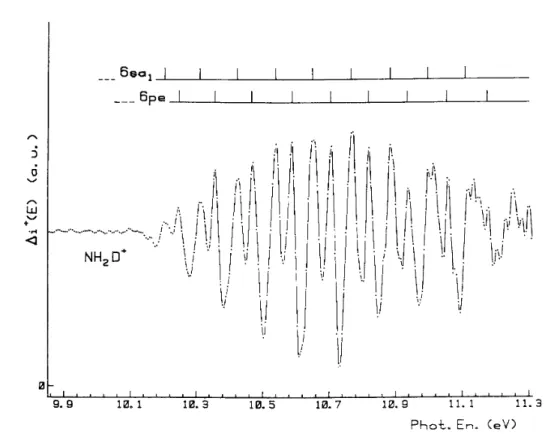
To enhance the autoionization structure, the filtered ionization efficiency curves are subtracted from the original photoion yield curves. The results obtained for the four isotopomers are shown in figs. 4-7.
The autoionization spectra show remarkable differences for the four isotopic species investigated in this work. For each of these species several vibrational progressions are observed and classified as shown in tables 3-6 and inserted in figs. 4-7. The present results are compared to the most recent electron energy-loss spectroscopic data for NH3+ [8].
4. Discussion
4.1. The simulated photoelectron spectra
As shown in table 1 the present photoionization results compare fairly well with the photoelectron spectroscopic data for NH3
+
[16] and ND3 +
[17]. However, for ND3 +
a lower lying level at 10.083 ±0.010 eV has been observed in the present work. This point will be discussed in the next section.
In the four spectra at least thirteen vibronic transitions have been identified and should correspond to the excitation of the same v2 bending vibrational mode producing the inversion of ammonia [16]. For the four
molecular ions a more or less regular increase of the vibrational spacing is observed and has to be related to a negative anharmonicity [16].
The experimental data have been fitted to the following equation [18] Ev=E0 + ( v+ 1/2 )hcωe — ( v+1/2 )2hcωexe, ( 1 )
where xe/ωe=constant and where Ev, E0, v, h, c, ωe and xe have the usual meaning. The ratio xe/ωe can be assumed
constraint on E0, ωe and ωexe, a ratio
is obtained for NH2D+, NHD2+ and ND3+. For NH3+ the value showed a stronger deviation. By inserting this
value of xe/ωe into eq. ( 1 ) a new best fit to the experimental data has been attempted with the constraint that
xe/ωe remains constant. The results are summarized in table 7.
Fig. 3. The first derivative of the filtered (see text) ionization efficiency curves of NH3, NH2D, NHD2 and ND3.
Vertical bars locate the adiabatic ionization energy.
An identical treatment has been applied to the experimental data of Rabalais et al. [16] and Weiss et al. [17]. The results are introduced in table 7. In this table the expected ωe values are included, as calculated for a
valence-force field potential [19] which gives ratios
4.2. The adiabatic ionization energy
As shown in figs. 1-3 and in tables 1 and 2, a first ionization energy is measured at 10.072 ±0.010 eV for NH3, NH2D, and NHD2 and at 10.083 ± 0.010 eV for ND3. For NH3 the lowest onset measured in this work is
in very good agreement with the value published by Rabalais et al. [16], i.e. 10.073 eV. However, these authors mention that "the origin of the band at the lowest energy is uncertain. It may be the 0←0 band or a hot band enhanced by a high Franck-Condon factor". If the peak at 10.073 eV is assumed to correspond to the hot band, the intensity ratio, as measured by the ratio of the peak height between the "hot band" and the next vibrational
level is about 0.2 in the photoelectron spectrum [16].
In the photoionization efficiency curves this ratio can be obtained by measuring the relative height of the "step"-function as far as it can be estimated. In spite of the weakness of the signal in the onset region, a ratio of the first two levels for the four isotopic species investigated in this work, is obtained: (0.2 ± 0.05)ND3+;
(0.14±0.02)NHD2+; (0.14±0.02)NH2D+;(0.15±0.05)NH3+.
Ågren et al. [20] performed Franck-Condon factor calculations with the data of Rabalais et al. [16]. They ascribed the first band to the adiabatic ionization energy of NH3. However, Botschwina [21] revised these
calculations and concluded that the band at 10.181 eV should correspond to the adiabatic ionization energy. If the lowest level at about 10.07 eV is assumed to be a hot band, and that at about 10.18 eV is ascribed to the 0←0 transition, the intensity ratio is expected to closely reflect the relative population of v— 1 to v=O levels in the ground electronic state of the molecule. For NH3 and ND3 at 300 K the relative population of the v=
1 bending vibrational level in the molecular ground state would be 1.3 x 10⁻² and 3.4 X 10⁻² with respect to the ground vibrational level v=0, respectively. These ratios do not account for either those measured by photoelectron spectroscopy or by photoionization. There is no argument for a sudden modification of the Franck-Condon factor for the 0←1 transition with respect to the 0←0 transition. A further argument favouring the present interpretation of the 10.07 eV onset as corresponding to the 0←0 transition is found in the photoionization efficiency curves.
Table 1. Ionization energies (eV) for X~2A1, v←X ~l
A1, v=0 in NH3 and ND3 and comparison with photoelectron
spectroscopy NH3 ND3 v this work (± 0.010eV) ref. [16] (± 0.005 eV) this work (± 0.010eV) ref. [17] (± 0.005 eV) 0 10.072 10.073 10.083 - 1 10.191 10.183 10.185 10.180 2 10.309 10.291 10.277 10.290 3 10.422 10.411 10.363 10.380 4 10.530 10.531 10.460 10.473 5 10.643 10.652 10.551 10.581 6 10.767 10.772 10.643 10.664 7 10.896 10.911 10.740 10.762 8 11.036 11.038 10.831 10.842 9 11.160 11.158 10.934 10.942 10 11.289 11.291 11.041 11.039 11 11.434 11.430 11.128 11.141 12 11.564 11.569 11.240 11.246 13 - 11.705 (11.327) a) 11.331 14 - 11.838 (11.461) a) 11.443 15 - 11.974 - - 16 - 12.110 - - 17 - 12.253 - - a)
In parentheses: less accurate values.
Anticipating the discussion of the autoionization spectra (see next section), the detection of very weak structures in ND3
+
and NHD2 +
below the assumed lowest ionization energy has to be mentioned. The intensity of these features falls in the background signal for NH2D
+
and NH3 +
. As shown in tables 3-6 these structures fit fairly well into Rydberg series and will be ascribed to autoionization processes to the 0←1 transition. The intensity decrease of the autoionization features with isotopic substitution is qualitatively accounted for by the relative population of the v= 1 level of the v2 bending mode in the different isotopomers.
With the hypothesis assuming the adiabatic ionization energy at 10.072 eV (or 10.083 eV) in NH3 (or
ND3) to be the 0←1 hot band, the present features would have to be assigned to autoionization processes to the
0←2 transition. The relative population of NH3 (v=2) and ND3 (v=2) are 1.85 x 10⁻⁴ and 1.18 x 10⁻³. The
which is far too large with respect to the expected value.
Table 2. Ionization energies (eV) for X~2A1, v←X~lA1, v=0 in NH2D andNHD2
v NH2D (± 0.010 eV) NHD2 (± 0.010 eV) 0 10.072 10.072 1 10.191 10.191 2 10.298 10.293 3 10.406 10.390 4 10.524 10.497 5 10.637 10.600 6 10.751 10.708 7 10.864 10.810 8 10.988 10.918 9 11.111 11.036 10 11.230 11.138 11 (11.348) a) 11.257 12 (11.488) a) (11.348) a) 13 - (11.472) a) a)
In parentheses: less accurate values.
Fig. 4. The autoionization spectrum of NH3. The vibrational progressions belonging to the four Rydberg
Fig. 5. The autoionization spectrum of NH2D. The vibrational progressions belonging to the observed Rydberg
transitions are indicated by vertical bars.
Fig. 6. The autoionization spectrum of NHD2. The vibrational progressions belonging to the observed Rydberg
Fig. 7. The autoionization spectrum of ND3. The vibrational progressions belonging to the observed Rydberg
transitions are indicated by vertical bars.
4.3. The autoionization spectra
The electronic configuration of the ground state of ammonia in the C3v symmetry is
(1a1) 2 (2a1) 2 (1e)4(3a1) 2
X~1A1 [22]. The vibronic spectrum is almost only generated by promoting the 3a1 electron
to (nsa1), (npa1), (npe) or nd orbitals. The depletion of the 3a, orbital leads to excited states where the molecule
has a planar geometry [20]. Photoabsorption [1-6] and electron energy-loss spectra [7,8] show a series of excited electronic states, each being characterized by only one vibrational progression and assigned to the v2 inversion
bending mode [1-8 ]. All these states, of Rydberg character (noted in the literature by à to H~), have been assigned [1-8]. A number of these states were analyzed above the ionization limit of 10.072 eV, e.g. the states designated by D~, E~, F~, G~) and H~states [3,4,7,8].
To analyze the present results the Rydberg formula has been used
where Ev Rydb
is the energy of the Rydberg vibronic level, IEV is the energy of the vibrational level v of the
molecular ion, R is the Rydberg constant, n is the principal quantum number and δ is the quantum defect. The magnitude of this parameter is strongly bound to the nature of the Rydberg orbital. From previous analyses of the electronic spectra in NH3 the following values of J have been proposed [3,4,23]:
For clarity, in the following discussion the autoionization spectra of the four isotopomers will be discussed separately.
Table 3. Autoionization spectrum of NH3: energy (eV), quantum defect (δ), principal quantum number (n), term
value (T) (eV) and calculated convergence limit (eV). Comparison with electron energy-loss spectroscopy (EELS) [8] and photoelectron spectroscopy [16]. The estimated error on the present data is ± 0.010 eV and on EELS data ± 0.005 eV [ 8 ]
NH3 NH3
+
v
P.I. EELS [8] Calc. Obs. [16]
Assignt. A (7)a) (10.045) a) 10.055 (10.904) 10.911 δ =1.02 8 10.191 10.186 11.050 11.038 n = 5 9 10.320 10.320 11.179 11.158 T=0.859 10 10.444 10.450 11.303 11.291 5sa1 11 10.569 10.581 11.428 11.430 12 10.701 10.714 11.560 11.569 13 10.832 10.845 11.691 11.705 14 10.982 10.974 11.841 11.838 15 11.106 - 11.965 11.974 16 11.236 - 12.095 12.110 B 5 10.110 10.117 10.658 10.652 δ =1.02 6 10.239 10.243 10.787 10.772 n = 5 7 10.363 10.374 10.911 10.911 T = 0.548 8 10.492 10.505 11.040 11.038 6sa1 9 10.632 10.634 11.180 11.158 10 10.751 10.765 11.300 11.291 11 10.875 10.914 11.423 11.430 12 11.003 - 11.551 11.569 13 11.144 - 11.692 11.705 14 11.266 - 11.814 11.838 C 5 10.153 10.150 10.664 10.652 δ =0.84 6 10.261 10.274 10.772 10.772 n = 6 7 10.395 10.400 10.906 10.911 T =0.511 8 10.541 10.528 11.052 11.038 6pe 9 10.664 10.657 11.175 11.158 10 10.783 10.786 11.294 11.291 11 10.928 - 11.439 11.430 12 11.052 - 11.563 11.569 13 11.187 - 11.698 11.705 D 6 10.422 _ 10.775 10.772 δ =0.80 7 - - - 10.911 n=7 8 10.697 - 11.050 11.038 T =0.353 9 - - - 11.158 7pe 10 10.956 - 11.310 11.291 11 11.084 - 11.438 11.430 12 11.219 - 11.573 11.569 a)
In parentheses: less accurate values.
4.3.1. Ammonia-h3
For NH3 two Rydberg series have been identified, i.e. nsa1←3a1 (n = 5, 6) and npe←3a1 (n = 6, 7), as
shown in table 3. Except the 7pe state, all other states have been observed previously, i.e. the 5sal, the 6sa1, and
the 6pe noted in the literature by E~, H~ and ( F~,G~), respectively. However, for these vibrational progressions a few more levels could be identified. The very weak feature at 10.045 eV could be the most intense member of a residue of a hot band transition 5sa1 (v=7)←v=1. It has to be noted that the accuracy of the present data is
expected that in the energy range covered in this work s- and d-type Rydberg states will probably strongly mix. Table 4. Autoionization spectrum of NH2D: energy (eV), quantum defect (δ), principal quantum number (n),
term value (T) (eV). Calculated and observed convergence limit (eV). The estimated error on the present data is ±0.010 eV NH2D+ v NH2D Calc. Obs. Assignt. A 5 10.088 10.636 10.637 δ = 1.02 6 10.196 10.744 10.751 n = 6 7 10.306 10.854 10.864 T = 0.548 8 10.419 10.967 1.0.988 6sa1 9 10.535 11.083 11.111 10 10.646 11.194 11.230 11 10.764 11.312 (11.348) a) 12 10.880 11.428 (11.488) a) 13 10.993 11.541 - 14 11.111 11.659 - B 5 10.131 10.650 10.637 δ =0.88 6 10.239 10.758 10.751 n = 6 7 10.352 10.871 10.864 T =0.519 8 10.465 10.984 10.988 6pe 9 10.584 11.103 11.111 10 10.702 11.221 11.230 11 10.815 11.334 (11.348) a) 12 10.934 11.453 (11.488) a) 13 11.052 11.571 - a)
In parentheses: less accurate values.
For each of these series a long vibrational progression has been observed fitting, in most cases, in series already observed previously. For the 7pe series only the higher part of the progression is observed, the lower members being probably buried under the more intense members of lower energetic states. Table 3 shows good agreement between the present pho-toionization work and electron energy-loss spectroscopy [8]. Furthermore, the calculated convergence limit for each vibrational progression is in good agreement with the photoelectron spectroscopic data of Rabalais et al. [16].
In the four vibrational progressions observed in this work no significant tendency is observed to increase or decrease of the spacing between adjacent levels. An average vibrational wavenumber
ω
e can bedetermined for 5sa1 (1056 ± 60 cm -1
), 6pe (1064 ± 80 cm-1), 6sa, (1032 ± 60 cm-1) and 7pe (1080 ± 40 cm-1) for vibrational quanta 5<v<16. Considering v>5, by photoabsorption [3,4] and electron impact [ 8 ], no noticeable difference is observed between the four Rydberg states and the ωe value varies from 1030-1070 cm-1.
In table 3 a vibrational quantum number has been assigned to each member of the four progressions. This assignment takes into account the convergence limit of the two Rydberg series to the ground electronic state of the ion for which the adiabatic ionization energy is determined in this work to be 10.072 ±0.010 eV. Consequently, this has the result of a shift of ∆v= +1 with respect to previous works [3,4,8].
Notwithstanding the crowding of the spectrum displayed in fig. 4 a periodicity of the autoionization features strongly suggests vibrational autoionization. In the frame of this picture the 5 sa1 (v) state autoionizes
with ∆v= -7 transitions, the 6sa1 (v) and 6pe(v) autoionize with ∆v=-5 and the 7pe(v) state involves ∆v= -3
transitions. These values are the most probable and in the following we only consider these values.
This phenomenon has been investigated in NO [24] and C2H2 [25]. In these systems the Rydberg states
involved are characterized by short vibrational progressions and low vibrational quantum numbers. A propensity rule of ∆v= - 1 has been proposed for the vibronic transition from the superexcited state to the adjacent ionization continuum. This selection rule would probably hold for the harmonic approximation
Table 5. Autoionization spectrum of NHD2: energy (eV), quantum defect (δ), principal quantum number (n), term
value (T) (eV). Calculated and observed convergence limit (eV). The estimated error on the present data is ±0.010 eV v NHD2 NHD2 + Assignt. Calc. Obs. A 8 10.077 10.936 10.918 δ=1.02 9 10.191 11.050 11.036 n=5 10 10.288 11.147 11.138 T =0.859 11 10.396 11.255 11.257 5sa1 12 10.492 11.351 (11.348) a) 13 10.600 11.459 (11.472) a) 14 10.702 11.561 - 15 10.810 11.669 - 16 10.923 11.782 - 17 11.036 11.859 - 18 11.149 12.008 - 19 11.256 12.115 - B 4 10.018 10.521 10.497 δ=0.80 5 10.114 10.617 10.600 n = 6 6 10.218 10.721 10.708 T = 0.503 7 10.315 10.818 10.810 6pe 8 10.422 10.925 10.918 9 10.530 11.033 11.036 10 10.632 11.135 11.138 11 10.740 11.243 11.257 12 10.853 11.356 (11.348) a) 13 10.966 11.469 (11.472) a) 14 11.068 11.571 - 15 11.187 11.690 - 16 11.284 11.787 - C 5 10.050 10.626 10.600 δ=0.14 6 10.137 10.712 10.708 n = 5 7 10.250 10.826 10.810 T = 0.576 8 10.352 10.928 10.918 5d 9 10.460 11.036 11.036 10 10.562 11.138 11.138 11 10.670 11.246 11.257 12 10.778 11.354 (11.348) a) 13 10.885 11.461 (11.472) a) 14 - - - 15 11.106 11.682 - 16 11.214 11.790 - a)
In parentheses: less accurate values.
However, when long vibrational progressions of high vibrational quanta are involved the breakdown of this propensity rule has been demonstrated. In the diatomic case of H2, near threshold, Chupka and Berkowitz
[26] showed the occurrence of vibrational autoionization with ∆v= - 6 and ∆v= - 4 for D-X(6,0) and B"-X(4,0) transitions, respectively.
More relevant to the present work, Berkowitz and Greene [27] measured the photoion yield curve of PF3
+
. Their analysis led to the conclusion that vibrational autoionization occurs with ∆v< -13, in sharp contrast to the abovementioned theory of vibrational autoionization.
Table 6. Autoionization spectrum of ND3: energy (eV), quantum defect (δ), principal quantum number (n), term
value (T) (eV) and calculated convergence limit (eV). Comparison with photoelectron spectroscopic data [17]. The estimated error on the present data is ±0.010 eV
ND3 + v ND3 Calc. Obs. Assignt. A 8 10.002 10.861 10.842 δ=1.02 9 10.093 10.952 10.942 n = 5 10 10.207 11.066 11.039 T=0.859 11 10.293 11.152 11.141 5sa1 12 10.385 11.244 11.246 13 10.471 11.330 11.331 14 10.562 11.421 11.443 15 10.659 11.518 - 16 10.756 11.615 - 17 10.853 11.712 - 18 10.956 11.815 - 19 11.058 11.917 - 20 11.149 12.008 - 21 11.252 12.111 - B 5 10.039 10.551 10.581 δ=0.84 6 10.131 10.643 10.664 n = 6 7 10.239 10.750 10.762 T =O.511 8 10.325 10.837 10.842 6pe 9 10.417 10.928 10.942 10 10.530 11.042 11.039 11 10.632 11.144 11.141 12 10.724 11.235 11.246 13 10.826 11.337 11.331 14 10.918 11.429 11.443 15 11.025 11.536 - 16 11.128 11.639 - 17 11.209 11.720 - C 5 10.050 10.598 10.581 δ=1.02 6 10.115 10.664 10.664 n = 6 7 - - 10.762 T= 0.548 8 - - 10.842 6sa1 9 - - 10.942 10 - - 11.039 11 10.600 11.148 11.141 12 10.697 11.245 11.246 13 10.804 11.352 11.331 14 10.902 11.450 11.443 15 10.993 11.541 - 16 11.100 11.648 - 17 11.187 11.735 - . 4.3.2. Ammonia-d3
The autoionization spectrum of ND3 is displayed in fig. 7 and the autoionization levels are listed in table
6. Two Rydberg series are identified in this spectrum, i.e. (nsa1)←3a1 (n = 5, 6) and 6pe←3a1.
However, their spectral analysis is confined below the ionization limit. In spite of this limitation, the 0←0 transition of the 5sa1 band can be estimated and should be observed at 9.224 eV (74398 cm
-1
) whereas the 1←0 transition would be at 9.336 eV (75301 cm-1). Glownia et al. [5] mention the origin of an E~ state at 9.335 eV
(75458 cm-1). They assigned this state to the 4d orbital (δ=0) instead of the 5s orbital (δ=1.02) [4]. The 5s and 4d being nearly degenerate, these authors argue that transitions to a 4d orbital should be more intense than a transition to a 5s orbital owing to the n-3 intensity relationship [14] and the ∆l= + l propensity rule determined in atomic spectroscopy [28 ].
Table 7. Molecular constants ωe and ωexe determined for NH3+, NH2D+, NHD2+ and ND3+
ωe (cm-1) ωexe (cm-1) NH3 + this work 890 -8.0 ref. [16] 904 -8.0 ref. [17] 926 -6.6 calc. 914 NH2D + this work 848 -7.3 calc. 849 NHD2 + this work 780 -6.2 calc. 779 ND3 + this work 701 -5.0 ref. [17] 713 -3.9 calc. 701 a) a)
Used as reference (see text).
In opposition to the autoionization spectrum of NH3, the present spectrum is noticeably simpler. It is
dominated by one long vibrational progression of the 5sa1/4d state which shows a maximum intensity at about
v= 16. The vibrational progression associated with the transition to 6sa1 and 6pe orbitals have an intensity of
about 15% of that of the 5sa1 transition. The vibrational wavenumber of the 5sa1/4d state shows a negative
anharmonicity: for 8<v<16 ωc = 750 ± 50cm-1
and for v>16ωe=822 ± 10cm-1
. The vibrational progressions of 6sa1 and 6pe would be characterized by an average ωe = 787 ± 70 cm
-1
and 789 ± 64 cm-1, respectively. Characterizing the observed Rydberg series of ND3 by an ωe=790 ± 40 cm
-1
and taking for NH3 an ωe=1060 ± 30
cm-1, a ratio ωND3/ωNH3 = 0.75 ±0.06 is obtained whereas the valence-force field potential predicts a value of
0.767.
Noteworthy is that for the most intense 5sa1/4d state the autoionizing transition occurs with an odd ∆v=
- 5 whereas the other two superexcited 6pe and 6sa1 states decay with an even ∆v= - 6. On the other hand the
observed intensity differences are not accounted for by the ratios given by the n -3 rule.
The convergence limit of the Rydberg series is a further argument for the assignments presented in table 6. A satisfactory agreement is found between the vibrational energy of the ion by the Rydberg formula and the experimental data of Weiss et al. [17] obtained by photoelectron spectroscopy.
It has finally to be mentioned that for the three Rydberg states weak structures, ascribed to hot band autoionization, are observed. The features at about 10.002 eV, 10.039 eV and 10.055 eV, lying below the adiabatic ionization energy of 10.083 eV, could be assigned to 5sa1 (v=8), 6pe (v=5) and 6sa1 (v=5) vibronic
states.
4.3.3. Ammonia-d2
The autoionization spectrum of NHD2 is shown in fig. 6 and the autoionization levels are listed in table
5. For this isotopomer three Rydberg series are probably observed, i.e. 5sa1←3a1, 6pe←3a1 and 5d←3a1. For the
latter series the experimental results are best fitted by using a quantum defect δ=0.14 though a δ(nd)~0 is expected.
Walsh and Warsop [4] investigated the photoabsorption spectrum of NHD2 but only below the
The autoionization spectrum of NHD2 is dominated by a vibrational progression ascribed to the
6pe←3a1 transition which could be characterized by an average ωe = 840 ± 30 cm-l and a maximum intensity
near v=10. This Rydberg state autoionizes with an odd ∆v= - 5. The 5d←3a1 Rydberg state, with an ωe=847 ± 50
cm-1, is of lower intensity and has to decay with an even ∆v= - 6.
In spite of being characterized by the lowest principal quantum number, and therefore expected to be the most intense transition, the weakest series of this autoionization spectrum corresponds to 5sa1←3a1.
Vibrational autoionization occurs with an even ∆v= - 8. Below v=14 this state shows an average ωe=850 ± 60
cm-1 and shows a propensity to increase to 895 ± 20 cm-1 for v> 14. Taking an average wavenumber ωe = 870 ±
30 cm-1 for the observed Rydberg series and ωeNH3 = 1060 ± 30 cm -1
(see section 4.3.1) a ratio ωNHD2/ωNH3=0.82
± 0.04 is calculated and is comparable with 0.852 obtained by the valence- force field potential (see section 4.1 ). The convergence limit for each level has been calculated (see table 5). Satisfactory agreement is found between the vibronic energy levels of the NHD2+ molecular ion, as determined by the use of the Rydberg
formula and measured in the simulated photoelectron spectrum (see table 2 ) in this work. 4.3.4. Ammonia-d1
The autoionization spectrum of NH2D (see fig. 5) is quite similar to that of NH3 and is made up of only
two Rydberg series, i.e. 6sa1←3a1 and 6pe←3a1 of about equal intensity.
Walsh and Warsop [4] mention the study of this molecule in their photoabsorption work. However, no energy values are listed in the present energy range of interest.
The vibrational progression associated with the 6sa1 and the 6pe series could be characterized by
ωe=903±20 cm -1
and 927±30 cm-1, respectively, and the ratio ωNH2D/ωNH3= 0.86 ±0.05 has to be compared with
0.929 obtained by the valence-force field potential.
It has finally to be mentioned that both Rydberg states autoionize to the NH2D +
continuum with an odd ∆v= - 5.
4.3.5. The intensity distributions
Though it is difficult to discuss quantitatively the intensity distribution in the autoionization spectra of the four isotopomers, as mentioned earlier in this report, they exhibit large differences worthy of comment.
These are not related to the symmetry of the molecular systems: NH3 and ND3 exhibit the most
dramatic differences. On the contrary, there are more similarities between ND3 and NHD2 on one hand and NH3
and NH2D on the other hand.
There is no correlation between the intensities and the type of (n,l)-orbital involved in the excitation (n-3 and ∆l= +1 rules). When observing the spectra of ND3 and NHD2, the strongest autoionization levels are the 5sa1
and 6pe whereas the weakest are the 6pe and 5sal, respectively. These observations are summarized in table 8.
Table 8. Intensities and autoionizing transitions (Av) characterizing the Rydberg series observed for NH3 and its
three isotopomers
5sa1 5d 6sa1 6pe 7pe
NH3 s ∆v=-1 - w ∆v=-5 s ∆v=-5 w ∆v=-3 NH2D - - s ∆v=-5 s ∆v=-5 - NHD2 vw ∆v=-S w ∆v=-6 - s ∆v=-5 - ND3 s ∆v=-9 - vw ∆v=-6 vw ∆v=-6 -
s=strong, w=weak, vw=very weak.
parity of ∆v during the autoionizing transition: vibrational autoionization involving odd ∆v gives almost rise to the largest intensities.
This experimental observation can be understood in the framework of the theory of vibrational autoionization. This type of autoionization couples a discrete state ψnv and a continuum state ψEv' having the same core electronic wavefunctions but different vibrational wavefunctions. This interaction results from the fact that the potential energy surfaces of the Rydberg state and of the ionic state are not strictly parallel, owing to the bonding (or anti-bonding) character of the Rydberg electron [29,30]. Therefore, the quantum defect δ used in the Rydberg formula (section 4.3 ) is no longer a constant but varies slowly with the nuclear coordinate Q. Vibrational autoionization has mostly been studied for diatomic molecules in the framework of the MQDT theory [30,31 ]. In principle at least, the formalism can be extended to a polyatomic situation.
A Taylor expansion of δ about the ionic equilibrium geometry Qe +
, truncated to the linear term, is given by
The coupling matrix element between | ψnv) and I ψEv. > can than be written:
where n*=n—δ.
In the case of N(H, D)3, as both the Rydberg and the ionic states are planar, the D3h point group has to
be considered. The Q-coordinate is here the out-of-plane bending vibration belonging to the A2 "
representation. The vibrational states v and 'v describe this motion. If v and v have the same parity (∆v is even), their ' product will belong to the totally symmetric A'1 representation, the integrand to A2" and the integral
' | _ |Q Q v
v e+ will vanish. On the other hand, if ∆v is odd, the integrand will belong to A
1' and the integral will
be different from zero. From these symmetry considerations it has to be concluded that transitions involving odd Av values should be strongly favoured, in agreement with the experimental observations.
Two remarks are worth a short discussion. First, in the harmonic approximation, Av will be limited to - 1, owing to the specific properties of the Hermite polynomials [ 32 ]. In the present work Av values up to — 9 are observed. This is most probably due to the strong anharmonicity of the potential energy surface of NH3
+
(X~2A1) (see section 4.1), which will manifest itself especially when high v autoionizing levels (up to v=21) are
involved (see tables 3-6). Secondly, it can be argued that the abovementioned reasoning is only valid if δ varies linearly with Q. Taking into account the quadratic contribution would allow autoionizing transitions involving even ∆v values. The fact that such transitions are weaker in the present case (see table 8 ), tends to support that the quadratic term is less significant than the linear one. It should also be mentioned that, even in the harmonic approximation, higher-order effects can produce small couplings for any Av value. Although such effects have been observed by Dehmer and Chupka [33], they are generally much weaker than the first-order effects.
The differences in the intensity distribution observed in the autoionization spectrum of the four is-otopomers have been discussed and justified only in terms of the ∆v-parity: however, the isotope effect has explicitly not been considered. This effect could act through the photodissociation of the superexcited states, and has therefore to be considered.
This phenomenon has been investigated in NH3 [9,10]. In the range of interest in this work, the main
dissociation channel is NH+H2. The fluorescence corresponding to NH(c1Π, b1Σ+, a1∆) has been observed up to
11.3 eV [10]. The rate constant would be expected to be dependent upon isotopic substitution and photodecomposition could compete with autoionization.
The involved Rydberg states differ from one isotopomer to the other. When the same superexcited states are involved, e.g. in NH3 and ND3, the ∆v propensity rule is operative. Furthermore, no symmetry restriction exists
between the initial Rydberg states and final states of the abovementioned dissociation products. More detailed experimental data are needed to investigate these phenomena.
Conclusions
The photoionization efficiency curves of NH3, NH2D, NHD2 and ND3 have been recorded in the
9.7-11.8 eV photon energy range. The detailed investigation of these curves allowed us to suggest a value of the adiabatic ionization energy of the ground ionic state. The corresponding ωe and ωexe values, associated with the
long v2 bending mode vibrational progression observed in the yield curves, are deduced for the four species.
Within experimental error, good agreement is found between the present experimental results and predicted values for these molecular constants. For NH3 and ND3 the results compare very well with photoelectron
spectroscopic data.
An abundant autoionization structure is superposed on the ionization continuum. This structure markedly changes with isotopic substitution. It has been analyzed in terms of Rydberg series converging to the first ionization limit. Each series is characterized by a long vibrational (v2 bending mode) progression. Only in
the case of NH3 a comparison could be made with previous photoabsorption and electron energy-loss
spectroscopic data. Energies and wave-numbers are in satisfactory agreement.
These Rydberg states autoionize vibrationally. A close correlation is observed between the parity of the vibrational transition Av and the intensity of the corresponding autoionization process. To odd ∆v's correspond the strongest intensities. These observations can be accounted for by symmetry considerations applied to vibrational autoionization theory.
Though not discussed in detail in this work, an isotope effect on the relative intensities of the Rydberg states through their photodissociation into neutral fragments, e.g. NH(D)+H2(HD, D2), has to be expected.
Acknowledgement
The financial support of the Bundesministerium fur Forschung und Technologie, the Belgian Government (ARC-contract) and the Fonds National de la Recherche Scientifique (FNRS) is gratefully acknowledged. We are indebted to H.W. Jochims for his valuable assistance. One of us (HB) wishes to thank the Commissariat Général aux Relations Extérieures de la Communauté Française de Belgique for travel grants. RL wishes to acknowledge the European Community for a grant.
References
[1] A.B.F. Duncan, Phys. Rev. 47 (1935) 822; A.B.F. Duncan and A.E. Douglas, Phys. Rev. 49 (1936) 211.
[2] A.E. Douglas and J.M. Hollas, Can. J. Phys. 39 (1961) 479; A.E. Douglas, Discussions Faraday Soc. 35 (1963 ) 158. [3] K. Watanabe and S.P. Sood, Sci. Light (Tokyo) 14 (1965)36.
[4] A.D. Walsh and P.A. Warsop, Trans. Faraday Soc. 57 (1961) 345.
[5] J.H. Glownia, S.J. Riley, S.D. Colson and G.C. Nieman, J. Chem. Phys. 73 (1980) 4296.
[6] V. Vaida, W. Hess and J.L. Roebber, J. Phys. Chem. 88 (1984) 3397; V. Vaida, M.I. McCarthy, P.C. Engelking, P. Rosmus, H.W. Werner and P. Botschwina, J. Chem. Phys. 86 (1987) 6669.
[7] W.R. Harschbarger, J. Chem. Phys. 54 (1971 ) 2504.
[8] M. Furlan, M.J. Hubin-Franskin, J. Delwiche, D. Roy and J.E. Collin, J. Chem. Phys. 82 (1985) 1797. [9] H. Okabe, Photochemistry of Small Molecules (Wiley, New York, 1978).
[10] M. Suto and L.C. Lee, J. Chem. Phys. 78 (1983) 4515.
[12] R. Locht, Ch. Servais, M. Ligot, M. Davister and J. Momigny, Chem. Phys. 125 (1988) 425; R. Locht, Ch. Servais, M. Ligot, F. Derwa and J. Momigny, Chem. Phys. 123 (1988) 443; R. Locht and J. Momigny, Chem. Phys. 127 (1988) 425.
[13] R. Locht, W. Denzer, G. Hagenow and H. Baumgärtel, to be published.
[14] J. Berkowitz, Photoabsorption, Photoionization and Photoelectron Spectroscopy (Academic Press, New York, 1979). [15] K. Rademann, H.W. Jochims and H. Baumgärtel, J. Phys. Chem. 89 (1985) 3459.
[16] J. Rabalais, L. Karlsson, L.O. Werme, T. Bergmark and K. Siegbanh, J. Chem. Phys. 58 (1973) 3370. [17] M.J. Weiss, G.W. Lawrence, J. Chem. Phys. 53 (1970) 214.
[18] G. Herzberg, Molecular Spectra and Molecular Structure. I. Spectra of Diatomic Molecules (Van Nostrand, Princeton, 1967). [19] G. Herzberg, Molecular Spectra and Molecular Structure. II. Infrared and Raman Spectra (Van Nostrand, Princeton, 1945). [20] H. Ågren, I. Reineck, H. Veenhuizen, R. Maripuu, R. Arneberg and L. Karlsson, Mol. Phys. 45 (1982) 477.
[21] P. Botschwina, Ion and Cluster Ion Spectroscopy and Structure, ed. J.P. Maier (Elsevier, Amsterdam, 1989) p. 83.
[22] G. Herzberg, Molecular Spectra and Molecular Structure. III. Electronic Spectra and Electronic Structure of Polyatomic Molecules (Van Nostrand, Princeton, 1967).
[23] G.R. Wright and C.E. Brion, J. Electron Spectrosc. & Relat. Phenom.4 (1974) 25.
[24] Y. Ono, S.H. Linn, H.F. Prest, C.Y. Ng and E. Miescher, J. Chem. Phys. 73 (1980) 4855. [25] Y. Ono, E.A. Osuch and C.Y. Ng, J. Chem. Phys. 76 (1982) 3905.
[26] W.A. Chupka and J. Berkowitz, J. Chem. Phys. 51 (1969) 4244. [27] J. Berkowitz and J.P. Greene, J. Chem. Phys. 81 (1984) 4328.
[28] T.M. Dunn, Studies in Chemical Structure and Reactivity, ed. J.H. Ridd (Methuen, London, 1966). [29] G. Herzberg and Ch. Jungen, J. Mol. Spectry. 41 (1972) 425.
[30] H. Lefebvre-Brion and R.W. Field, Perturbations in the Spectra of Diatomic Molecules (Academic Press, New York, 1986). [31] Ch. Jungen and D. Dill, J. Chem. Phys. 73 (1980) 3338.
[32] E.B. Wilson, J.C. Decius and P.C. Cross, Molecular Vibrations (Dover, New York, 1983) Appendix III. [33] P.M. Dehmer and W.A. Chupka, J. Chem. Phys. 65 (1976) 2243.