HAL Id: hal-00301361
https://hal.archives-ouvertes.fr/hal-00301361
Submitted on 10 Nov 2003HAL is a multi-disciplinary open access
archive for the deposit and dissemination of sci-entific research documents, whether they are pub-lished or not. The documents may come from teaching and research institutions in France or abroad, or from public or private research centers.
L’archive ouverte pluridisciplinaire HAL, est destinée au dépôt et à la diffusion de documents scientifiques de niveau recherche, publiés ou non, émanant des établissements d’enseignement et de recherche français ou étrangers, des laboratoires publics ou privés.
Saharan dust events at the Jungfraujoch: detection by
wavelength dependence of the single scattering albedo
and analysis of the events during the years 2001 and
2002
M. Collaud Coen, E. Weingartner, D. Schaub, C. Hueglin, C. Corrigan, M.
Schwikowski, Urs Baltensperger
To cite this version:
M. Collaud Coen, E. Weingartner, D. Schaub, C. Hueglin, C. Corrigan, et al.. Saharan dust events at the Jungfraujoch: detection by wavelength dependence of the single scattering albedo and analysis of the events during the years 2001 and 2002. Atmospheric Chemistry and Physics Discussions, European Geosciences Union, 2003, 3 (6), pp.5547-5594. �hal-00301361�
ACPD
3, 5547–5594, 2003Saharan dust events at the Jungfraujoch
M. Collaud Coen et al.
Title Page Abstract Introduction Conclusions References Tables Figures J I J I Back Close
Full Screen / Esc
Print Version Interactive Discussion
© EGU 2003 Atmos. Chem. Phys. Discuss., 3, 5547–5594, 2003
www.atmos-chem-phys.org/acpd/3/5547/ © European Geosciences Union 2003
Atmospheric Chemistry and Physics Discussions
Saharan dust events at the Jungfraujoch:
detection by wavelength dependence of
the single scattering albedo and analysis
of the events during the years 2001 and
2002
M. Collaud Coen1, E. Weingartner2, D. Schaub3, C. Hueglin3, C. Corrigan2, M. Schwikowski4, and U. Baltensperger2
1
MeteoSwiss, Aerological Station, Les Invuardes, CH-1530 Payerne, Switzerland
2
Laboratory of Atmospheric Chemistry, Paul Scherrer Institut, CH-5232 Villigen PSI, Switzerland
3
Swiss Federal Laboratories for Materials Testing and Research, ¨Uberlandstrasse 129, CH-8600 D ¨ubendorf, Switzerland
4
Laboratory of Radio- and Environmental Chemistry, Paul Scherrer Institut, CH-5232 Villigen PSI, Switzerland
Received: 25 September 2003 – Accepted: 30 October 2003 – Published: 10 November 2003 Correspondence to: M. Collaud Coen ([email protected])
ACPD
3, 5547–5594, 2003Saharan dust events at the Jungfraujoch
M. Collaud Coen et al.
Title Page Abstract Introduction Conclusions References Tables Figures J I J I Back Close
Full Screen / Esc
Print Version Interactive Discussion
© EGU 2003
Abstract
Scattering and absorption coefficients have been measured continuously at several wavelengths since March 2001 at the high altitude site Jungfraujoch (3580 m a.s.l.). From these data, the wavelength dependences of the ˚Angstr ¨om exponent and partic-ularly of the single scattering albedo are determined. While the exponent of the single
5
scattering albedo is usually positive, it becomes negative during Saharan dust events (SDE) due to the greater size of the mineral aerosols and to their different chemical composition. This change in the sign of the single scattering exponent turns out to be a simple means for detecting Saharan dust events. The occurrence of SDE detected by this new method was largely confirmed by visual inspection of filter colors and by
10
studying long-range back-trajectories. An examination of SDE over a 22 months period shows that SDE are more frequent during the March-June period as well as during Oc-tober and November. The trajectory analysis indicated a mean traveling time of 96.5 h with the most important source countries situated in the northern and north-western part of the Saharan desert. Most of the SDE do not lead to a detectable increase of
15
the 48 h total suspended particulate matter (TSP) at the Jungfraujoch. During Saharan dust events, the average contribution of this dust to hourly TSP at the JFJ is 16 µg/m3, which corresponds to an annual mean of 0.8 µg/m3or 24% of TSP.
1. Introduction
Deserts are a major sources of aerosol injected into the atmosphere, with mineral
20
dust comprising more than 35% of the emitted primary aerosol mass (Houghton et al., 2001). Half of this emitted amount is attributed to the Saharan desert and influences the aerosol loading of Africa, the Atlantic Ocean, South America, the East coast of USA, and Europe. Though poorly quantified, the impact of mineral dust on global ra-diative forcing is expected to be negative. Sources of rara-diative forcing uncertainties are
25
ACPD
3, 5547–5594, 2003Saharan dust events at the Jungfraujoch
M. Collaud Coen et al.
Title Page Abstract Introduction Conclusions References Tables Figures J I J I Back Close
Full Screen / Esc
Print Version Interactive Discussion
© EGU 2003 a function of wavelength (Sokolik and Toon, 1999), and their spatial, vertical and
tem-poral distribution. In addition to its impact on radiative forcing, mineral dust influences the local rain/snow acidity and marine biochemical processes. Furthermore, harmful health effects due to elevated concentrations of total suspended particles (TSP) are also important and have been estimated in several studies (Avila et al., 1997;
Ro-5
driguez et al., 2001; Delmas et al., 1996; Prospero et al., 2002).
While most of the Saharan dust is transported westward and southward (about 60%) by the Saharan Air Layer (SAL) and by lower layer transport in trade winds (Chiapello et al., 1997, Afeti and Resch, 2000), a non negligible amount reaches Europe. D’Almeida (1986) estimated the Saharan dust transport to Europe to be 80–120 Mt/yr. In southern
10
Europe, Saharan dust events (SDE) can induce up to 20 daily exceedances of the PM10 standard per year (Rodriguez et al., 2001). In northern countries, the influence of SDE is less prominant, but also less understood. Studies performed in the Alps (Delmas et al., 1996; Schwikowski et al., 1995; Nickus at al., 1997; De Angelis and Gaudichet, 1991; Maupetit and Davies, 1991; Wagenbach and Geis, 1989), as well
15
as in England (Ryall et al., 2002) have pointed out the frequent occurrence of SDE resulting in an annual mean deposition of 0.4 to 1 g m−2. In Switzerland, Schwikowski et al. (1995) analyzed the characteristics of a particular SDE in 1990 at the Jungfraujoch. To obtain a global view of the effect of mineral dust in Europe, it is however necessary to study the occurrence of SDE over long periods of time and trace their contribution to
20
exceedances of the PM10 and TSP standards.
Trends of SDE in Europe have previously been evaluated by red rain, or snow and ice dust content. While aerosol trapped in snow or ice may also originate from dry deposi-tion, a red rain analysis takes into account only wet deposition. In all these cases, the importance of mineral dust in ambient air can not reliably be estimated. Some studies
25
evaluate the TSP and PM10 data and correlate them with chemical analysis and back trajectories to identify the source regions. Analysis of several years of data is also cur-rently available with satellite measurements (Prospero et al., 2002). Other methods to identify Saharan dust include measurements of size distribution, granulometry, Lidar,
ACPD
3, 5547–5594, 2003Saharan dust events at the Jungfraujoch
M. Collaud Coen et al.
Title Page Abstract Introduction Conclusions References Tables Figures J I J I Back Close
Full Screen / Esc
Print Version Interactive Discussion
© EGU 2003 aerosol optical depth (AOD) and the ˚Angstr ¨om parameter deduced from nephelometer
or photometer measurements.
In this study, we evaluate a new SDE detection method, which is based on the in-vestigation of the wavelength dependence of the single scattering albedo (SSA). The wavelength dependence of the scattering and absorption coefficients, and therefore of
5
the single scattering albedo, and the ˚Angstr ¨om parameter allows for the identification of characteristic features associated with SDE. The SDE identified by the SSA exponent method are correlated with visual inspection of filter color and with back trajectories to identify the source regions. The analysis is based on measurements performed between March 2001 and December 2002 at the high-alpine research station of the
10
Jungfraujoch. An annual frequency and source frequency climatology analysis of this nearly two year record is also performed, as well as an estimation of the Saharan dust contribution to annual and hourly TSP.
2. Experimental
Continuous measurements of a number of aerosols parameters have been performed
15
since 1995 at the Global Atmospheric Watch (GAW) laboratory of the high alpine re-search station Jungfraujoch (JFJ, 3580 m a.s.l., 46◦330, 7◦590), which is located on a mountain crest on the northern edge of the Swiss Alps. The JFJ is prevalently situated in the free troposphere, but is influenced by convection of planetary boundary layer air during the warmer months (Baltenperger et al., 1997, Lugauer et al., 1998).
Conse-20
quently all the measured aerosol parameters show a clear annual cycle with maximum values in July and August and minimum values in the November-January period. Ex-cept during the winter months, a diurnal cycle often exists as a result of the mixing of planetary boundary layer aerosol into the free troposphere air during the afternoon.
MeteoSwiss measurements during the last 20 years shows that the mean monthly
25
temperature at the Jungfraujoch varies from 0◦C (July to August) to −13◦C (January to February), the relative humidity (RH) from 64% (January) to 79% (May), and the mean
ACPD
3, 5547–5594, 2003Saharan dust events at the Jungfraujoch
M. Collaud Coen et al.
Title Page Abstract Introduction Conclusions References Tables Figures J I J I Back Close
Full Screen / Esc
Print Version Interactive Discussion
© EGU 2003 barometric pressure is 663 mbar. The wind direction at the site is influenced by the
NE-SW orientation of the local alpine watershed in the immediate vicinity, resulting in an average annual wind frequency of 60% from NW and 30% from SE.
The total aerosol is sampled by a heated inlet (+25◦C) designed to evaporate all cloud droplets at an early stage of the sampling process. Calculations for this set-up
5
showed that cloud droplets smaller than 40 µm can be sampled at a wind speed of 20 m s−1 (Weingartner et al., 1999). During cloud events, the total sample thus con-sists of dried particles that were activated to cloud droplets as well as the inactivated (interstitial) particles.
The total and backward scattering coefficients (σsp and σbsp) are simultaneously
10
measured at three wavelengths (λ= 450, 550, and 700 nm) by an integrating neph-elometer (IN,TSI 3563). Data are collected with 5 min resolution from which hourly means are calculated. The scattering coefficients were corrected for the truncation er-ror according to the method defined by Anderson and Ogren (1998), which takes into account the scattering exponent from the uncorrected scattering coefficient to calculate
15
the appropriate correction factor for each wavelength.
The absorption coefficient (σap) was measured at seven wavelengths (λ= 370, 470, 520, 590, 660, 880 and 950 nm) by an aethalometer (AE-31, Magee Scientific). σap was calculated with Eq. (1) (Weingartner et al., 2003):
σabs = A Q· ∆AT N ∆t · 1 C (1) 20
where A is the filter spot area, Q the volumetric flow rate and∆AT N is the change in attenuation during the time interval∆t, and C = 2.15 is an empirical correction factor, which corrects for the enhancement of the optical path in the filter due to multiple reflections of the light beam at the filter fibers. The empirical C factor used in this study was determined using different aerosol types such as soot particles generated
25
by spark discharge, Diesel soot particles and externally mixed Diesel and (NH4)2SO4 particles at 450 nm and 660 nm (Weingartner at al., 2003). Aethalometer data were collected with a 10 min resolution from which hourly means were calculated. All times
ACPD
3, 5547–5594, 2003Saharan dust events at the Jungfraujoch
M. Collaud Coen et al.
Title Page Abstract Introduction Conclusions References Tables Figures J I J I Back Close
Full Screen / Esc
Print Version Interactive Discussion
© EGU 2003 are given as local standard time LST (equal to UTC +1). The measurements were
performed at room temperature (25 ± 4◦C), which corresponded to RH≤10%. As a result, the measured scattering and absorption coefficients, as well as the calculated single scattering albedo and ˚Angstr ¨om exponent, are related to the dried aerosols, and not to ambient outdoors aerosols.
5
During the CLACE 1 (Cloud and Aerosol Characterization Experiment) campaign in February and March 2000, a particle soot/absorption photometer (PSAP, Radiance Research) (Reid at al., 1998) was operated in parallel with a prototype of the spectrum aethalometer (AE30) measuring at 7 wavelengths. The comparison of both measured absorption coefficients was performed by a linear regression on a log-log plot. The
10
choice of a log-log plot was based on the log-normal distributions of both instrument datasets. The daily means of the AE30 σap at 590 nm as a function of the PSAP σap at 565 nm are best fitted (R2 = 0.96) with a slope of 1.25, with the PSAP data being systematically greater than the AE30 ones.
This is in line with a calibration work by Bond et al. (1999) showing that the usually
15
applied PSAP correction overestimates the true absorption coefficient by about 20– 30%. The correlation between both instruments is therefore very good after accounting for the constant slight overestimation of the PSAP.
To calculate the single scattering albedo, the scattering coefficients measured at three wavelengths are first fitted with a wavelength power-law dependence:
20
σsp= bsp· λ−αSP, (2)
which allows for the determination of the scattering exponent αsp. The scattering co-efficient is then evaluated at the seven absorption coefficient wavelengths. The single scattering albedo is calculated at these seven wavelengths and the evaluated single scattering albedo values are then fitted with a similar wavelength power-law to obtain
25
the single scattering albedo exponent αSSA. A similar procedure results in the extinc-tion coefficients at seven wavelengths, and the ˚Angstr¨om exponent ˚a, which describes extinction coefficient wavelength dependence. A wavelength power-law fit of the
ab-ACPD
3, 5547–5594, 2003Saharan dust events at the Jungfraujoch
M. Collaud Coen et al.
Title Page Abstract Introduction Conclusions References Tables Figures J I J I Back Close
Full Screen / Esc
Print Version Interactive Discussion
© EGU 2003 sorption coefficients produces the absorption exponent αap.
Analyzed wind fields with a temporal separation of 6 h were used to calculate three dimensional kinematic backward trajectories with the software package “Lagranto” (Wernli and Davies, 1997). The wind fields were provided by the European Centre for Medium-Range Weather Forecasts (ECMWF) model with a resolution of 1◦ × 1◦.
5
The trajectories were resolved in 60-min time steps and their length was limited to 10 days backward in time. In order to account for transport at different altitudes and also for random deviations, the arrival points were varied both horizontally and vertically. In the horizontal dimension, the accurate location of the Jungfraujoch (46.330N, 7.590E) was supplemented by 4 arrival points being displaced by ±0.5◦ in latitude and ±0.5◦ in
10
longitude, respectively. In the vertical dimension, the levels at 650 hPa (which is close to the annual mean pressure at Jungfraujoch), as well as 700, 750 and 800 hPa were examined. Although 20 trajectories were calculated in total for each case, only trajec-tories indicating paths of air masses potentially contributing to the measured Saharan dust episode are shown in the figures. This criterion was chosen to take into account
15
only those trajectories that include at least one time step within a 150 hPa deep layer over the African continent.
The contribution of Saharan dust to the TSP mass concentration at the JFJ was es-timated using 48-hour filter samples of total suspended particles (TSP) collected at the JFJ by the Swiss national air pollution monitoring network (NABEL). The TSP
sam-20
ples were collected with of a high volume sampler, and the filters were automatically changed at midnight of every second day.
For chemical characterization aerosol samples were collected in two size classes (TSP and particles with an aerodynamic diameter D < 1 µm (PM1)). The upper four stages of a cascade impactor (Maenhaut et al., 1996) allowed for a cut-off of 1 µm
25
with a constant flow rate of 11 L min−1. The chemical composition of soluble ions was then obtained by ion chromatographic analysis. A detailed description of this chemical analysis was published by Henning et al. (2002).
ACPD
3, 5547–5594, 2003Saharan dust events at the Jungfraujoch
M. Collaud Coen et al.
Title Page Abstract Introduction Conclusions References Tables Figures J I J I Back Close
Full Screen / Esc
Print Version Interactive Discussion
© EGU 2003
3. Results and discussion
3.1. Determination of the SDE events by the wavelength dependence of the single scattering albedo
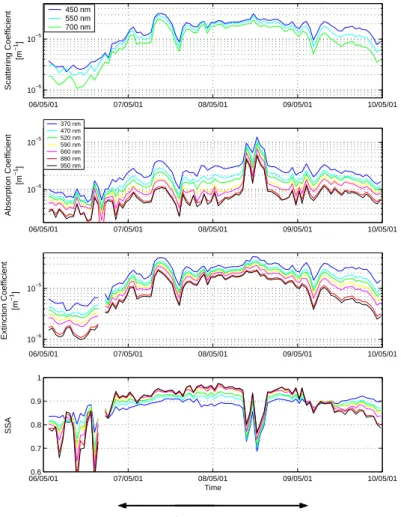
Figure 1 presents the scattering, absorption, and extinction coefficients as well as the single scattering albedo, for a individual spring SDE. The scattering coefficient is
char-5
acterized by higher σsp values as well as by a considerably smaller wavelength de-pendence during the SDE. An increase is also observed for the absorption coefficient, however the shift is smaller than the one seen for σsp. The wavelength dependence of the absorption coefficient has a tendency to increase during SDE. As expected, the extinction coefficient has a similar behaviour as the scattering coefficient, with a
de-10
crease of the wavelength dependence and an increase in intensity. The SSA values become higher for all wavelengths, and show a clear wavelength inversion between 6 May 2001, 18:00 LTC and 9 May 2001, 03:00 LTC, with greater values for longer wavelengths. As it will be shown later, the inversion of wavelength dependence can be attributed to the presence of Saharan dust and provides a method for detecting the
15
occurrence of SDE.
The presented extinction coefficient is calculated from the measured scattering and absorption coefficients and its wavelength dependence produces the well-known
˚
Angstr ¨om exponent ˚a:
σext= σsp+ σap = bext· λ− ˚a. (3)
20
The single scattering albedo ω0 corresponds to the scattering part of the extinction coefficient. As both the scattering and the extinction coefficients can be fitted with a wavelength power-law dependence, the SSA can also be fitted in a similar way:
ω0= σsp/σext= bSSA· λ−αSSA = b
SSA· λ−(αSP− ˚a), (4)
so that the SSA exponent is the difference between the scattering and the ˚Angstr¨om
25
ACPD
3, 5547–5594, 2003Saharan dust events at the Jungfraujoch
M. Collaud Coen et al.
Title Page Abstract Introduction Conclusions References Tables Figures J I J I Back Close
Full Screen / Esc
Print Version Interactive Discussion
© EGU 2003 wavelength fits well with the data.
For aerosols that do not contain large particles, the scattering coefficient usually de-creases more rapidly with increasing wavelength than the absorption coefficient. As a result, αsp is greater than ˚a and αSSA remains positive. Conversely, when coarse particles are present, the scattering becomes dominated by geometrical optics, so that
5
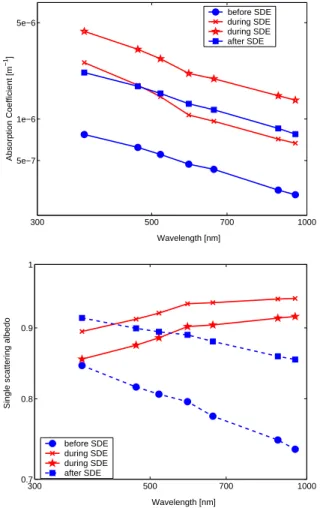
a wavelength independence of the scattering coefficient is expected (Seinfeld and Pan-dis, 1998) and can be seen in our measurements of mineral aerosols. The exponent of the absorption coefficient (αap) is usually estimated to stay constant at 1–1.2, but we actually measured an increase of the absorption wavelength dependence (Fig. 2a). The ˚Angstr ¨om exponent ˚a will therefore approach zero less rapidly than αsp, which
10
results in a negative αSSAduring SDE.
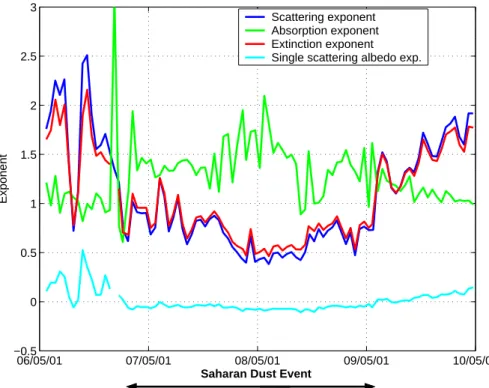
The wavelength dependence can be better visualized in Fig. 3, where the exponents of all parameters are reported for the same time period. The values of αspand ˚a are
usually measured to be between 1 and 2.5. During the SDE they are clearly shifted below 1, and most of the time below 0.5. At the same time, αap increases up to 1.5,
15
which is higher than its normal value of about 1. Consequently, the resulting αSSA becomes clearly negative during SDE with values usually falling between −0.1 and −0.5. In this study, SDE are defined as time periods that exhibit negative αSSA for
more than 3 h.
The possible identification of mineral dust events by αSSA values was conceived
20
using theoretical considerations (Bergstrom et al., 2002). The absorption coefficient measured using the integrating sandwich method during the Tropical Aerosol Radia-tive Forcing Observational Experiment (TARFOX) at the Eastern coast of the United State shows an approximate λ−1 variation between 0.4 and 1.0 µm, but with a quicker decrease between 0.4 and 0.6 µm and a leveling off at longer wavelengths. As can
25
be seen in Fig. 2a, a continuous decrease of the absorption coefficient as a function of the wavelength was also observed at the Jungfraujoch over the whole measured range (370–950 nm). This continuous decrease is observed regardless of the pres-ence of Saharan dust, but dust events do have an effect on the slope. In addition,
ACPD
3, 5547–5594, 2003Saharan dust events at the Jungfraujoch
M. Collaud Coen et al.
Title Page Abstract Introduction Conclusions References Tables Figures J I J I Back Close
Full Screen / Esc
Print Version Interactive Discussion
© EGU 2003 the value of αap is higher during SDE. This greater wavelength dependence can be
explained by the change in the chemical composition of the aerosols. About 89% of the mass of Saharan dust is composed of illite, kaolinite and montmorillonite minerals (Sokolik and Toon, 1999), as well as of hematite (Quijano et al., 2000). Hematite (a strong absorber at solar wavelengths) aggregated with the other three clay materials
5
(relatively transparent at solar wavelengths) results in a generally greater absorption, particularly at shorter wavelengths. Table 1 gives the exponents of the power-law fit when only the lowest four or highest four wavelengths of the aethalometer are taken into account. Both slopes are nearly identical, giving a value close to 1 for days without SDE. When mineral dust is present, the fit of the lowest four wavelengths exhibits far
10
higher exponent values (1.5–1.8).
The inversion of the SSA wavelength dependence was also calculated for several mineral dust species and for various sizes (Sokolik and Toon, 1999). They simulated the spectral behavior of illite, kaolinite and montmorillonite dusts with diameters be-tween 0.25 and 0.7 µm and obtained a sharp increase in the SSA for wavelengths
15
between 0.2 and 0.6 µm. In addition, the results showed a constant plateau for longer wavelengths. In contrast, hematite shows a completely different spectral behavior, with a slightly decreasing SSA up to 0.6 µm and a strong increase above 0.6 µm. The SSA wavelength dependence observed during mineral dust events at the JFJ, as seen in Fig. 2b and Table 2, presents a more negative slope between 0.37 and 0.6 µm than for
20
longer wavelengths. Comparing this behavior to the predictions by Sokolik and Toon (1999), we can attribute the strong increase at shorter wavelengths to illite, kaolinite and montmorillonite, and the second slighter increase to hematite, which shows in this domain a strong wavelength dependence even thought it constitutes a relatively small fraction of the total Saharan dust mass.
25
An SSA behavior similar to that observed at the JFJ has been measured in the Persian Gulf by Smirnov et al. (2002). A wavelength independence or a slight increase of the SSA with wavelength was observed in data obtained from ground-based sun/sky radiometers. In this case however, only a very small increase was visible in the monthly
ACPD
3, 5547–5594, 2003Saharan dust events at the Jungfraujoch
M. Collaud Coen et al.
Title Page Abstract Introduction Conclusions References Tables Figures J I J I Back Close
Full Screen / Esc
Print Version Interactive Discussion
© EGU 2003 mean SSA for May 1999. This virtual wavelength independence is closely correlated
with low ˚Angstr ¨om exponents (0.4–0.7) and corresponds to the seasonal period with the highest mineral dust concentration.
As mentioned in the experimental part, operational measurements at the JFJ are performed on dry aerosols. Thus the SSA absolute magnitude of the ambient
(out-5
door) aerosol will usually be higher than the measured one due to the absence of liquid water on the particles. On the other hand, the effect of the water content on the wavelength dependence is expected to be less important for a number of reasons. First the negative value of αSSA arises principally from the wavelength independence of σsp which is due to the dominance of the large aerosol particles. As the diameter
10
of particles becomes larger with enhanced humidity, a similar σsp spectral behavior will be measured for wet mineral dust. In some cases, smaller dry aerosol particles, which are currently not detected as SDE, could exhibit a wavelength independent scat-tering coefficient if ambient relative humidity is high enough to allow significant water uptake. Secondly, hygroscopic growth factors are smaller for SDE particles than for
15
the common JFJ aerosol (Weingartner et al., 2002). Third, it has been shown that the wavelength dependence of the absorption coefficient is very similar in the 0.45–1.0 µm region for externally mixed, internally mixed and shell-core configurations of BC (Ja-cobson, 2000). Since the aerosol reaching the JFJ is aged and therefore internally mixed, αap will probably exhibit only a slight variation with humidity. Consequently,
al-20
though all the measurements are performed on dried aerosols, the sign of αSSA can still be used to identify SDE at the Jungfraujoch with a time resolution of 1 h.
As can be seen in Fig. 2b and Table 2, the SSA exponent of the first four shorter wavelengths is consistently more negative than the exponent of the four longer wave-lengths. This allows the estimation of a fitting error on the whole measured wavelength
25
range. The αSSAdifference between the shorter and longer wavelength sets is typically ≤0.1. Using only some of the wavelengths may therefore change the SDE limits by a few hours, but does not yield a false SDE detection.
ACPD
3, 5547–5594, 2003Saharan dust events at the Jungfraujoch
M. Collaud Coen et al.
Title Page Abstract Introduction Conclusions References Tables Figures J I J I Back Close
Full Screen / Esc
Print Version Interactive Discussion
© EGU 2003 3.2. Influence of Saharan dust events on all exponents
The SDE described in the previous paragraph is a typical one, where all parameters ex-hibit clear modifications compared to normal conditions. Nonetheless, some detected SDE are less pronounced or do not present all of the previously described features. Table 3 gives the percentage of events where the measured optical coefficients and all
5
the derived parameters were modified by SDE. The 100% corresponds to all the cases detected by a negative αssalonger than 3 h.
SDE induce a decrease of αspin 80% of all cases. αspis therefore the second most efficient parameter to detect the presence of mineral dust. SDE are associated 60% of the time with a obvious increase of the σspduring a part or the whole of the Saharan
10
dust event. Usually, αspvalues fall between 0.5 and 1 during SDE, yet negative values are also occasionally observed. In these cases, the observed increase of the scattering coefficient with increasing wavelength (1 · 10−7 to 5 · 10−6m−1) is clearly greater than the measurement uncertainties (5 · 10−8m−1).
An increase of αap is observed in less than half of the SDE (42%), and higher σap
15
values are seen in 47% of all cases. These changes of αap and σap happen for both short and long dust events without distinction. No correlation with aerosol travel time or with source regions was found. If enough black carbon is mixed with the mineral dust, the measured wavelength dependence can be dominated by black carbon, and the mineral dust features disappear. The changes of the absorption coefficient and its
20
wavelength dependence during SDE are therefore less frequent and are not considered very useful as an identification tool.
As expected, the ˚Angstr ¨om exponent decreases for most of the SDE cases, due to the large size of dust particles. Values between 0 and 1 are usually measured for dried mineral aerosols, but negative values also occurred. These values correspond well
25
with the ˚Angstr ¨om exponents measured in the presence of mineral dust (Takemura, 2002, Smirnov, 2001). Sokolik and Toon (1999) calculated the extinction coefficient for 0.5 and 0.7 µm diameter aerosol of illite, kaolinite, montmorillonite, hematite, quartz,
ACPD
3, 5547–5594, 2003Saharan dust events at the Jungfraujoch
M. Collaud Coen et al.
Title Page Abstract Introduction Conclusions References Tables Figures J I J I Back Close
Full Screen / Esc
Print Version Interactive Discussion
© EGU 2003 calcite and gypsum and found a continuously increase with respect to wavelength for
all mineral dust types between 0.2 and at least 1 µm. This findings result in a negative ˚
Angstr ¨om exponent for these aerosols in this wavelength range. Some photometer measurements have also shown negative ˚Angstr ¨om exponents (Holben at al., 2003). 3.3. Validity of SDE detection by negative αSSA: comparison with filter color and
back-5
trajectory analysis
To be sure that the inversion of the wavelength dependence of the single scattering albedo corresponds to an SDE, the color of TSP filters from the Jungfraujoch and the 10 days back-trajectories (see Sect. 3.5) were studied and the results compared to our set of measurements. The TSP level at the Jungfraujoch remains very low during the
10
whole year, with daily annual means comprised between 3 and 5 µg/m3for the last 10 years (BUWAL, 2001). This low amount of aerosol allows for the identification of heavy SDE by a distinct brown-yellow deposit on the filters. The temporal resolution of these filters is 48 h, which is far worse than the resolution obtained with the SSA exponent.
An obvious coloration of the filter was observed for 57% of the SDE, while the color
15
was unresolved for 19% of the cases. For 7% of SDE, the filters were missing. There-fore, only 17% of the events detected by the αSSA method clearly showed no filter coloration. However, all these inconsistent dust events lasted only 4 to 6 h and were generally characterized as “disturbed” events, where even the wavelength dependence and to a lesser extent the coefficients themselves showed a high hourly variability.
20
These events appear to correspond to weak SDE, where the mineral dust mass is too small to modify the filter color. All but one of the events with unresolved filter coloration also correspond to relatively short SDE (4–12 h), even though some of these events present clear SDE features for all other parameters. Consequently, The filter coloration method is an acceptable means for validating the detection of SDE using the sign of
25
αSSA, but is far less sensitive since it has significant limitations with respect to SDE duration.
ACPD
3, 5547–5594, 2003Saharan dust events at the Jungfraujoch
M. Collaud Coen et al.
Title Page Abstract Introduction Conclusions References Tables Figures J I J I Back Close
Full Screen / Esc
Print Version Interactive Discussion
© EGU 2003 (αsp, σsp, αap, σap and particularly αSSA). For both cases the TSP mass was relatively
high. Back-trajectory analyses gave a positive result for one of these events, and a negative one for the other. Pollen contamination was dismissed as the cause of the filter coloration. The positive SSA exponent during these two SDE could possibly be explained by a smaller size of the Saharan dust.
5
In 71% of all cases, the 10-day back-trajectories were able to reveal the source of Saharan dust. Among the other 29% of cases, the trajectories did not pass over Africa and were often fairly dispersed. For one event, the back-trajectories passed far too high over Africa to catch Saharan dust.
Taking into account the trajectories and the filter color, 7% of the SDE are
con-10
firmed. For all the remaining cases, satellite pictures (http://www.nrlmry.navy.mil/ aerosol/satellite/seawifs/) of the 2–6 days before the detected SDE were visually in-spected. In 7%, a clear emission of Saharan dust towards Europe, usually towards Italy or Sardignia, was visible. In one case (2%), none of the former method was avail-able to confirm the event. Finally, only 8% of all cases remained unconfirmed by either
15
of the three methods. The negative single scattering albedo exponents can therefore without doubt be attributed to the occurrence of Saharan dust events. This new detec-tion method seems to be the most sensitive one first because of its hourly resoludetec-tion and secondly because the observed changes in optical properties can also be detected for small amounts of aerosol.
20
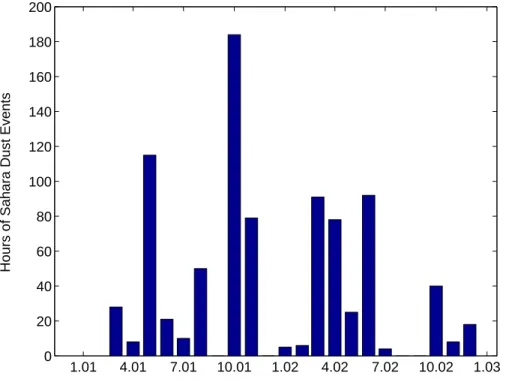
3.4. Climatology of SDE between March 2001 and December 2002
The estimation of the wavelength dependence of the single scattering albedo over a period of two years allows for a first analysis of the SDE climatology at the JFJ. Figure 4 presents the number of hours per month that Saharan dust was detected during the interval of March 2001–December 2002. Two distinct periods of high SDE probability
25
can be defined: one in spring from March to June and one in October and November. During the December-February period, the SDE are far less frequent, last only a few hours (maximal 6 h) and are often characterized with indistinct features (see Sect. 3.2).
ACPD
3, 5547–5594, 2003Saharan dust events at the Jungfraujoch
M. Collaud Coen et al.
Title Page Abstract Introduction Conclusions References Tables Figures J I J I Back Close
Full Screen / Esc
Print Version Interactive Discussion
© EGU 2003 Some occasional but quite intense cases occur in July and August, but none occurred
in September for both years. A particularly long period that comprised several SDE of multiple days occurred between 10 October and 22 November 2001. This specific event was also detected in England (Ryall et al., 2002) and in Germany (Mattis et al., 2002).
5
A two year average estimation of the length of the episodes for each month is given in Fig. 5. Again, one can clearly see that the majority of events lasting longer than 10 h occur during the March-June and October–November periods. Similarly, most events lasting longer than one day also take place during these two periods. All episodes recorded in winter are very short events, lasting only 4–6 h. Overall, 54% of the
10
recorded SDE lasted between 4 h and 10 h, 17% between 10 h and 24 h, and 29% were longer than one day.
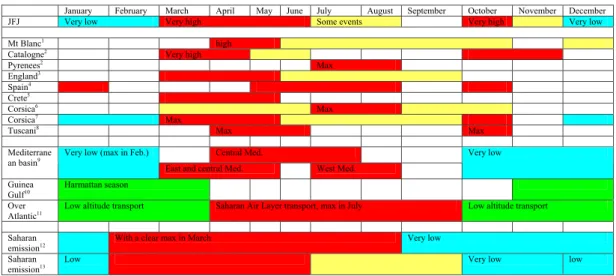
A non exhaustive comparison with other Saharan dust measurements collected in Europe, the Mediterranean basin, West Africa, and over the Atlantic Ocean is summa-rized in Table 4. Also included in the table is an estimation of the Saharan emission
15
that allows a rough correlation with the measurements at the JFJ. Most of the studies performed in Europe report a higher incidence of SDE and the greatest mineral dust deposition during spring with less frequent occurrences extending into July and August. SDE experience their highest intensity during summer only in Spain and in the central Pyrenees. Both behaviors can be explained by the study of Moulin et al. (1997) on the
20
Saharan dust transport modes in the Mediterranean basin. While most of the east and central Mediterranean SDE occur in the March–June period, the western part of Europe is mostly influenced by SDE during July and August. In this sense, the JFJ is mostly affected by the Saharan dust transports of the east and central Mediterranean and, to a much smaller extent, the transport from the west Mediterranean. During these spring
25
and summer periods, dust transport through the Saharan Air Layer (SAL) affects the whole Atlantic region. This phenomenon also induces the transport of Saharan dust to the JFJ from north-west direction.
ACPD
3, 5547–5594, 2003Saharan dust events at the Jungfraujoch
M. Collaud Coen et al.
Title Page Abstract Introduction Conclusions References Tables Figures J I J I Back Close
Full Screen / Esc
Print Version Interactive Discussion
© EGU 2003 December–February period also shows a very low amount of SDE across Europe,
ex-cept in Spain. During this period, the emission of Saharan dust is low and its transport occurs mostly through low altitude trade winds over West Africa (Harmattan season) and the Atlantic.
A high number of SDE in October and November is also observed in Catalogna and
5
as well as in Spain, Corsica, Tuscani, and Germany (L. Sch ¨utz, personal communica-tion), and to a smaller extent at the Mont-Blanc. For this time of the year the Saharan emissions are normally very low. The October 2001 case was probably a particularly intense event.
3.5. Back trajectories of the SDE
10
Generally, when transport over larger distances takes place, the air has been lifted up by a frontal system associated with conveyor belts to higher tropospheric levels. Bethan et al. (1998) used aircraft measurements of trace species near fronts and demonstrated that air, along with significant quantities of trace gases, can be lifted up from the bound-ary layer into the free troposphere by a warm conveyor belt associated with the frontal
15
system. The importance of frontal uplifting and subsequent long-range transport of trace gases was shown e.g. by Stohl and Trickl (1999). Quantitative results obtained from a numerical model showed that a frontal passage is able to transport more than 50% of a passive tracer released in the boundary layer to the free troposphere within 24 h (Donnell et al., 2001).
20
Typical travelling heights were investigated for all the calculated trajectories which confirmed a Saharan dust event by extracting the largest vertical distance of the tra-jectory from the ground in hPa (i.e. the pressure difference between trajectory height in hPa and the ground level in hPa). For all the cases the resulting uplift was between 250 and 550 hPa, which corresponds to heights of between 2500 and 6500 m a.s.l.,
re-25
spectively. The mean uplift was 375 hPa corresponding to about 3700 m above ground. When a frontal system and its associated conveyor belts induce an uplift, this can be seen in the vertical trajectory paths. In these cases the minimal travelling times of the
ACPD
3, 5547–5594, 2003Saharan dust events at the Jungfraujoch
M. Collaud Coen et al.
Title Page Abstract Introduction Conclusions References Tables Figures J I J I Back Close
Full Screen / Esc
Print Version Interactive Discussion
© EGU 2003 air masses containing Saharan dust particles can be straight.forwardly estimated as
the time between the start of the uplifting (after residing near-ground over the Sahara) and the arrival at the Jungfraujoch. This minimal travelling time has been estimated for the trajectories confirming a Saharan dust event. From 38 cases we calculated a mean travelling time of about 96.5 h. The shortest travelling times was found to be around
5
50 h. Short travelling times often occurred when low pressure systems approached Europe from a westerly direction with cold-fronts inducing a front-parallel acceleration from the Sahara towards the Alps. In such situations, South-Foehn events can occur and the air masses take a direct path over the Mediterranean and Spain or Italy to the Jungfraujoch (see e.g. the SDE on 7 May 2002 described below). On the other hand,
10
extremely long transport times of up to 8 days were also found (see e.g. the SDE on 28 March 2002 described below).
For each case confirming an event, a country was defined to be a potential source if the criterion given in the experimental section of this manuscript was fulfilled over the country. The most important source countries are shown in Fig. 6a, where the numbers
15
of events for which the criterion was fulfilled above the respective country are listed. As expected, the most important potential source countries are situated in the northern and north-western part of the Saharan desert with the most cases counted in Algeria (34 cases). In total 38 cases were investigated, which means that almost every SDE in Switzerland had at least a potential source region in Algeria. Figure 6b indicates
20
the numbers of trajectory segments (i.e. the hourly trajectory time steps) counted in a 0.75◦× 0.75◦ grid superimposed over the domain if the given criterion was fulfilled. Again, it can be seen that the north-north-western part of Africa with Morocco, Algeria, Tunisia, and Libya is the most important source region of the Saharan dust detected in Switzerland. Figure 7 shows the same numbers seasonally separated for March to
25
May (a), June to August (b), September to November (c) and December to February (d). It seems that during spring and summer, the sources are mostly located in the northern part of North and North-West Africa, whereas in autumn, the source regions are much more extended towards the south. A similar seasonal behaviour was found
ACPD
3, 5547–5594, 2003Saharan dust events at the Jungfraujoch
M. Collaud Coen et al.
Title Page Abstract Introduction Conclusions References Tables Figures J I J I Back Close
Full Screen / Esc
Print Version Interactive Discussion
© EGU 2003 by Propero et al. (2002) who showed that the most active dust source regions are
situ-ated more in North Africa during summer and move south-west during the September to January period. The numbers of cases in each season are too small to support these results by carrying out a proper statistical analysis. For example, only three cases were identified as confirming a SDE in the December to February period. Nevertheless, if
5
the meteorological transport conditions were the same throughout the year, one would expect more potential source regions in the south for the spring events since this pe-riod produced the highest number of cases. Therefore, we would suggest these weak source differences between seasons to be linked with different meteorological transport conditions or different activity of the source regions.
10
The direction of the air mass inflow to the Jungfraujoch was investigated by visual inspection of the trajectories and classifying them into the four sectors given in Table 5. Again, a statistical significance can not be given because of the relatively small number of cases. Nevertheless, as expected, the inflows from the two southern sectors are most important in all seasons. This air mass movement is often associated with low
15
pressure systems and their cold-fronts approaching Europe from the Atlantic. These weather patterns – often associated with South-Foehn events in the Alps – accelerate the air masses in front of the cold-front in northern direction towards the Jungfraujoch. Also, the north-western inflow is not unusual for SDE. In these cases, the air moves from the Sahara towards the Atlantic, turns to the north and flows towards the Alps with
20
prevailing westerly winds. Only two cases (5%) were found with an inflow direction from the north-eastern sector. In these cases, the air moves northward to higher latitudes before turning southward again and approaching the Jungfraujoch from north-east or east. These SDE also exhibited the longest traveling times of up to 8 days.
In the following section, three cases of Saharan dust transport to Switzerland are
25
ACPD
3, 5547–5594, 2003Saharan dust events at the Jungfraujoch
M. Collaud Coen et al.
Title Page Abstract Introduction Conclusions References Tables Figures J I J I Back Close
Full Screen / Esc
Print Version Interactive Discussion
© EGU 2003 3.5.1. SDE on 13 October 2001
A particularly long SDE occurred at the Jungfraujoch from 11 October 2001, 17:00 LTC to 18 October 2001, 13:00 LTC. This specially pronounced event during fall season was also detected by a LIDAR and a CIMEL sun photometer in Germany (M ¨uller et al., 2003). Figure 8 shows the trajectories arriving at the Jungfraujoch on 13 October 2001,
5
13:00 LTC. From 3 to 7 October, a flat pressure distribution prevailed over Africa and induced quite chaotic and relatively slow air mass movements over a large part of north-western Africa. During these days, an extremely strong low pressure system traveled over the Northern Atlantic and reached Western Europe on 7 October. Associated with this low pressure system, an extended cold-front reaching from Denmark to Morocco
10
moved south-eastward. This frontal system generated an air flow towards the northern direction. Together with an increasing velocity, the vertical trajectory paths in Fig. 8 indicate an uplift of the air masses up to 500 hPa pressure level which corresponds to about 5500 m a.s.l. During 8, 9 and 10 October, the strong pressure system moved slowly eastward over Great Britain to the North Sea. The cold-front passed over the
15
Alps and was divided into a cold-front north of the Alps further moving eastward and – together with an upcoming South-Foehn in the Alps – a warm front over the Alps. From 11 October on, a high pressure system installed over middle Europe and forced the air masses coming from the Sahara to subside and to turn clockwise to south-eastern flow direction before arriving at the Jungfraujoch.
20
3.5.2. SDE on 28 March 2002
Figure 9 shows the 10 day-backward trajectories of the air masses arriving at the Jungfraujoch on 28 March 2002, 13:00 LTC, and being representative of a SDE that lasted several days at the end of March 2001. This case is quite specific as the dust up-load takes place 8 to 10 days before arrival at the Jungfraujoch. The air masses started
25
over Algeria, Niger and Mauritania 10 days before arrival and moved relatively slowly in a clockwise motion around a high pressure system centered over Morocco. During
ACPD
3, 5547–5594, 2003Saharan dust events at the Jungfraujoch
M. Collaud Coen et al.
Title Page Abstract Introduction Conclusions References Tables Figures J I J I Back Close
Full Screen / Esc
Print Version Interactive Discussion
© EGU 2003 21 March, the air masses came under the influence of low pressure systems over the
Atlantic. The air was lifted up to the altitude of 400 to 550 hPa corresponding to 4000 to 6500 m a.s.l., respectively. The air flow accelerated parallel to the isobars and reached a latitude of 70◦ after only two days. At this point, the air masses started to turn clock-wise due to a high pressure system over Scandinavia. The high pressure core moved
5
further southward over Denmark and installed over northern Germany. This induced a clockwise air flow over Scandinavia, Russia and the Eastern European countries that was associated with a strong subsidence during the last days before arrival. Finally, the trajectories reached the Jungfraujoch from an easterly direction, which is not very typical for Saharan dust events and were found in our study only twice.
10
3.5.3. SDE on 7 May 2002
On 7 May 2002 a clear but relatively short SDE (14 h) was detected at the Jungfraujoch. Figure 10 shows trajectories arriving at Jungfraujoch on 7 May 2002, 13:00 LTC. They started 10 days before arrival over Scandinavia and the Norwegian and Greenland Sea. A low pressure system centered west of the Scandinavian coast forced the air to
15
flow anti-clockwise around the low centre. During the following days, until 2 May, the low pressure system became more distinct with a centre over Great Britain, and then stayed over north-western Europe slowly moving in a north-eastern direction. Under this influence, the air masses moved further south- and south-eastward and followed an extended cold-front passing over south-western Europe during 30 April and 1 May.
20
At 120 h before arrival on 2 May, the respective air masses stayed over the Gulf of Biscay in an area with a low pressure gradient right between the low pressure system over Scandinavia and a high pressure system over the Atlantic. It seems that the air masses came under the influence of the high pressure system with air subsiding over a large area. During this time the trajectories show a strong subsidence and a southward
25
movement. Three days before arriving at the Jungfraujoch they reached the Sahara in Morocco and Algeria and subsided to a height of less than 100 hPa distance above ground. During the following 24 h the trajectories turned clockwise around a weak high
ACPD
3, 5547–5594, 2003Saharan dust events at the Jungfraujoch
M. Collaud Coen et al.
Title Page Abstract Introduction Conclusions References Tables Figures J I J I Back Close
Full Screen / Esc
Print Version Interactive Discussion
© EGU 2003 pressure core that installed over the region of south-east Spain and northern Algeria.
On 5 May, a cold front associated with a weak low pressure system over Spain and reaching from northern Spain to the Atlantic moved south-eastward and induced an air mass movement in a northerly direction. Together with this cold-front, an uplift can be observed to height levels of about 4000 m a.s.l. During the following hours, a relative
5
low pressure over Germany supported the further northward flow to the Alps and the arrival of mineral dust at the Jungfraujoch.
3.6. Estimation of the contribution of Saharan dust to TSP
For the time period from 01 March 2001 to 31 December 2002, the average TSP level of 48 h-samples that are not affected by Saharan dust (SD) is on average 2.5 µg/m3,
10
which is smaller than the TSP mass for samples collected during SDE period (mean value of 7.3 µg/m3). Saharan dust events significantly contribute to the 48 h-TSP level at the JFJ: the 48 h-TSP value is higher than 10 µg/m3 for 25% of the samples that are affected by SD, but only for about 1.6% of the samples that are not affected by SD. However, for a large fraction of the filter samples that are affected by SD, the TSP level
15
is moderate. 64% of the SD-affected samples have a 48 h-TSP value below 5.5 µg/m3, which corresponds to the 90-percentile of the 48 h-TSP samples without SD. Therefore, the 48 h-TSP mass concentration is not an appropriate measure for identifying SDE.
From the length of each SDE (determined by the negative single scattering albedo exponent as shown above) the time not affected by SDE was calculated for each of
20
these samples. For the latter, a TSP value was estimated using a local linear regression model (Chambers and Hastie, 1992). From this value and the corresponding time, the non-SD fraction was calculated for all SDE affected 48 h-TSP samples. Subtracting this value from the total 48 h-TSP mass concentration yielded then the SDE contribution to each 48 h-TSP value. The estimates are expected to be accurate when the sequences
25
of successive SD affected and/or missing filter samples are not too long. The local linear regression fit was performed by using the loess function of the statistical software R. The smoothing parameter was chosen to minimize the residual standard error of the
ACPD
3, 5547–5594, 2003Saharan dust events at the Jungfraujoch
M. Collaud Coen et al.
Title Page Abstract Introduction Conclusions References Tables Figures J I J I Back Close
Full Screen / Esc
Print Version Interactive Discussion
© EGU 2003 regression function. In addition to local linear regression, multiple linear regression
and generalized additive models (GAM) were applied (Chambers and Hastie, 1992) but they showed large residuals for high TSP mass concentrations and are therefore not used here.
Figure 11 shows the measured 48 h-TSP mass concentration, the local linear
regres-5
sion function, and the estimated non-SD fraction for all SDE affected TSP samples. The uncertainty of the estimates for the non-SD fraction of 48 h-TSP was investigated by splitting the measured 48 h-TSP mass concentrations that are not affected by SD into a training and a test set. A local linear regression model was specified by use of the training set and the model accuracy was then evaluated by applying the model to the
10
test set. The resulting residuals were normally distributed with a mean value of zero and a standard deviation of 1.8 µg/m3. Consequently, the uncertainty for the estima-tion of the non-SD fracestima-tion of 48 h-TSP samples is 3.6 µg/m3(at 95% confidence level). Moreover, the standard deviation of the gravimetric 48 h-TSP measurement at the JFJ, as derived from repeated determinations, is 1.0 µg/m3. The total uncertainty of the
es-15
timation of the SD contribution to 48 h-TSP samples is determined by summation of the squares of the above mentioned standard deviations. This leads to a total uncertainty of 4.1 µg/m3(at 95% confidence level).
For 19 out of the 67 identified SDEs, the estimated contribution of SD to 48 h-TSP at JFJ is above 5 µg/m3. However, most of the estimated SD contributions to 48
h-20
TSP at JFJ are lower than the uncertainty of the estimate, and negative values for the estimated SD contribution occur for 15 of the 67 identified SDEs. The uncertainty range of all except two of the obtained negative values includes zero. The two smallest values concern two consecutive SDE separated by 4 days and are due to an overestimated background concentrations between the two events. Negative values are physically not
25
reasonable. Nevertheless, they were not removed (or set to zero) because this would induce a positive bias.
The annual average contribution of Saharan Dust to long-term TSP at JFJ can be estimated as the arithmetic mean of the determined SD contributions to the 48 h-TSP
ACPD
3, 5547–5594, 2003Saharan dust events at the Jungfraujoch
M. Collaud Coen et al.
Title Page Abstract Introduction Conclusions References Tables Figures J I J I Back Close
Full Screen / Esc
Print Version Interactive Discussion
© EGU 2003 values. Evidently, the SD contribution to 48 h-TSP samples that are not affected by
SD is set to zero. For the total analysed time period, the average contribution of SD to 48 h-TSP is 0.8 µg/m3 (±0.2 µg/m3), while the mean TSP level is 3.4 µg/m3. The average contribution of SD to TSP at the JFJ is thus about 24%.
The available 48 h-TSP samples are certainly not ideal for investigating the
contribu-5
tion of SD at the JFJ. TSP (or PM10) samples with higher temporal resolution would be advantageous since the duration of a SDE at JFJ is typically much shorter than 48 h. The contribution of SD to the TSP mass concentration during the time a SDE is active cannot be resolved by this approach. However, an average SD contribution to hourly TSP values during SDE can be calculated from the length of each SDE (in hours) and
10
the SD contribution to each 48 h-TSP value. Figure 12 shows the calculated contribu-tion of SD to hourly TSP for the identified SDE. The average contribucontribu-tion of Saharan dust events to hourly TSP at JFJ is 16.1 µg/m3. For about one third of the identified SDE the Saharan dust contribution to hourly TSP is below 5 µg/m3, and for 60% of the SDE, the SD contribution to hourly TSP is below 10 µg/m3. On the other hand, 9% of
15
the Saharan dust event lead to a SD contribution of above 40 µg/m3, with a maximum SD contribution of 214 µg/m3resulting from the Saharan dust event on 20 June 2002. 3.7. Chemical analysis
For the March–November 2001 period, 24-h filter samples were collected on every sixth day and analyzed by ion chromatography (Henning et al., 2002) for chemical
20
composition. As in the case of the TSP values, the SDE often correspond only to a part of the filter sampling time, so that the SDE contribution to the chemical composition is diluted by the normal aerosols. Anyhow some general conclusions can be deduced from these measurements. Table 6 presents the daily average mass concentrations of analyzed species with and without SDE, for TSP and PM1, as well as the ratios
25
with/without SD of the species concentrations in percent. Negative values in the coarse mode may be explained with the uncertainties resulting from the difference between two relatively large numbers.
ACPD
3, 5547–5594, 2003Saharan dust events at the Jungfraujoch
M. Collaud Coen et al.
Title Page Abstract Introduction Conclusions References Tables Figures J I J I Back Close
Full Screen / Esc
Print Version Interactive Discussion
© EGU 2003 The amount of TSP and to a far lesser extent the amount of PM1are greater during
SDE, so that it is mainly the coarse aerosol amount that is increased by SDE. Dur-ing SDE, the concentrations of magnesium, calcium and potassium are significantly enhanced, which is explained by the fact that these are all constituents of illite and montmorillonite. The mass concentrations of SD related components are much higher
5
in the coarse mode than in the fine mode as found by numerous other studies. It is however interesting to note that SDE exhibits a significant fraction in the fine mode, resulting in a much higher increase of these components in PM1 than in the coarse mode. This submicron fraction exhibits a high surface area with basic sites (carbon-ates) which are available for neutralization reactions of acidic gases (Henning et al.,
10
2002). This may explain the increase of acetate and formate in PM1 during SDE. For other components, especially for those of anthropogenic origin, differences are more difficult to interpret since their concentrations during SDE can highly vary depending on the actual trajectory of the air mass.
4. Conclusions
15
Saharan dust events can be detected with an hourly precision by the inversion of the wavelength dependence of the single scattering albedo. The resulting negative expo-nent of the SSA is due to the large size of mineral aerosols, which induces a wavelength independence of the scattering coefficient. Similarly a somewhat larger wavelength de-pendence of the absorption coefficient is linked to Saharan dust chemical composition.
20
Clear SDE are characterized by four factors: 1) an increase of the scattering, absorp-tion and extincabsorp-tion coefficients, 2) vanishing scattering and ˚Angstr¨om exponents, 3) larger absorption exponent and 4) by a negative SSA exponent. According to this study, SDE at the JFJ lasted between only a few hours and seven days. In 92% of all cases, SDE detected by this new method are corroborated by either filter coloration,
25
back-trajectory analysis, satellite measurements or a combination of these methods. The αSSAmethod is however the most sensitive method to detect SDE. SDE are more
ACPD
3, 5547–5594, 2003Saharan dust events at the Jungfraujoch
M. Collaud Coen et al.
Title Page Abstract Introduction Conclusions References Tables Figures J I J I Back Close
Full Screen / Esc
Print Version Interactive Discussion
© EGU 2003 frequent and last longer during the March-June and the October–November period,
although some events also occur during the summer. Trajectory analysis shows that mineral dust traveling times are typically between 2 and 8 days, with a mean value of 96.5 h. The main source countries of Saharan dust arriving at the Jungfraujoch are Algeria, Libya, Morocco and Tunisia. In only 31% of the cases, the contribution of
Sa-5
haran dust to the 48 h-TSP levels at the Jungfraujoch can be detected. The estimated average contribution of Saharan dust events to hourly TSP at JFJ is 16 µg/m3, with the most severe SDE reaching 214 µg/m3. On average, the contribution of Saharan dust to TSP mass at JFJ was 0.8 µg/m3corresponding to 24% of TSP.
Acknowledgements. We thank the International Foundation High Altitude Research Stations
10
Jungfraujoch and Gornergrat (HFSJG), which made it possible to PSI to carry out the experi-ments at the High Altitude Research Station at the Jungfraujoch. We also gratefully acknowl-edge R. Gehrig (EMPA), who provided the filter color data for this study, H. Wernli for the software package “Lagranto” and for his support concerning trajectories and P. Jeannet (Me-teoSwiss) for the average annual meteorological conditions at the JFJ. This work was supported
15
by the Swiss programme to the Global Atmospheric Watch (GAW) of the World Meteorological Organization.
References
Afeti, G. M. and Resch, F. J.: Physical characteristics of Saharan dust near the Gulf of Guinea, Atmos. Envir., 34, 1273–1279, 2000.
20
Anderson, T. L. and Ogren, J. A.: Determining aerosol radiative properties using the TSI 3563 Integrating Nephelometer, Aerosol Sci. Technol. 29, 57–69, 1998.
Avila, A., Queralt-Mitjans, I., and Alarc `on, M.: Mineralogical composition of African dust deliv-ered by red rains over northeastern Spain, J. Geophys. Res., 102, 2 1977–21 996, 1997. Bellandi, S., Oppo, C., Udisti, R., and Pantani, F.: Quasi-seasonal neutralization of acid rain in
25
Tuscany: can Saharan dust be respondible?, in The impact of desert dust across the Mediter-ranean, edited by: Guerzoni, S. and Chester, R., Kluwer Academic Publishers, Dordrecht, 369–373, 1996.
ACPD
3, 5547–5594, 2003Saharan dust events at the Jungfraujoch
M. Collaud Coen et al.
Title Page Abstract Introduction Conclusions References Tables Figures J I J I Back Close
Full Screen / Esc
Print Version Interactive Discussion
© EGU 2003
Bergstrom, R. W., Russel, P. B., and Hignet, P.: Wavelength dependence of the absorption of black carbon particles: predictions and results from the TARFOX experiment and implications for the aerosol single scattering albedo, J. Atmos. Sc., 59, 567–577, 2002.
Bethan, S., Vaughan, G., Gerbig, C., Volz-Thomas, A., Richer, H., and Tiddeman, D. A.: Chem-ical air mass differences near fronts, J. of Geophys. Res.-Atmospheres, 103, 13 413–13 434,
5
1998.
Bond, T. C., Anderson, T. L., and Campbell, D.: Calibration and intercomparison of filter-based measurements of visible light absorption by aerosols, Aerosol Science and Technology, 30, 582–600, 1999.
BUWAL: OFEFP, Office F´ed´eral de l’Environnement, des Forˆets et du Paysage, NABEL: la
10
pollution de l’air 2001, Cahier de l’environnement no. 343, 2002.
Chambers, J. M. and Hastie, T. J.: Statistical models in S., Wadsworth & Brooks/Cole, Ad-vanced Books and Software, Pacific Grove, California, 1992.
Chiapello, I., Propero, J. M., Herman, J. R., and Hsu, N. C.: Detection of mineral dust over the North Atlantic Ocean and Africa with the Nimbus 7 TOMS, J. Geophys. Res. 104, 9277–9291,
15
1999.
Chiapello, I., Bergametti, G., Chatenet, B., Bousquet, P., Dulac, F., and Santos Soares, E.: Origins of African dust transported over the northeastern tropical Atlantic, J. Geo. Res., 102, 13 701–13 709, 1997.
D’Almeida, G. A.: A model for Saharan dust transport, J. Clim. Appl. Meteorol., 25, 903–916,
20
1986.
De Angelis, M. and Gaudichet, A.: Saharan dust deposition over Mont Blanc (French Alps) during the last 30 years, Tellus, 43, 61–75, 1991.
Delmas, V., Jones, H. G., Tranter, M., and Delmas, R.: The weathering of aeolian dust in alpine snows, Atmos. Envir., 30, 1317–1325, 1995.
25
Donnell, E. A., Fish, D. J., Dicks, E. M., and Thorpe, A. J.: Mechanisms for pollutant transport between the boundary layer and the free troposphere, J. of Geophys. Res.-Atmospheres, 106, 7847–7856, 2001.
Henning, S., Weingartner, E., Schwikowski, M., G ¨aggeler, H. W., Gehrig, R., Hinz, K. P., Trim-born, A., Spengler, B., and Baltensperger, U.: Seasonal Variation of the Water Soluble Ions
30
of the Aerosol at the High-Alpine Site Jungfraujoch (3580 m a.s.l.), J. Geophys. Res., 107, doi: 10.1029/2002JD002439, 2002.
ACPD
3, 5547–5594, 2003Saharan dust events at the Jungfraujoch
M. Collaud Coen et al.
Title Page Abstract Introduction Conclusions References Tables Figures J I J I Back Close
Full Screen / Esc
Print Version Interactive Discussion
© EGU 2003
global direct forcing of aerosols, Geophys. Res. Lett., 27, 217–220, 2000.
Kalashnikova, O. V. and Sokolik, I. N.: Importance of shapes and compositions of wind-blown dust particles for remote sensing at solar wavelengths, Geophys. Res. Let., 29, 38-1–38-4, 2002.
Lo¨ye-Pilot, M. D. and Martin, J. M.: Saharan dust input to the western mediterranean: an eleven
5
years record in Corsica, in The impact of desert dust across the Mediterranean, edited by: Guerzoni, S. and Chester, R., Kluwer Academic Publishers, Dordrecht, 191–199, 1996. Mattis, I., Ansmann, A., M ¨uller, D., Wandinger, U., and Althausen, D.: Dual-wavelength Raman
lidar observations of the extinction-to-backscatter ratio of Saharan dust, Geophys. Res. Let., 29, 10.1029/2002GL014721, 2002.
10
Marticorena, B. and Bergametti, G.: Two-year simulations of seasonal and interannual changes of the Saharan dust emissions, Geophys. Res. Let. 23, 1921–1924, 1996.
Marticorena, B., Bergametti, G., and Aumont, B.: Modeling the atmospheric dust cycle, 2. Simulation of Saharan dust sources, J. Geophys. Res., 102, 4387–4404, 1997.
Mattson, J. O. and Nihl `en, T.: The transport of Saharan dust to southern Europe: a scenario, J.
15
Arid Env., 32, 111–119, 1996.
Moulin, C., Lambert, C. E., Dayan, U., Masson, V., Ramonet, M., Bousquet, P., Legrand, M., Balkanski, Y. J., Guelle, W., Maticorena, B., Bergametti, G., and Dulac, F.: Satellite clima-tology of African dust transport in the Mediterranean atmosphere, J. Geophys. Res., 103, 13 137–13 144, 1998.
20
M ¨uller, D., Mattis, I., Wandiger, U., Ansmann, A., Althausen, D., Dubovik, O., Eckhardt, S., and Stohl, A.: Saharan dust over a central European EARLINET-AERONET site: Com-bined observations with Raman lidat and Sun photometer, J. Geophys. Res., 108, 4345, doi:10.1029/2002JD002918, 2003.
Prospero, J. M., Schmit, R., Cuevas, E., Savoie, D. L., Graustein, W. C., Turekian, K. K.,
Volz-25
Thomas, A., Diaz, A., Oltmans, S. J., and Levy II, H.: Temporal variability of summer-time ozone and aerosols in the free troposphere over the eastern North Atlantic, Geophys. Res. Lett., 22, 2925–2928, 1995.
Prospero, J. M., Ginoux, P., Torres, O., Nocholson, S. E., and Gill, T. E.: Environmental char-acterization of global sources of atmospheric soil dust identified with the nimbus 7 total
30
ozone mapping spectrometer (TOMS) absorbing aerosol product, Reviews of Geophysics, 40, 1/February 2002.