HAL Id: hal-02625211
https://hal.archives-ouvertes.fr/hal-02625211
Submitted on 27 May 2020
HAL is a multi-disciplinary open access
archive for the deposit and dissemination of
sci-entific research documents, whether they are
pub-lished or not. The documents may come from
teaching and research institutions in France or
abroad, or from public or private research centers.
L’archive ouverte pluridisciplinaire HAL, est
destinée au dépôt et à la diffusion de documents
scientifiques de niveau recherche, publiés ou non,
émanant des établissements d’enseignement et de
recherche français ou étrangers, des laboratoires
publics ou privés.
Delphine Tardif, Frédéric Fluteau, Yannick Donnadieu, Guillaume Le Hir,
Jean-Baptiste Ladant, Pierre Sepulchre, Alexis Licht, Fernando Poblete,
Guillaume Dupont-Nivet
To cite this version:
Delphine Tardif, Frédéric Fluteau, Yannick Donnadieu, Guillaume Le Hir, Jean-Baptiste Ladant, et al..
The origin of Asian monsoons: a modelling perspective. Climate of the Past, European Geosciences
Union (EGU), 2020, 16 (3), pp.847-865. �10.5194/cp-16-847-2020�. �hal-02625211�
Clim. Past, 16, 847–865, 2020
https://doi.org/10.5194/cp-16-847-2020
© Author(s) 2020. This work is distributed under the Creative Commons Attribution 4.0 License.
The origin of Asian monsoons: a modelling perspective
Delphine Tardif1, Frédéric Fluteau1, Yannick Donnadieu2, Guillaume Le Hir1, Jean-Baptiste Ladant3,
Pierre Sepulchre4, Alexis Licht5, Fernando Poblete6, and Guillaume Dupont-Nivet7,8 1Institut de physique du globe de Paris, CNRS, Université de Paris, 75005 Paris, France 2Aix-Marseille Univ., CNRS, IRD, Coll France, INRA, CEREGE, Aix-en-Provence, France 3Department of Earth and Environmental Sciences, University of Michigan, Ann Arbor, MI, USA
4Laboratoire des Sciences du Climat et de l’Environnement, LSCE/IPSL, CEA-CNRS-UVSQ, Université Paris-Saclay,
91191 Gif-sur-Yvette, France
5Department of Earth and Space Sciences, University of Washington, Seattle, USA 6Departamento de Geología, Universidad de Chile, Santiago, Chile
7Géosciences Rennes, Univ. Rennes, CNRS, 35000 Rennes, France 8Institute of Geosciences, Universität Potsdam, Potsdam, Germany
Correspondence:Delphine Tardif ([email protected])
Received: 26 November 2019 – Discussion started: 13 December 2019 Revised: 10 March 2020 – Accepted: 22 March 2020 – Published: 8 May 2020
Abstract.The Cenozoic inception and development of the Asian monsoons remain unclear and have generated much debate, as several hypotheses regarding circulation patterns at work in Asia during the Eocene have been proposed in the few last decades. These include (a) the existence of modern-like monsoons since the early Eocene; (b) that of a weak South Asian monsoon (SAM) and little to no East Asian monsoon (EAM); or (c) a prevalence of the Intertropical Convergence Zone (ITCZ) migrations, also referred to as Indonesian–Australian monsoon (I-AM). As SAM and EAM are supposed to have been triggered or enhanced primarily by Asian palaeogeographic changes, their possible inception in the very dynamic Eocene palaeogeographic context remains an open question, both in the modelling and field-based com-munities. We investigate here Eocene Asian climate condi-tions using the IPSL-CM5A2 (Sepulchre et al., 2019) earth system model and revised palaeogeographies. Our Eocene climate simulation yields atmospheric circulation patterns in Asia substantially different from modern conditions. A large high-pressure area is simulated over the Tethys ocean, which generates intense low tropospheric winds blowing southward along the western flank of the proto-Himalayan– Tibetan plateau (HTP) system. This low-level wind system blocks, to latitudes lower than 10◦N, the migration of hu-mid and warm air masses coming from the Indian Ocean. This strongly contrasts with the modern SAM, during which
equatorial air masses reach a latitude of 20–25◦N over In-dia and southeastern China. Another specific feature of our Eocene simulation is the widespread subsidence taking place over northern India in the midtroposphere (around 5000 m), preventing deep convective updraught that would transport water vapour up to the condensation level. Both processes lead to the onset of a broad arid region located over north-ern India and over the HTP. More humid regions of high seasonality in precipitation encircle this arid area, due to the prevalence of the Intertropical Convergence Zone (ITCZ) mi-grations (or Indonesian–Australian monsoon, I-AM) rather than monsoons. Although the existence of this central arid region may partly result from the specifics of our simula-tion (model dependence and palaeogeographic uncertainties) and has yet to be confirmed by proxy records, most of the observational evidence for Eocene monsoons are located in the highly seasonal transition zone between the arid area and the more humid surroundings. We thus suggest that a zonal arid climate prevailed over Asia before the initiation of mon-soons that most likely occurred following Eocene palaeogeo-graphic changes. Our results also show that precipitation sea-sonality should be used with caution to infer the presence of a monsoonal circulation and that the collection of new data in this arid area is of paramount importance to allow the debate to move forward.
1 Introduction
Monsoons are characterized by highly seasonal precipita-tions, with a dry season in winter and a wet season in sum-mer, along with a seasonal wind inversion (Wang and Ding, 2008). From this definition, several broad monsoonal regions can be identified over the globe (Zhang and Wang, 2008; Zhisheng et al., 2015). A prominent member is the Asian monsoon system, which covers several smaller monsoonal regions (Wang and LinHo, 2002). The South Asian monsoon (SAM) is characterized by dry winters and wet summers with rainfall occurring from May (in southern India and south-eastern Asia) to July (in northwestern India). The East Asian monsoon (EAM) presents more contrasted seasons with cold and dry winters due to the presence of the Siberian High, and hot and wet summers with rainfall maxima from May (south-eastern China) to July (north(south-eastern China). The Indonesian– Australian monsoon (I-AM), mirrored in the north by the mostly oceanic western North Pacific monsoon (WNPM), re-sults from the seasonal migration of the Intertropical Con-vergence Zone (ITCZ) and generates rainfall from April to August (over southeastern Asia and the western Pacific) and from November to February (over Indonesia and northern Australia).
The ITCZ is an intrinsic characteristic of the Earth’s cli-mate, and the WNPM and I-AM have therefore probably oc-curred throughout Earth’s history (Spicer et al., 2017). On the other hand, the triggering factors of both SAM and EAM are more complex and remain debated. Although the SAM is also related to the migration of the ITCZ, it is thought to be enhanced by orographic insulation provided by the Hi-malayas (Boos and Kuang, 2010), the overheating of the Ti-betan Plateau (TP) in summer and the generation of a strong Somali jet (Molnar et al., 2010), which might itself be am-plified by the orography of the East African coast (Bannon, 1979), although this view has been challenged (Wei and Bor-doni, 2016). Another characteristic feature of the SAM is a strong shear zone between the 850 and 200 mbar zonal winds (Webster and Yang, 1992). In contrast, the EAM is an extra-tropical phenomenon, where winter and summer monsoons are mainly triggered by differential cooling and heating be-tween the huge Asian continental landmass and the western Pacific Ocean, even though it has been suggested that the EAM might also be affected by the Somali jet strength and TP uplift (Tada et al., 2016).
The inception of the SAM and EAM has been proposed to have occurred during the early Miocene (Guo et al., 2002) or the latest Oligocene (Sun and Wang, 2005), but recent field observations have suggested an earlier inception, as soon as the middle to late Eocene (∼ 40 Ma). These stud-ies rely on different indices such as (a) records of high seasonality in precipitations from palaeovegetation and sed-imentary deposits in China (Quan et al., 2012; Sorrel et al., 2017; Q. Wang et al., 2013) and Myanmar (Licht et al., 2015); (b) δ18O measurements showing high annual
vari-ability in water availvari-ability in oyster shells from the Tarim Basin (Bougeois et al., 2018; Ma et al., 2019), in mammals tooth enamel and gastropod shells from Myanmar (Licht et al., 2014a). These findings postpone the initiation of the Asian monsoons by about 20 Myr and, given the strong de-pendence of both SAM and EAM on palaeogeography, orog-raphy and temperature gradients, raise the challenge of un-derstanding the triggering factors of these complex atmo-spheric systems in the climatic and palaeogeographic context of the middle to late Eocene.
Indeed, the second half of the Eocene, referred to as “doubthouse”, is a key period in the transition from the warm ice-free early Eocene greenhouse to colder icehouse initi-ated in the early Oligocene (Liu et al., 2009). It witnessed profound climatic modifications, such as a global cooling and drying, the possible onset of the Antarctic Circumpo-lar Current (ACC), and a Circumpo-large-scale glaciation in Antarctica (Sijp et al., 2014), hence prefiguring the dawning of mod-ern climatic features. Moreover, important palaeogeographic changes took place in the late Eocene in Asia following the collision between the Eurasian and Indian continents, which might have significantly impacted both regional and global climate, including (a) two Paratethys sea retreats with fluc-tuations phases between 46 and 36 Ma (Meijer et al., 2019), (b) the drying and subsequent closure of the Indian foreland basin (Najman et al., 2008), and (c) continued uplift of the Tibetan Plateau (Kapp and DeCelles, 2019).
If no consensus has been reached so far regarding the possibility of modern-like SAM and EAM in the Eocene and on the mechanisms at stake during this period, several conjectures have emerged in the few last decades. With the NCAR CCSM3 fully coupled model, Huber and Goldner (2012) suggest that the global monsoon system (including the Asian monsoons) prevailed throughout the Eocene. Using a late Eocene configuration and the Fast Ocean Atmosphere Model (FOAM) along with LMDZ atmosphere model, Licht et al. (2014a) postulate the existence of the Asian monsoons in the late Eocene and show that orbital forcing might even trigger monsoons stronger than the modern ones. Other stud-ies have also inferred the existence of Asian monsoons in the late Eocene on the basis of sensitivity experiments deriv-ing mainly from modern geographic configurations (Roe et al., 2016; Zoura et al., 2019).
Other studies, although more focused on the EAM, are more cautious regarding the prevalence of the monsoons in the Eocene. Zhang et al. (2012) using FOAM suggest that early Eocene Asia was dominated by steppe/desert cli-mates, with a stable SAM but only an intermittent EAM de-pending on the orbital forcing. Li et al. (2018) and Zhang et al. (2018) perform late Eocene climate simulations with the low-resolution NorESM-L earth system model (ESM) and the NCAR CAM4 atmospheric model and further show that the wind and precipitation patterns simulated in eastern China are not comparable to the modern EAM.
D. Tardif et al.: The origin of Asian monsoons: a modelling perspective 849
A third theory has also recently been suggested based on both modelling work (Farnsworth et al., 2019) and leaf phys-iognomic signatures from vegetation deposits from south-eastern China, which is a region nowadays experiencing a mixed influence of EAM, I-AM and SAM (Herman et al., 2017; Spicer et al., 2016). They show that the fossil flo-ras from the Maoming and Changchang basins display more similarities with modern floras submitted to the influence of I-AM than to that of any other monsoon, hence suggesting that ITCZ migration could have been the main driver of pre-cipitation seasonality in the late Eocene.
The discrepancies between these different conjectures are hardly straightforward, given the variety of modelling frame-works, model resolutions and boundary conditions involved in the aforementioned studies, let alone considering the pos-sible biases of any model. From an observational perspective, available palaeoclimatic markers in Asia are also divided be-tween proxies suggesting the presence of Eocene monsoons and others that do not. However, the uncertainties associated with the climatic controls of the diverse proxies used to in-fer the existence of Eocene Asian monsoons often hamper the unequivocal assignment of the proxy signals to the mon-soons.
In this study, we first test the robustness of our ESM by analysing monsoonal circulations for modern conditions. The use of an ESM here is particularly indicated given the importance of atmosphere–sea surface temperature (SST) in-teractions in monsoon circulation. We then simulate the late– middle Eocene (42 to 38 Ma) climate using a 40 Ma palaeo-geographic reconstruction. First, we perform a global model– data comparison with both continental and marine tempera-tures, allowing us to demonstrate the ability of our model to simulate the late Eocene climate at the first order. Second, we analyse atmospheric circulation patterns over Asia and highlight potential (di-)similarities with modern circulation. We finally focus on the atmospheric dynamics and on the hydrological cycle features occurring over the Asian conti-nent during the late Eocene and discuss the possible reasons behind the discrepancies observed between the different ex-isting hypotheses.
2 Model and methods
2.1 Model description and validation
IPSL-CM5A2 (Sepulchre et al., 2019) is composed of the at-mospheric LMDZ5 model (Hourdin et al., 2013), the land surface ORCHIDEE model (Krinner et al., 2005) and the NEMO model including oceanic, biogeochemical and sea-ice components (Madec, 2016). The atmospheric grid has a resolution of 3.75◦(longitude) by 1.89◦(latitude) and 39 ver-tical layers from the surface up to 40 km high, and the tripo-lar oceanic grid has a resolution varying between 0.5◦and 2◦ and 30 vertical layers. The continuity of the processes at the interface between ocean and atmosphere is ensured
by the OASIS coupler (Valcke et al., 2006). The land sur-face ORCHIDEE model is coupled to the atmosphere with a 30 min time step and includes a river runoff module to route the water to the ocean (d’Orgeval et al., 2008). Vegetation is simulated through 11 plant functional types (hereafter PFT): eight forest PFTs; one bare soil PFT; and two grasses PFTs, one coding for C3grasses and the other one for C4grasses
(Poulter et al., 2011). As the C4plants are known to expand
during the late Miocene (Cerling et al., 1993), this last PFT was deactivated.
IPSL-CM5A2 is an updated version of IPSL-CM5A (Dufresne et al., 2013), which was already used in palaeocli-mate studies for the Quaternary (Kageyama et al., 2013) and the Pliocene (Contoux et al., 2012; Tan et al., 2017). It relies on more recent versions of each component and has been re-tuned to reduce the IPSL-CM5A global cold bias. Apart from retuning – that is based on a new auto conversion threshold for water in cloud – and various improvements in energy conservation, the LMDZ component of IPSL-CM5A2 has the same physics and parameterizations as IPSL-CM5A. Jet position and AMOC have been improved, together with the sea-ice cover. IPSL-CM5A2 also benefits from higher paral-lelization (namely MPI–OpenMP in the atmosphere), which improves the model scalability and allows the model to reach ∼100 yr d−1simulated on the JOLIOT-CURIE French su-percomputer (Sarr et al., 2019; Sepulchre et al., 2019). We nonetheless first provide a validation of the model on mod-ern climatic conditions for the Asian monsoon regions.
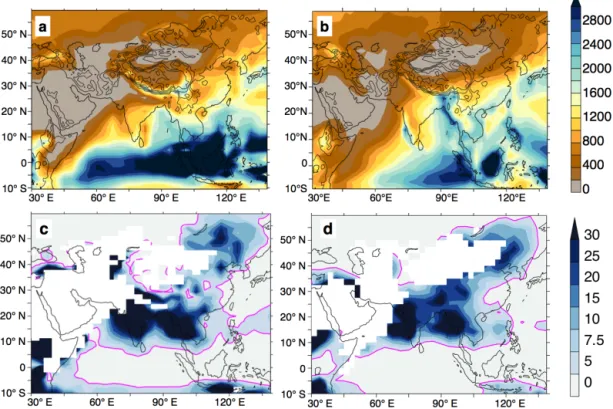
We evaluate the ability of IPSL-CM5A2 to reproduce the climate patterns over Asia by comparing the last 20 years of a 1855–2005 historical run (Sepulchre et al., 2019) to the Global Precipitation Climatology Project (GPCP) for rain-fall and to the European Centre for Medium-Range Weather Forecasts (ECMWF) reanalysis (ERA-40) for the winds (Frauenfeld, 2005). Regarding precipitation, IPSL-CM5A2 shows typical biases shared with CMIP5-generation models, i.e. a ca. 2-month delay in the monsoon onset over India (see Fig. S1 in the Supplement), an underestimated exten-sion of the monsoon over eastern China, Korea, and Japan, and an overestimation of rainfall rates over the subtropi-cal western/central Pacific Ocean and Indian Ocean (Sper-ber et al., 2013). However, these biases are reduced in IPSL-CM5A2 compared to the previous IPSL ESM version (Dufresne et al., 2013), as a response to a tuning-induced bet-ter SST patbet-tern over the Arabian Sea that enhances rainfall over India during the summer monsoon (Levine et al., 2013). Simulated mean annual precipitation (MAP) rates fit the main patterns of GPCP (Fig. 1a, b), although IPSL-CM5A2 tends to expand aridity over Arabia and central Asia. Rain-fall amounts over Nepal and Bangladesh are underestimated, whereas they are reinforced over the foothills of the Hi-malayas, likely as a response to the lack of spatial resolu-tion that prevents the representaresolu-tion of orographic rainfall associated with the steep changes in topography of these regions. The expression of seasonality, calculated through
the ratio of the precipitations during the three consecutive wettest months against the three consecutive driest months (hereafter 3W / 3D) is well represented over Asia (Fig. 1c, d). We have chosen the 3W / 3D ratio among many available cri-teria to characterize the climate seasonality because it has also been used as an indicator of monsoonal climates (with a minimum threshold value close to 5) in previous investi-gations of palaeo-monsoons (Herman et al., 2017; Shukla et al., 2014; Sorrel et al., 2017). The modern monsoonal regions in our model are adequately characterized by a high 3W / 3D ratio, although this signature is stronger in southern Asia than in eastern China. The seasonality in precipitation is thus con-sistently reproduced for modern conditions.
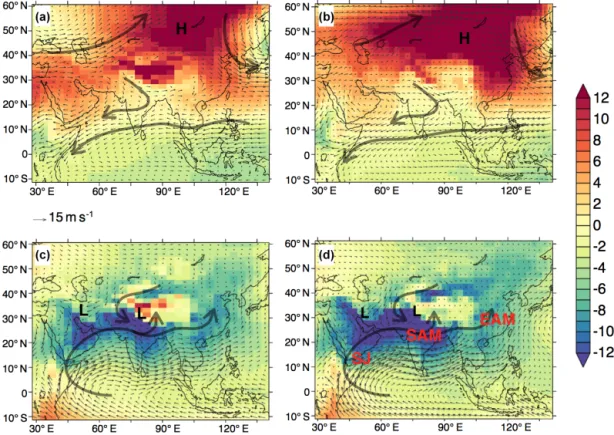
Regarding atmospheric large-scale dynamics, winter mon-soon winds are well simulated, with anticyclonic winds around the Siberian High (Fig. 2a, b). The summer circu-lation patterns (Fig. 2c, d) are also well reproduced, although the low-pressure belt over Arabia and southern Asia is sim-ulated with lower intensity and lesser extension than in the reanalysis. Likewise, the simulated EAM intrusion in east-ern China appears to be less pervasive than in the reanalysis, in which winds coming from the South China Sea penetrate further inland. The simulated Somali jet and SAM winds dis-play weaker intensity but mirrors the patterns observed in the reanalysis. Given that IPSL-CM5A2 reproduces well the sea-sonal atmospheric dynamics patterns and the seasea-sonality, we will thus mostly focus on these criteria in the discussion that follows.
2.2 Late Eocene fully coupled simulation setup
The Eocene simulation (EOC4X) uses a 40 Ma palaeogeog-raphy and palaeobathymetry reconstruction (see Fig. S2a). Global plate reconstructions follow methods and plate ref-erences described in Baatsen et al. (2016) with significant modifications in tectonically active area within the 45–35 Ma based on a review of geologic data and literature (https://map. paleoenvironment.eu/, last access: 24 April 2020). Specifi-cally in the India–Asia collision zone, palaeopositions are based on palaeomagnetic references (Lippert et al., 2014), and collision is underway with Greater India completely emerged (Najman et al., 2010). Based on a review of geo-logical constraints (see Botsyun et al., 2019; Kapp and De-Celles, 2019, and references therein), the Tibetan Plateau altitude is set to 3500 m in central Tibet forming a highly elevated low-relief plateau. Moderate–low-elevation palaeo-surface for northern Tibet and low-elevated regions further north into the Qaidam and Tarim basins (surrounded by very subdued topography below 1000 m for the mountain belts of the Pamir, Kunlun Shan, Tian Shan, Altun Shan and Qilian Shan/Nan Shan) decrease finally into the plain and epicon-tinental sea of central Asia. The Paratethys is set to its ex-tent estimated during the maximum ingression reached just before 41 Ma (Bosboom et al., 2017), and the Turgai Strait, which connected the Paratethys sea and the Arctic Ocean,
is set closed by the mid-Eocene (Akhmets’ev and Beni-amovski, 2006; Kaya et al., 2019), but the water exchanges with the Tethys ocean are maintained to the south.
The CO2atmospheric concentration is set to 1120 ppm (4
PAL, preindustrial atmospheric concentration, or 4X inter-changeably), which corresponds to the high end of the mid-dle to late Eocene (42–34 Ma) pCO2estimates from data and
carbon cycle models (Anagnostou et al., 2016; Beerling and Royer, 2011; Lefebvre et al., 2013). Ice sheets are removed as the presence of even small permanent ice sheets was highly unlikely under these CO2concentrations (DeConto and
Pol-lard, 2003; Gasson et al., 2014). As other greenhouses gas (CH4, NO2, O3) concentrations are poorly constrained for
this period, they are left to their preindustrial values, as pro-posed in model intercomparison projects on pre-Quaternary periods (Lunt et al., 2017). The solar constant is reduced to 1360.19 W m−2 (Gough, 1981), and the orbital parameters are set to their present values.
Although several vegetation reconstructions are proposed in the literature for the Eocene, they were usually designed for higher CO2 concentrations (e.g. 8 PAL, in Herold et
al., 2014) and/or different palaeogeographies, such as the early Eocene (Sewall et al., 2000). Here, our Eocene fully coupled simulation uses an idealized vegetation map de-rived from the main modern climatic zones on the globe (see Fig. S2b in the Supplement). The limits of this approach will be discussed in the Discussion section.
3 Results
We first compare the simulated oceanic and terrestrial tem-peratures to two compilations of SST and mean annual ter-restrial temperatures (MATs), ranging respectively from 42 to 38 Ma (late–middle Eocene) and from 38 to 34 Ma (late Eocene; a complete description of the compilation is given in Tables S1 to S4 in the Supplement). The main climatic patterns over Asia obtained for the EOC4X simulation are then presented and compared to modern conditions, and we discuss potential implications for our understanding of the Cenozoic monsoon history.
3.1 Comparison of the simulated Eocene climate with a proxy compilation
The EOC4X ocean is initialized from warm idealized condi-tions similar to those proposed by Lunt et al., 2017 and has been run for 3000 years. At the end of the integration the ocean has reached quasi-equilibrium, including in the deep oceanic layers, showing a drift inferior to 0.05◦C per century (see Fig. S3). Our reference simulation yields SST in bet-ter agreement with the 42–38 Ma late–middle Eocene group than with the late Eocene group (Fig. S4). This suggests that our 4 PAL results are more representative of the late– middle Eocene conditions, which seems consistent given the fact that 4 PAL corresponds usually to the higher CO2
esti-D. Tardif et al.: The origin of Asian monsoons: a modelling perspective 851
Figure 1.Comparison of (a, b) mean annual precipitations in millimetres per year and (c, d) the 3 wet / 3 dry ratio simulated in (a, c) the modern control simulation and (b, d) the GPCP observations.
mates for the second half of the Eocene. Consequently, we develop here the comparison with the late–middle Eocene proxy group (Fig. 3) and attach the comparison between model and late Eocene proxy group (Fig. S5).
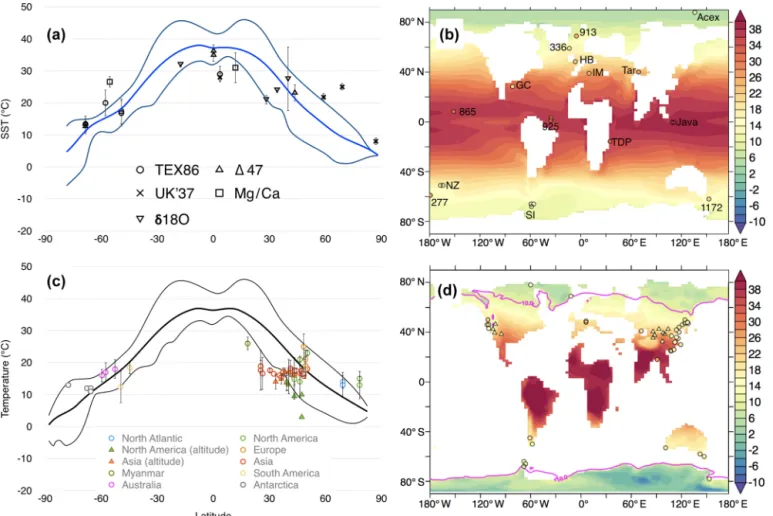
The comparison with SST estimates yields overall good results, although some discrepancies remain; at high lati-tudes, DSDP 277 near New Zealand and ODP 913 in the North Atlantic show temperatures warmer by ∼ 13◦C
com-pared to the model, while in the Gulf of Mexico, the proxy is 11◦C cooler than the model, and in the equatorial Atlantic (site ODP 925) proxies are 8◦C cooler than the model. De-spite a steeper latitudinal thermal gradient than that recon-structed from proxy records, the model is able to match rea-sonably well the coldest and warmest proxy values (8◦C for the ACEX drilling, in the Arctic, and 36◦C for JavaKW01 on the Equator) with a ±3.5◦C accuracy. This conundrum, where models struggle to reproduce the flatter thermal gradi-ent suggested by proxy records by simulating too warm (resp. cold) temperatures at the Equator (resp. poles), is a recurrent problem in modelling studies. Underlying causes remain un-clear and could be attributed to proxy uncertainties, missing processes in the models, (Huber and Caballero, 2011) or bi-ases in the way models handle small-scale processes, such as cloud feedbacks (Zhu et al., 2019). Regarding the prox-ies, seasonal bias (towards summer or winter, (Schouten et al., 2013; Tierney and Tingley, 2018) might affect the tem-peratures interpreted as representative of the mean annual sea
surface temperature. Calibration methods can also be ques-tioned, especially for warmer-than-present, deep-time stud-ies, as it the case for the Mg/Ca palaeothermometer that does not account for the changing Mg/Ca ratio of seawa-ter (Tierney et al., 2019) or for the UK370, for which the recent BAYSPLINE recalibration method has proven to lower the mismatch at high temperatures (Tierney and Tingley, 2018). In the case of the TEX86, a subsurface bias has been
sug-gested (Ho and Laepple, 2016) and remains debated (Tier-ney et al., 2017). In Asia, δ18O measurements in oyster shells from the eastern edge of the Paratethys sea spanning the sec-ond half of the Eocene give estimates for the mean annual temperature as well as the seasonal amplitude, yielding SST estimates ranging from 22◦C in winter to 38◦C in summer (Bougeois et al., 2018). The simulated SSTs are consistent with these values, with a coldest simulated SST of 15◦C in January and a warmest simulated SST of 35◦C in August.
The fit between modelled and terrestrial proxy MATs (Fig. 3c, d) is less successful. The model reasonably fits tem-peratures in Australia, South America, Antarctica, Greenland and Europe, with a mismatch between values staying below ±5◦C for all locations, except the Gran Barranca (Chile) and Stare Seldo I (Europe) points. On the other hand, larger dif-ferences exist over North America and Asia, although the mismatch might likely have different origins. All of the North American proxy sites are located close to the west coast and to the Rocky Mountains, the Cenozoic history of which is
Figure 2.Comparison of (a, b) January to March and(c, d) June to August mean wind patterns obtained (a, c) in the modern control simulation (b, d) with ERA40 reanalysis. Shading represents sea level pressure anomaly (in millibars), calculated as the difference between seasonal SLP minus the mean annual SLP. Overprinted vectors show 850 mbar wind speed expressed in metres per second. Main zones of high (low) pressure are highlighted with H (L) black letters. Main features of the summer monsoon are highlighted in red: Somali jet (SJ), South Asian monsoon (SAM) and East Asian monsoon (EAM).
also complex. Incorrect prescribed topography in the model as well as local effects of atmospheric circulation might therefore have a large impact in terms of reconstructed tem-peratures (Feng and Poulsen, 2016; Sewall and Sloan, 2006). We note that the model successfully represents the proxy temperature range in this region (between 3 and 23◦C for the proxies and between 4 and 27◦C for the model), which suggests that the model–data mismatch is more likely related to palaeoelevation errors or local climatic effects rather than to a systematic bias in either the model or proxies. On the contrary, the remarkable homogeneity amongst the estimated MATs from Asian proxy records (ranging only from 14 to 19◦C) is somewhat puzzling, considering the fact that these 28 sites are spread between 18 and 52◦N in latitude and are
located in various geographical settings, ranging from coastal regions to mountainous areas. A possible cause could be the application of modern temperature–vegetation relation-ships to palaeobotanical records, which might not prove fully adequate to reconstruct the warmer climates of the Eocene (Grimm and Potts, 2016; Peppe et al., 2011).
If quantitative comparisons between model and palaeoveg-etation data need to be treated with caution for climates warmer than modern conditions, fossilized plants, together with lithological proxies, do however provide useful
qualita-tive information. In Asia, Eocene proxy reconstructions con-verge towards a generally zonal climatic pattern, with a dry arid belt spreading from the Tarim Basin to the east coast of China (Sun and Wang, 2005), and are fringed by more humid climates over India and South East Asia on its southern flank (Licht et al., 2014a; Ma et al., 2012; Sun and Wang, 2005) and over Siberia to the north (Akhmetiev and Zaporozhets, 2014). In the next sections, we will focus on the atmospheric circulation simulated for our Eocene simulation and analyse the shape and occurrence of the different Asian monsoons.
3.2 Asian Eocene atmospheric circulation
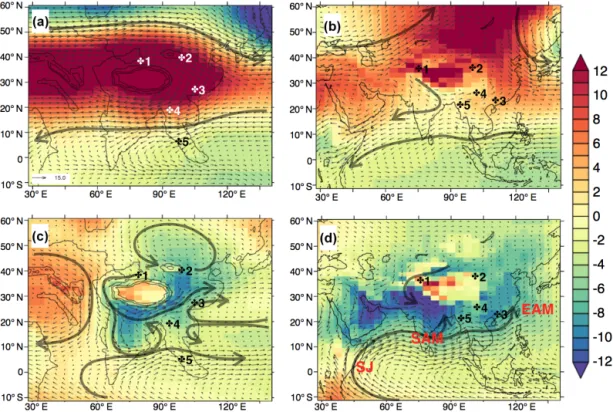
EOC4X seasonal atmospheric circulation patterns are pre-sented for winter (December–January–February) (Fig. 4a) and summer (June–July–August) (Fig. 4c) and compared to their modern counterparts (Fig. 4b, d). The winter circula-tion is characterized by a strong high-pressure belt at lati-tudes lower than today, located over the proto-Himalayan– Tibetan Plateau between 20 and 45◦N. Strong westerlies are simulated at midlatitudes around 40–50◦N, and easter-lies are at latitudes lower than 20◦N (up to 15 m s−1against 5 m s−1 in the control simulation). These features contrast with the modern winter system characterized by zonal winds
D. Tardif et al.: The origin of Asian monsoons: a modelling perspective 853
Figure 3. Late–middle Eocene global model–data comparison for (a, b) SST and (c, d) MAT. In (a) and (c), thick line represents the mean temperature from EOC4X, thin lines the min and max latitudinal temperatures from EOC4X. For (d) terrestrial proxies, high altitude locations (> 1000 m) are represented by triangles, the others by circles, and the thick pink line represents the 10◦C isotherm.
with a lower intensity and a larger meridional component. Fi-nally, no analogue to the modern Siberian High is simulated at 40 Ma (Fig. 4b). Today, the Siberian High is controlled by winter surface temperatures dropping below the freezing point in northeastern Siberia (around 50◦N). In our Eocene
simulation, the combined effect of a warmer climate and a reduced continentality (due to the presence of the Paratethys and Siberian seas) prevent its development.
During summer months, the nearby presence of the Tethys ocean and Paratethys sea results in a large high-pressure cell centred over 30◦E and extending from 10 to 50◦N (Fig. 4c). The Tethysian high is associated with intense 850 mbar northerlies around 60◦E which are partly deviated into northwesterlies when sweeping over northern Greater India (Fig. 4c). To the south, 850 mbar winds originated from the Indian Ocean enter the Indian subcontinent at low lati-tudes (< 10◦N) and turn southeasterlies over the Bengal Bay to feed precipitations over the foothills of the Himalaya be-fore shifting to southwesterlies (Fig. 4c). In the modern con-figuration, the 850 mbar winds of the SAM originate from the Indian Ocean and extend northward up to 20◦N over
In-dia before taking a northeast direction and generate heavy precipitations from India to Myanmar and up to the south-ern flank of the Himalayas to the north (Figs. 4d, 5d). These precipitations over southern Asia (up to 15 mm d−1; Fig. 5d) are fed by the Somali jet, a strong low-level, cross-equatorial moisture flow originating from the Indian Ocean which turns anticyclonically in the Northern Hemisphere along the east-ern edge of the easteast-ern African relief (Fig. 4d).
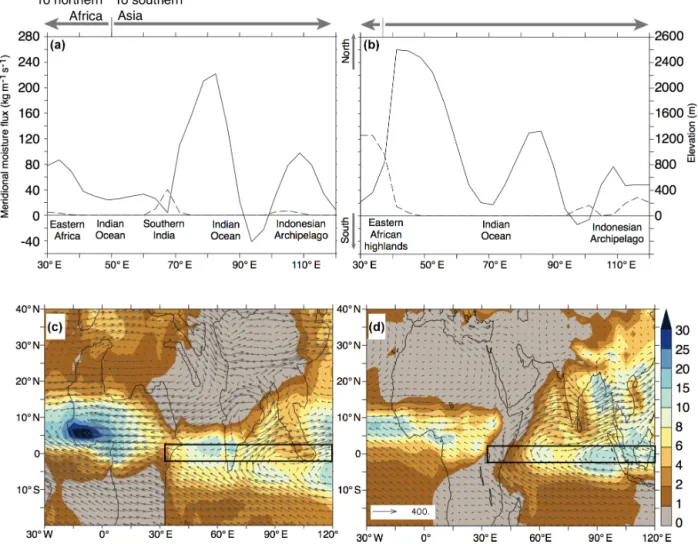
Figure 5 shows the northward moisture transport verti-cally integrated over the whole atmosphere column for the control and EOC4X experiments. In the control experiment, the largest meridional moisture transport crossing the Equa-tor is simulated along the eastern African coastline (Fig. 5b) and corresponds to the strongest meridional wind compo-nent. It confirms that the Somali jet is a key feature of the modern South Asian monsoon (Fig. 5b, d). Conversely in the EOC4X experiment, the Somali jet (0–10◦N/45–50◦E) barely exists. Instead, moisture flows from the Tethys and Indian oceans towards western Africa, where heavy summer precipitations are simulated (over 30 mm d−1; Fig. 5c). This alternate moisture pathway toward western Africa rather than
Figure 4.Sea level pressure anomaly (shading, in millibars) and 850 mbar wind patterns (vectors, m s−1) obtained in EOC4X (a, c) and compared to control simulation results (b, c). (a, b) Winter circulation pattern; (c, d) summer circulation patterns. Main wind patterns are represented by a thick black arrow, and low-pressure zones (high pressure) are marked by letter L (H). Numbers corresponds to regions highlighted in the main text: 1: Tarim sea region (Bougeois et al., 2018), 2: Xining Basin (Meijer et al., 2019; Licht et al., 2014a), 3: Maoming Basin (Herman et al., 2017; Spicer et al., 2016, 2017), 4: Jiuchuan Basin (Sorrel et al., 2017) and 5: Pondaung Formation in Myanmar (Licht et al., 2014b).
southern Asia is probably the result of several palaeogeog-raphy features (African continent positioned farther south, absence of topography in eastern Africa and presence of a Tethys seaway preventing the South Asian low pressure to extend westward) and will be discussed further in Sect. 4.2.
In the western Indian Ocean, the cross-equatorial mois-ture flow is strongly reduced in EOC4X compared to the control simulation, whereas it is increased over the east-ern Indian Ocean. However, this diverted equatorial mois-ture flux remains below 10◦N, and the Asian eastern Pa-cific coast receives instead a mixture of westerly winds com-ing from northern India (above 30◦N) and weak easterly
winds bringing moisture from the Pacific Ocean at lower lat-itudes (Fig. 5c), contrasting strongly with the modern EAM (Fig. 5d).
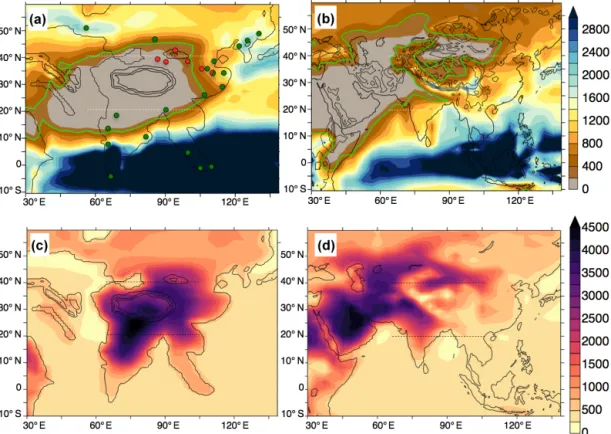
These atmospheric changes, both in summer and win-ter, generate a large arid area extending throughout west-ern China, the proto-Tibetan Plateau and northwest-ern India, while southern India and Myanmar experience intense rain-fall due to their position closer to the Equator in the Eocene (Fig. 6a, b). Apart from changes in near-surface winds, two intertwined processes conspire to explain the aridity: (1) a rise in the water vapour condensation height (corre-sponding roughly to the cloud base) and (2) a weakly
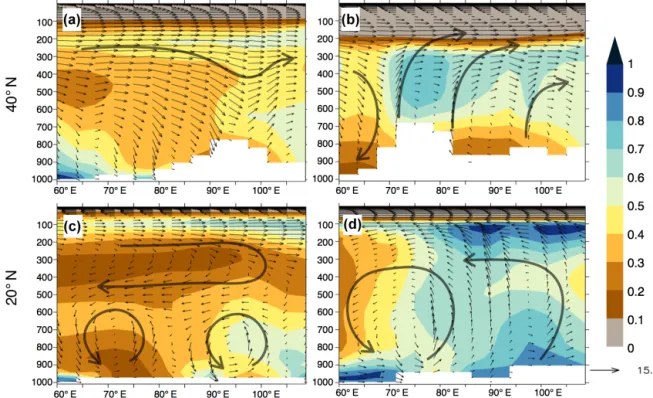
con-vective atmospheric column. The first process arises from the extreme surface air temperature in EOC4X (up to 45◦C), which results in a simulated water condensation altitude that exceeds 3500 m over northern India and Tibet. This altitude corresponds to a pressure level of ∼ 680 mbar (in the mid-dle troposphere), while the water condensation altitude re-mains below 2500 m in the control experiment, which corre-sponds to a pressure level of ∼ 800 mbar (in the lower tro-posphere; Fig. 6c, d). The second process, the lack of deep convection, makes midlevel atmospheric layers very dry and prevents air masses from reaching the water-condensation al-titude, as shown by two longitude–altitude cross sections of the relative humidity at 20 and 40◦N (Fig. 7).
At 20◦N today, modern India and South East Asia show multiple deep convection centres and a relative humidity around 60 % in most of the troposphere (Fig. 7d). In con-trast, the Eocene displays a more stratified atmosphere, with two weak convective cells above the Indian and southeastern Asian land masses, which are blocked around 600 mbar by subsiding air masses. Locations of deep convective heating can also be highlighted by observing the upper troposphere temperature maxima in the tropics (Boos and Kuang, 2010; Privé and Plumb, 2007; Roe et al., 2016), as presented in Fig. 8. In the control experiment, upper temperature
max-D. Tardif et al.: The origin of Asian monsoons: a modelling perspective 855
Figure 5.Comparison of (a, c) EOC4X and (b, d) control water column integrated moisture fluxes. (a, b) Vertically integrated northward JJA (June–August) moisture transport averaged between 2◦S and 2◦N (black lines and left axis) and expressed as Q = −g1R0
psqV dp, where
qis the specific humidity and V is the horizontal wind vector, g is the gravitational acceleration, and psis the surface pressure; dotted lines
represent the elevation of land masses within the same latitudinal band (right axis); arrows and legends indicate the direction of the zonal component of moisture fluxes. (c, d) JJA moisture fluxes (vectors) and cumulated precipitations for the same period (mm d−1). Black boxes highlight the area used to compute meridional moisture fluxes in (a) and (b).
ima are located over northern India deep convection regions (Fig. 8b), which is in good agreement with reanalysis (see Fig. S6). Deep convection tends to occur where latent and sensible heats per unit mass maximize, which is close to the subcloud surface (Emanuel et al., 1994), where temperature and relative humidity are elevated. In the control experiment, deep convection over India appears to be mostly controlled by latent heat because evaporation of precipitated water en-sures moisture availability. Yet, in EOC4X, the latent heat over India is largely weaker due to a lack of moisture despite warmer temperatures. Consequently no upper-level tempera-ture peak is simulated over northern India but rather over the western Pacific (Fig. 8a), where both temperature and rela-tive humidity are the highest.
At 40◦N, the presence of the Paratethys sea and the Tarim Basin as far as 80◦E is translated into a shallow surface
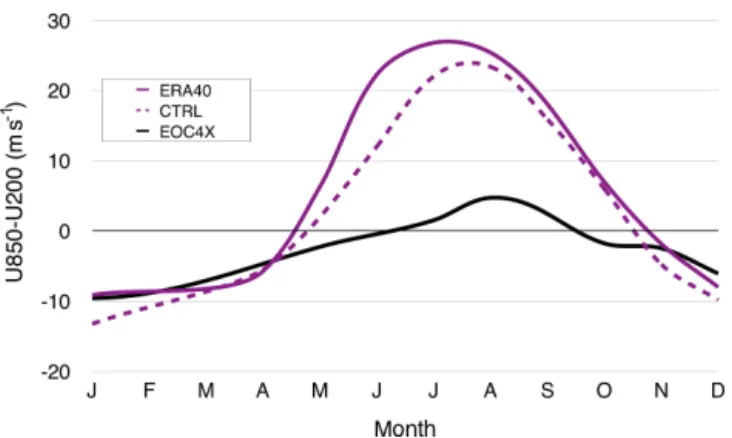
of high relative humidity (∼ 70 %; see Fig. 7a), which is confined in the lowest troposphere levels by strong sub-siding winds. The deep convection is here again muted by large-scale midlevel atmospheric dynamics. These diagnos-tics converge to demonstrate that our simulated Eocene at-mosphere in Asia has little in common with modern condi-tions. The application of the Webster and Yang Index (WYI) (Webster and Yang, 1992) further confirms these atmospheric contrasts. The WYI is a standard diagnostic criterion for the SAM that quantifies the shear effect between the lower and higher troposphere, which is a typical characteristic of this monsoon. Modern WYI summer values over the northern Indian Ocean exceed 20, whereas our EOC4X simulation yields summer values below 6 (Fig. 9), thereby emphasizing the strong differences between Eocene and modern summer circulation patterns in this region.
Figure 6.(a, b) Mean annual precipitations (mm yr−1) for the (a) EOC4X simulation and (b) the control simulation. The green outline delimits the arid region receiving less than 1 mm d−1. (c, d) Water condensation altitude (in metres) in July for the (c) EOC4X simulation and (d) control simulation. Horizontal dotted lines show the latitude used for the meridional profiles in Fig. 5. In (a), circles indicate locations of palaeovegetation studies and describe forested environment (green) and shrub/grass environment (red), according to qualitative descriptions described in Table S5.
4 Discussion
4.1 Can proxies identify monsoons?
The comparison of our model results showing a broad arid zone over Asia, with late Eocene proxy records is reason-ably good despite the fact that many of these records have been used to infer the existence of monsoons. This is first shown by a simple qualitative comparison with vegetation reconstructions from the middle Eocene (Fig. 6a), derived from a compilation of palaeobotanical studies (detailed in the Supplement). The spatial distribution of forests and shrub-land/grassland inferred from these studies is mostly coherent at first order with simulated MAP; however, a discrepancy remains between the northern Indian and Bengal forests and the dry conditions simulated (< 1 mm d−1). This could be attributed to either a bias towards aridity in these specific re-gions that is shared by most models (Valdes et al., 2017) and seems to translate into the Eocene as well and/or an inac-curate reconstruction of northern Indian late Eocene topog-raphy. We have indeed shown that, although our model rea-sonably simulates the modern monsoons in a control simu-lation in terms of wind regimes, the amount of precipitation simulated is underestimated, especially in India and in the
Bengal region (Fig. 1a, b). This, together with the large error bars associated with most of the quantitative reconstructions on precipitations proposed by palaeobotanical studies, ham-pers a quantitative comparison to palaeovegetation records, which mostly provide estimates of mean annual precipitation amounts. We thus rather focus on Eocene proxy records of seasonality (as previously done in Huber and Goldner, 2012, for example) as of our model’s ability to produce season-ality metrics in good agreement with modern observations (Fig. 1c, d).
Figure 8 shows the 3W / 3D obtained with EOC4X and compared to the late–middle Eocene compilation of coal and evaporites deposits from Boucot et al. (2013). In the liter-ature, evaporites are traditionally interpreted as markers of seasonal to arid environment, while coals indicate more sta-bly wet climates and thus have been extensively relied on to infer past climates (Huber and Goldner, 2012; Sun and Wang, 2005; Ziegler et al., 2003). However, this approach has been criticized as oversimplistic (D. Wang et al., 2013; Wiliams, 2007). Therefore, in addition to this compilation, we high-lighted localities positioned in strategic regions and result-ing from robust multiproxy analyses that were recently used to suggest monsoon-like highly seasonal climatic conditions
D. Tardif et al.: The origin of Asian monsoons: a modelling perspective 857
Figure 7.Longitude–altitude profiles of the relative humidity (shaded) and vertical winds (vectors) for the (a, c) EOC4X and (b, d) control simulation, at (a, b) 40◦N and (c, d) 20◦N. Values are taken from the month of July.
Figure 8.JJA Air Temperature (in kelvin) at 300 mbar for EOC4X (a) and control (b) with contours overlaid each degree.
during the late–middle Eocene (Fig. 10a) as follows: (1) the Tarim region (Bougeois et al., 2018); (2) the Xining Basin, located at the interface between the zones of influence of the modern westerlies and of the EAM (Meijer et al., 2019); (3) the Maoming and Changchang basins in southeastern China (Herman et al., 2017; Spicer et al., 2016), located in the transition zone between EAM and I-AM; (4) the Jiuziyan Formation (Sorrel et al., 2017) and finally (5) the Pondaung Formation in Myanmar (Licht et al., 2014b), presently lo-cated in the area of influence of the SAM. Although we
lack Indian sites suggesting the presence of the SAM in the late Eocene, we acknowledge that such sites do exist for the early Eocene (i.e. the Guhra mine in Rajasthan, Shukla et al., 2014).
When compared to our model results, most of the evapor-ite deposits and highlighted localities are found in regions of strong seasonality (3W / 3D > 5; purple outline in Fig. 10a), except for the Myanmar site located in a more ever-wet con-text and the Tarim region, which experiences a mostly ever-dry climatic context. As many of these highlighted localities
Figure 9.Application of the Webster and Yang Index (on the re-gion 40–110◦E, 0–20◦N) and comparison of the results obtained for EOC4X (black), control simulation (dotted) and reanalysis (pur-ple).
stand on the edge of our simulated arid zone, we suggest that the extension of this region might be modulated by orbital forcing, as both models and data seem to suggest (Abels et al., 2011; Licht et al., 2014a; Sloan and Morrill, 1998; Zhang et al., 2012), which should be the topic of further investiga-tions. Inversely, most coal-bearing deposits stand in regions of very low seasonality and relatively high MAP (south-ern India, south(south-ern Myanmar, northeast(south-ern China), although some discrepancies remain in northern India and Bengal re-gions, which could be linked to the aforementioned dry bias of the model and/or to regional bias induced by specific coal depositional environment. The comparison of coal and evap-orites deposits to late Eocene MAP, although less reliable for the reasons mentioned above, follow a comparable pattern, as most of the coals settle in regions of relatively high MAP (> 1000 mm yr−1), while the evaporites, on the other hand, are present in drier locations (Fig. S7).
These results, together with the previously shown wind patterns highlight that Eocene seasonality and wind regimes might have been substantially different from modern condi-tions. We argue that high seasonality criteria (3W / 3D or similar) may equally result from SAM, EAM or ITCZ sea-sonality (WNPM or I-AM) and therefore hardly discrimi-nate between these different mechanisms. This ambiguity is also apparent in the proxy records. For example, mark-ers of highly seasonal precipitations found in Myanmar were successively interpreted as indicators of a modern-like SAM (Licht et al., 2014a), then to a migrating ITCZ-driven mon-soonal rainfall due to revised palaeolatitude of the Myanmar terrain (Westerweel et al., 2019). Additional seasonality data in targeted areas as well as the application of new techniques on fossil leaves (Spicer et al., 2016) that are promising in their ability to distinguish between the different seasonal sig-nals (ITCZ, SAM, EAM) might in this regard bring mean-ingful insights into new and existing sites and together with
modelling results help resolve the question of the monsoons initiation timing.
4.2 What drove the inception of Asian monsoons?
The atmosphere dynamics over Asia in our Eocene simula-tion present significant differences relative to modern condi-tions. It indicates the existence of a latitudinal extensive arid zone over northern India and central Asia bordered by ar-eas of highly sar-easonal precipitation; however our results do not produce monsoonal circulations in the modern sense. The absence of a true palaeo-monsoon contrasts with the findings reported in some previous Eocene modelling studies, but a large arid zone is consistent with other model studies of the Eocene or other time periods as detailed below. This interest-ingly suggests that the boundary conditions necessary for the inception of monsoon-like circulations may have occurred within this broad greenhouse timeframe and, more impor-tantly, that the monsoon-triggering conditions may be deter-mined by comparing these various model studies with our results and proxy data. Indeed, each study has its own mod-elling setup, and differences in the results might come from the choice of model, the model resolution and/or the bound-ary conditions that were used. If all of the CMIP5 generation models, except for CCSM4, experience the same dry bias in Asia when compared to modern observations (Valdes et al., 2017) and if a better resolution appears to have limited impact on the outcoming results (Huber and Goldner, 2012; Li et al., 2018), the palaeogeography is a key point to con-sider. Indeed, recent studies suggest that palaeogeography is the key driver shaping eastern Asian climate (Farnsworth et al., 2019) and Lunt et al. (2016) further showed that palaeo-geographic changes observed during the Eocene could be re-sponsible for mean annual temperature changes that might be as high as ±6◦C.
Several main diverging palaeogeographic characteristics stand out between all the available modelling studies regard-ing the Eocene. First is the position of the Indian continent, which either is fully disconnected from Asia and in an equa-torial position (Huber and Goldner, 2012; Zhang et al., 2012) or has already collided with Asia (this study; Li et al., 2018; Licht et al., 2014a; Zhang et al., 2018). Second, the orienta-tion and the latitude of HTP significantly differ from a study to another (Huber and Goldner, 2012; Licht et al., 2014a; Zhang et al., 2018). Third is the Turgai Strait, which is ei-ther represented as open (Li et al., 2018; Licht et al., 2014a; Zhang et al., 2012) or closed (this study, Huber and Gold-ner, 2012; Zhang et al., 2018). Fourth is the elevation of oriental Siberia, which displays variable elevation ranging from < 1000 m (this study, Huber and Goldner, 2012; Zhang et al., 2012) to more mountainous (1000 to 2000 m) con-figurations (Li et al., 2018; Licht et al., 2014a; Zhang et al., 2018). Given that some of these key features of the late Eocene palaeogeography are still highly debated (Kapp and DeCelles, 2019, for a review), we propose below a short
re-D. Tardif et al.: The origin of Asian monsoons: a modelling perspective 859
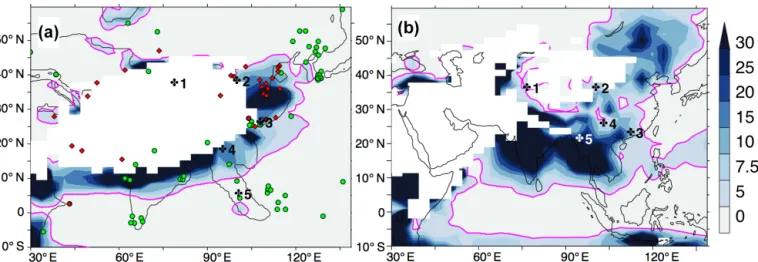
Figure 10.The 3W / 3D ratio for the (a) EOC4X and (b) control simulations. Regions receiving less than 1 mm d−1are kept blank. Overlaid magenta outline corresponds to the value 3W / 3D = 5, considered as minimum value in modern monsoonal regions. We also highlight evaporite (red diamonds) and coal deposits (green circles) from Boucot et al. (2013), as well as the five highlighted regions described in the text.
view of previous studies and the possible impact of varying boundary conditions on resulting Asian climate.
There are competitive models for the evolution of the In-dian foreland seaway, with some predicting the presence of a deep sea between continental India and Asia (van Hinsber-gen et al., 2012; Jagoutz et al., 2015) or an epicontinental sea (DeCelles et al., 1998) in the early and middle Eocene. However, geological evidence indicates that the Indian fore-land seaway would have dried out by 40 million years (Naj-man et al., 2008) and terrestrial connection is suggested even earlier, around 53.7 Ma, according to palaeontological evi-dence based on mammalian fossils (Clementz et al., 2011). In that aspect, the existence of a seaway between India and Asia (Huber and Goldner, 2012; Zhang et al., 2012) is clearly representative of the early Eocene. Regardless of the exact timing for the complete emergence of Greater India, the pres-ence of a seaway in these warm low latitudes certainly rep-resents an important water vapour source to the surround-ing regions (Tibetan Plateau, northern India, and Bengal) and could therefore reduce the aridity of this area.
Interestingly, the Tethys/Paratethys region from Huber and Goldner (2012) presents more similarities with the early Miocene, as northern Africa and Arabia are fully emerged, while the remnants of the Paratethys sea in Europe are re-duced to small inner seas. We hypothesize that the increased continentality in Europe and northern Africa in their ex-periment may contribute to preventing the formation of a Tethysian anticyclone (as simulated in the present study), hence generating atmospheric circulation more similar to modern conditions. On the other hand, also with the use of an early Eocene Indo-Asian configuration but a broader Tethys ocean and Paratethys sea, Zhang et al. (2012) obtain results that are more similar to ours in terms of sea level pres-sure and seasonal winds. This supports the importance of the
Paratethys extension in shaping Asian climate, which was already suggested by previous studies (Fluteau et al., 1999; Ramstein et al., 1997; Zhang et al., 2007).
Recent findings suggest that the latitudinal position of the TP exert a control over Eocene Asian climate, espe-cially summer wind patterns (Zhang et al., 2018) and there-fore add another level of uncertainty given that the loca-tion and elevaloca-tion of the TP in the Eocene is still debated (Botsyun et al., 2019; Wang et al., 2014). When oriented in a NW–SE direction and located between 10 and 20◦N, the TP blocks summer equatorial winds transporting mois-ture northward and enhances orographic precipitations over the southern flank of the TP, while westerly winds coming from the Paratethys cross central Asia without encounter-ing major orographic barriers (Licht et al., 2014a; Zhang et al., 2018). On the contrary, configurations with a modern TP position (between 30 and 40◦N) deviate the westerlies com-ing from the Paratethys into a counter-clockwise flow around the southern flank of the TP (this study; Zhang et al., 2018).
The Turgai Strait configuration and oriental Siberian palaeotopography might also have a significant impact on the simulated Asian climate. An open Turgai Strait (Li et al., 2018; Licht et al., 2014a; Zhang et al., 2012) maintains a connection between the warm Paratethys sea and the colder Northern Sea and might result in an increased land–sea ther-mal gradient in the western Asian midlatitudes by cooling the Paratethys. Providing that the seaway is deep enough to allow for such heat exchanges, it could amplify the land–sea breeze phenomenon in summer between the Paratethys and the Asian continent and play a part in the central Asian water budget. A more mountainous configuration of inner Siberia (Li et al., 2018; Licht et al., 2014a; Zhang et al., 2018) might generate colder winter temperatures and create the conditions required for the inception of a proto-Siberian High in winter.
Although the closure of the Turgai Strait is estimated to occur around the mid-Eocene (Akhmetiev and Zaporozhets, 2014), Siberian palaeoelevation remains highly speculative, and, to our knowledge, neither have been the topics of in-depth mod-elling studies.
In summary, current knowledge about late Eocene Asian palaeogeography is not yet sufficient to discriminate be-tween the various model solutions obtained with different boundary conditions. Moreover, some models come to the same conclusions using different palaeogeographic recon-structions. This review, however, indicates and identifies po-tential palaeogeographic boundary conditions have driven the shift from arid zonal Asia to Asian monsoonal condi-tions. We also argue that a modelling intercomparison project focusing on late Eocene Asian climate, using similar bound-ary conditions and applying similar diagnostic criteria, would definitely be a valuable asset to the community to provide a consistent picture of the initiation and evolution of Asian monsoons from a modelling perspective.
5 Conclusion
The earth system model IPSL-CM5A2 is able to catch mod-ern Asian main climatic features and to produce Eocene cli-matic reconstructions, which seem realistic when compared to proxy SST estimates and are comparable to recent stud-ies that proposed a global climate reconstruction for this time period using earth system models (Baatsen et al., 2018; Hutchinson et al., 2018; Inglis et al., 2015). Our results point out notable differences in terms of wind patterns and precip-itation amounts in Asia when compared to modern circula-tion, suggesting that no SAM or EAM were occurring at that time, although highly seasonal climate is modelled in these regions. Our climate simulation rather proposes the existence of a wide arid zone in northern India and central Asia, due to the presence of strong subsiding winds in the midtropo-sphere, preventing the moist air coming from the Equator to condensate and precipitate over the continent. These simula-tions suggest that these condisimula-tions prevailed before the setup of the modern SAM and EAM, more likely appearing after the late Eocene, by contrast to what is found in other sim-ulations (e.g. Huber and Goldner, 2012). If the existence of this arid climate is closely linked to the late Eocene palaeo-geography, the scarcity of palaeo data in this simulated arid region remains a limitation.
We suggest that investigating the precise period when Asia transitioned from arid zonal climate to modern-like mon-soonal climate would require collecting data in this spe-cific arid area. Ultimately, we believe that additional simu-lations performed using different models forced by identical boundary conditions as well as new Palaeogene records from Asia (especially in southeastern Asia and India) are needed to draw more precise conclusions about the appearance of Asian monsoons and their potential existence in that period.
Also, more recently developed modelling techniques could be very promisingly applied as a complement to complex climatic modelling reconstructions. For example, isotopic-enabled models, by simulating palaeoprecipitation δ18O, al-low a direct comparison of the model output to δ18O values that can be measured in a wide variety of proxies (shells, car-bonates, etc.) and therefore provide robust physical mecha-nisms to explain the measured patterns (Botsyun et al., 2019; Brady et al., 2019; Poulsen et al., 2010; Risi et al., 2010). Ad-ditionally, the application of proxy forward modelling meth-ods (Evans et al., 2013; Schmidt, 1999), by mimicking the mechanisms through which a particular proxy will record a climatic perturbation (e.g. the translation of water δ18O vari-ations by planktonic foraminifera) taking into account the specificity of the proxy (e.g. ecology of the foraminifera, episodes of secondary calcification and dissolution) and the time uncertainty could contribute greatly to help fill the gap between proxy records and model results.
Code availability. LMDZ, XIOS, NEMO and ORCHIDEE are released under the terms of the CeCILL license. OASIS-MCT is released under the terms of the Lesser GNU General Public License (LGPL). IPSL-CM5A2 code is publicly avail-able through svn, with the following command lines: svn co http://forge.ipsl.jussieu.fr/igcmg/svn/modipsl/branches/ publications/IPSLCM5A2.1_11192019 (last access: 20 April 2020, IPSL Climate Modelling Centre, 2020a) modipsl cd modipsl/util;./model IPSLCM5A2.1
The mod.def file provides information regarding the different re-visions used, namely
- NEMOGCMbranchnemo_v3_6_STABLErevision6665 – XIOS2branchs/xios-2.5revision1763 - IOIPSL/srcsvntags/v2_2_2 - LMDZ5branches/IPSLCM5A2.1rev3591 - branches/publications/ORCHIDEE_IPSLCM5A2.1.r5307rev6336 – OASIS3-MCT2.0_branch(rev4775IPSLserver)
The login/password combination requested at first use to down-load the ORCHIDEE component is anonymous/anonymous. We recommend referring to the project website http://forge.ipsl.jussieu. fr/igcmg_doc/wiki/Doc/Config/IPSLCM5A2 (last access: 20 April 2020, IPSL Climate Modelling Centre, 2020b) for a proper instal-lation and compiinstal-lation of the environment.
Supplement. The supplement related to this article is available online at: https://doi.org/10.5194/cp-16-847-2020-supplement.
Author contributions. DTB, YD and JBL conducted the Eocene experiments. DTB, FF, YD and GLH analysed the results and real-ized the discussion.
PS, JBL and YD developed the AOGCM version used in this work. FP and GDN reconstructed the Eocene palaeogeography.
The discussion was further enhanced by the contributions of AL (model–data discussion). PS conducted the control simulation and
D. Tardif et al.: The origin of Asian monsoons: a modelling perspective 861
enhanced the model description and the comparison of the control simulation results with GPCP observations and ERA40 reanalysis. All coauthors contributed to the writing the paper.
Competing interests. The authors declare that they have no con-flict of interest.
Acknowledgements. The authors thank the two anonymous re-viewers and the editor who helped improve the quality of this pa-per. Delphine Tardif, Guillaume Le Hir and Frédéric Fluteau were granted access to the HPC resources of TGCC under the alloca-tion 2018-A0050107601 made by GENCI and acknowledge support from INSU-CNRS TelluS-Syster Paleomonsoon grant. Guillaume Dupont-Nivet acknowledges support from ERC MAGIC (grant no. 649081). This is IPGP contribution 4115.
Financial support. This research has been supported by the INSU-CNRS TelluS-Syster Paleomonsoon grant and by the ERC MAGIC (grant no. 649081).
Review statement. This paper was edited by Ran Feng and re-viewed by two anonymous referees.
References
Abels, H. A., Dupont-Nivet, G., Xiao, G., Bosboom, R., and Krijgs-man, W.: Step-wise change of Asian interior climate preceding the Eocene–Oligocene Transition (EOT), Palaeogeogr. Palaeocl., 299, 399–412, https://doi.org/10.1016/j.palaeo.2010.11.028, 2011.
Akhmetiev, M. A. and Zaporozhets, N. I.: Paleogene events in Central Eurasia: their role in the flora and vegeta-tion cover evoluvegeta-tion, migravegeta-tion of phytochore boundaries, and climate changes, Stratigr. Geol. Correl., 22, 312–335, https://doi.org/10.1134/S0869593814030022, 2014.
Akhmets’ev, M. A. and Beniamovski, V. N.: The Paleocene and Eocene in the Russian part of West Eurasia, Stratigr. Geol. Cor-rel., 14, 49–72, https://doi.org/10.1134/S0869593806010047, 2006.
Anagnostou, E., John, E. H., Edgar, K. M., Foster, G. L., Ridg-well, A., Inglis, G. N., Pancost, R. D., Lunt, D. J., and Pear-son, P. N.: Changing atmospheric CO2 concentration was the
primary driver of early Cenozoic climate, Nature, 533, 380–384, https://doi.org/10.1038/nature17423, 2016.
Baatsen, M., van Hinsbergen, D. J. J., von der Heydt, A. S., Di-jkstra, H. A., Sluijs, A., Abels, H. A., and Bijl, P. K.: Recon-structing geographical boundary conditions for palaeoclimate modelling during the Cenozoic, Clim. Past, 12, 1635–1644, https://doi.org/10.5194/cp-12-1635-2016, 2016.
Baatsen, M., von der Heydt, A. S., Huber, M., Kliphuis, M. A., Bijl, P. K., Sluijs, A., and Dijkstra, H. A.: Equilibrium state and sensi-tivity of the simulated middle-to-late Eocene climate, Clim. Past Discuss., https://doi.org/10.5194/cp-2018-43, 2018.
Bannon, P. R.: On the Dynamics of the East African Jet. I: Simulation of Mean Conditions for July, J. At-mos. Sci., 36, 2139–2152, https://doi.org/10.1175/1520-0469(1979)036<2139:OTDOTE>2.0.CO;2, 1979.
Beerling, D. J. and Royer, D. L.: Convergent cenozoic CO2history,
Nat. Geosci., 4, 418–420, 2011.
Boos, W. R. and Kuang, Z.: Dominant control of the South Asian monsoon by orographic insulation versus plateau heating, Na-ture, 463, 218–222, https://doi.org/10.1038/nature08707, 2010. Bosboom, R., Mandic, O., Dupont-Nivet, G., Proust, J.-N.,
Or-mukov, C., and Aminov, J.: Late Eocene palaeogeography of the proto-Paratethys Sea in Central Asia (NW China, southern Kyr-gyzstan and SW Tajikistan), Geol. Soc. Spec. Publ., 427, 565– 588, https://doi.org/10.1144/SP427.11, 2017.
Botsyun, S., Sepulchre, P., Donnadieu, Y., Risi, C., Licht, A., and Caves Rugenstein, J. K.: Revised paleoaltimetry data show low Tibetan Plateau elevation during the Eocene, Science, 363, eaaq1436, https://doi.org/10.1126/science.aaq1436, 2019. Boucot, A. J., Xu, C., Scotese, C. R., and Morley, R. J.:
Phanero-zoic Paleoclimate: An Atlas of Lithologic Indicators of Climate, SEPM (Society for Sedimentary Geology), Tulsa, Oklahoma, USA, 2013.
Bougeois, L., Dupont-Nivet, G., de Rafélis, M., Tindall, J. C., Proust, J.-N., Reichart, G.-J., de Nooijer, L. J., Guo, Z., and Or-mukov, C.: Asian monsoons and aridification response to Pale-ogene sea retreat and NePale-ogene westerly shielding indicated by seasonality in Paratethys oysters, Earth Planet. Sc. Lett., 485, 99– 110, https://doi.org/10.1016/j.epsl.2017.12.036, 2018.
Brady, E., Stevenson, S., Bailey, D., Liu, Z., Noone, D., Nusbaumer, J., Otto-Bliesner, B. L., Tabor, C., Tomas, R., Wong, T., Zhang, J., and Zhu, J.: The Connected Isotopic Water Cycle in the Com-munity Earth System Model Version 1, J. Adv. Model. Earth Sy., 11, 2547–2566, https://doi.org/10.1029/2019MS001663, 2019. Cerling, T. E., Wang, Y., and Quade, J.: Expansion of C4
ecosys-tems as an indicator of global ecological change in the late Miocene, Nature, 361, 344–345, 1993.
Clementz, M., Bajpai, S., Ravikant, V., Thewissen, J. G. M., Saravanan, N., Singh, I. B., and Prasad, V.: Early Eocene warming events and the timing of terrestrial fau-nal exchange between India and Asia, Geology, 39, 15–18, https://doi.org/10.1130/G31585.1, 2011.
Contoux, C., Ramstein, G., and Jost, A.: Modelling the mid-Pliocene Warm Period climate with the IPSL coupled model and its atmospheric component LMDZ5A, Geosci. Model Dev., 5, 903–917, https://doi.org/10.5194/gmd-5-903-2012, 2012. DeCelles, P. G., Gehrels, G. E., Quade, J., and Ojha, T. P.:
Eocene-early Miocene foreland basin development and the history of Himalayan thrusting, western and central Nepal, Tectonics, 17, 741–765, https://doi.org/10.1029/98TC02598, 1998.
DeConto, R. M. and Pollard, D.: A coupled climate–ice sheet modeling approach to the Early Cenozoic history of the Antarctic ice sheet, Palaeogeogr. Palaeocl., 198, 39–52, https://doi.org/10.1016/S0031-0182(03)00393-6, 2003. d’Orgeval, T., Polcher, J., and de Rosnay, P.: Sensitivity of
the West African hydrological cycle in ORCHIDEE to in-filtration processes, Hydrol. Earth Syst. Sci., 12, 1387–1401, https://doi.org/10.5194/hess-12-1387-2008, 2008.
Dufresne, J.-L., Foujols, M.-A., Denvil, S., Caubel, A., Marti, O., Aumont, O., Balkanski, Y., Bekki, S., Bellenger, H., Benshila,
R., Bony, S., Bopp, L., Braconnot, P., Brockmann, P., Cadule, P., Cheruy, F., Codron, F., Cozic, A., Cugnet, D., de Noblet, N., Duvel, J.-P., Ethé, C., Fairhead, L., Fichefet, T., Flavoni, S., Friedlingstein, P., Grandpeix, J.-Y., Guez, L., Guilyardi, E., Hauglustaine, D., Hourdin, F., Idelkadi, A., Ghattas, J., Jous-saume, S., Kageyama, M., Krinner, G., Labetoulle, S., Lahel-lec, A., Lefebvre, M.-P., Lefevre, F., Levy, C., Li, Z. X., Lloyd, J., Lott, F., Madec, G., Mancip, M., Marchand, M., Masson, S., Meurdesoif, Y., Mignot, J., Musat, I., Parouty, S., Polcher, J., Rio, C., Schulz, M., Swingedouw, D., Szopa, S., Talandier, C., Terray, P., Viovy, N., and Vuichard, N.: Climate change projections us-ing the IPSL-CM5 Earth System Model: from CMIP3 to CMIP5, Clim. Dynam., 40, 2123–2165, https://doi.org/10.1007/s00382-012-1636-1, 2013.
Emanuel, K. A., Neelin, J. D., and Bretherton, C. S.: On large-scale circulations in convecting atmospheres, Q. J. Roy. Meteor. Soc., 120, 1111–1143, https://doi.org/10.1002/qj.49712051902, 1994. Evans, M. N., Tolwinski-Ward, S. E., Thompson, D. M., and An-chukaitis, K. J.: Applications of proxy system modeling in high resolution paleoclimatology, Quaternary Sci. Rev., 76, 16–28, https://doi.org/10.1016/j.quascirev.2013.05.024, 2013.
Farnsworth, A., Lunt, D. J., Robinson, S. A., Valdes, P. J., Roberts, W. H. G., Clift, P. D., Markwick, P., Su, T., Wrobel, N., Bragg, F., Kelland, S.-J., and Pancost, R. D.: Past East Asian mon-soon evolution controlled by paleogeography, not CO2, Science
Advances, 5, eaax1697, https://doi.org/10.1126/sciadv.aax1697, 2019.
Feng, R. and Poulsen, C. J.: Refinement of Eocene lapse rates, fossil-leaf altimetry, and North American Cordilleran surface elevation estimates, Earth Planet. Sc. Lett., 436, 130–141, https://doi.org/10.1016/j.epsl.2015.12.022, 2016.
Fluteau, F., Ramstein, G., and Besse, J.: Simulating the evolution of the Asian and African monsoons during the past 30 Myr using an atmospheric general circulation model, J. Geophys. Res., 104, 11995–12018, https://doi.org/10.1029/1999JD900048, 1999. Frauenfeld, O. W.: Climate change and variability using European
Centre for Medium-Range Weather Forecasts reanalysis (ERA-40) temperatures on the Tibetan Plateau, J. Geophys. Res., 110, D02101, https://doi.org/10.1029/2004JD005230, 2005. Gasson, E., Lunt, D. J., DeConto, R., Goldner, A., Heinemann, M.,
Huber, M., LeGrande, A. N., Pollard, D., Sagoo, N., Siddall, M., Winguth, A., and Valdes, P. J.: Uncertainties in the modelled CO2threshold for Antarctic glaciation, Clim. Past, 10, 451–466,
https://doi.org/10.5194/cp-10-451-2014, 2014.
Gough, D. O.: Solar Interior Structure and Luminosity Variations, in: Physics of Solar Variations, edited by: Domingo, V., Springer Netherlands, Dordrecht, 21–34, 1981.
Grimm, G. W. and Potts, A. J.: Fallacies and fantasies: the theoretical underpinnings of the Coexistence Approach for palaeoclimate reconstruction, Clim. Past, 12, 611–622, https://doi.org/10.5194/cp-12-611-2016, 2016.
Guo, Z. T., Ruddiman, W. F., Hao, Q. Z., Wu, H. B., Qiao, Y. S., Zhu, R. X., Peng, S. Z., Wei, J. J., Yuan, B. Y., and Liu, T. S.: Onset of Asian desertification by 22 Myr ago in-ferred from loess deposits in China, Nature, 416, 159–163, https://doi.org/10.1038/416159a, 2002.
Herman, A. B., Spicer, R. A., Aleksandrova, G. N., Yang, J., Kodrul, T. M., Maslova, N. P., Spicer, T. E. V., Chen, G., and Jin, J.-H.: Eocene–early Oligocene climate
and vegetation change in southern China: Evidence from the Maoming Basin, Palaeogeogr. Palaeocl., 479, 126–137, https://doi.org/10.1016/j.palaeo.2017.04.023, 2017.
Herold, N., Buzan, J., Seton, M., Goldner, A., Green, J. A. M., Müller, R. D., Markwick, P., and Huber, M.: A suite of early Eocene (∼ 55 Ma) climate model boundary conditions, Geosci. Model Dev., 7, 2077–2090, https://doi.org/10.5194/gmd-7-2077-2014, 2014.
Ho, S. L. and Laepple, T.: Flat meridional temperature gradient in the early Eocene in the subsurface rather than surface ocean, Nat. Geosci., 9, 606–610, https://doi.org/10.1038/ngeo2763, 2016. Hourdin, F., Foujols, M.-A., Codron, F., Guemas, V., Dufresne,
J.-L., Bony, S., Denvil, S., Guez, J.-L., Lott, F., Ghattas, J., Braconnot, P., Marti, O., Meurdesoif, Y., and Bopp, L.: Impact of the LMDZ atmospheric grid configuration on the climate and sensitivity of the IPSL-CM5A coupled model, Clim. Dynam., 40, 2167–2192, https://doi.org/10.1007/s00382-012-1411-3, 2013.
Huber, M. and Caballero, R.: The early Eocene equable climate problem revisited, Clim. Past, 7, 603–633, https://doi.org/10.5194/cp-7-603-2011, 2011.
Huber, M. and Goldner, A.: Eocene monsoons, J. Asian Earth Sci., 44, 3–23, https://doi.org/10.1016/j.jseaes.2011.09.014, 2012. Hutchinson, D. K., de Boer, A. M., Coxall, H. K., Caballero, R.,
Nilsson, J., and Baatsen, M.: Climate sensitivity and merid-ional overturning circulation in the late Eocene using GFDL CM2.1, Clim. Past, 14, 789–810, https://doi.org/10.5194/cp-14-789-2018, 2018.
Inglis, G. N., Farnsworth, A., Lunt, D., Foster, G. L., Hollis, C. J., Pagani, M., Jardine, P. E., Pearson, P. N., Markwick, P., Galswor-thy, A. M. J., Raynham, L., Taylor, K. W. R., and Pancost, R. D.: Descent toward the Icehouse: Eocene sea surface cooling in-ferred from GDGT distributions, Paleoceanography, 30, 1000– 1020, https://doi.org/10.1002/2014PA002723, 2015.
IPSL Climate Modeling Centre: IPSL-CM5A-VLR branche IP-SLCM5A2.1_11192019, available at: http://forge.ipsl.jussieu. fr/igcmg/svn/modipsl/branches/publications/IPSLCM5A2.1_ 11192019, last access: 20 April 2020a.
IPSL Climate Modeling Centre: IPSL climate models documen-tation, available at: http://forge.ipsl.jussieu.fr/igcmg_doc/wiki/ Doc/Config/IPSLCM5A2 last access: 20 April 2020b.
Jagoutz, O., Royden, L., Holt, A. F., and Becker, T. W.: Anomalously fast convergence of India and Eurasia caused by double subduction, Nat. Geosci., 8, 475–478, https://doi.org/10.1038/ngeo2418, 2015.
Kageyama, M., Braconnot, P., Bopp, L., Caubel, A., Foujols, M.-A., Guilyardi, E., Khodri, M., Lloyd, J., Lombard, F., Mariotti, V., Marti, O., Roy, T., and Woillez, M.-N.: Mid-Holocene and Last Glacial Maximum climate simulations with the IPSL model–part I: comparing IPSL_CM5A to IPSL_CM4, Clim. Dynam., 40, 2447–2468, https://doi.org/10.1007/s00382-012-1488-8, 2013. Kapp, P. and DeCelles, P. G.: Mesozoic–Cenozoic
geo-logical evolution of the Himalayan-Tibetan orogen and working tectonic hypotheses, Am. J. Sci., 319, 159–254, https://doi.org/10.2475/03.2019.01, 2019.
Kaya, M. Y., Dupont-Nivet, G., Proust, J., Roperch, P., Bougeois, L., Meijer, N., Frieling, J., Fioroni, C., Özkan Altýner, S., Var-dar, E., Barbolini, N., Stoica, M., Aminov, J., Mamtimin, M., and Zhaojie, G.: Paleogene evolution and demise of the proto-Paratethys Sea in Central Asia (Tarim and Tajik basins): Role of