HAL Id: pasteur-03259213
https://hal-pasteur.archives-ouvertes.fr/pasteur-03259213
Submitted on 13 Jun 2021
HAL is a multi-disciplinary open access
archive for the deposit and dissemination of
sci-entific research documents, whether they are
pub-lished or not. The documents may come from
teaching and research institutions in France or
abroad, or from public or private research centers.
L’archive ouverte pluridisciplinaire HAL, est
destinée au dépôt et à la diffusion de documents
scientifiques de niveau recherche, publiés ou non,
émanant des établissements d’enseignement et de
recherche français ou étrangers, des laboratoires
publics ou privés.
Distributed under a Creative Commons Attribution| 4.0 International License
To cite this version:
Miriam Labusch, Laure Mancini, David Morizet, Laure Bally-Cuif. Conserved and Divergent Features
of Adult Neurogenesis in Zebrafish. Frontiers in Cell and Developmental Biology, Frontiers media,
2020, 8, pp.525. �10.3389/fcell.2020.00525�. �pasteur-03259213�
Edited by: Flavio Zolessi, Universidad de la República, Uruguay Reviewed by: Raúl E. Russo, Instituto de Investigaciones Biológicas Clemente Estable (IIBCE), Uruguay Sepand Rastegar, Karlsruhe Institute of Technology (KIT), Germany *Correspondence: Laure Bally-Cuif laure.bally-cuif@pasteur.fr
†These authors have contributed
equally to this work Specialty section: This article was submitted to Stem Cell Research, a section of the journal Frontiers in Cell and Developmental Biology Received: 01 May 2020 Accepted: 03 June 2020 Published: 30 June 2020 Citation: Labusch M, Mancini L, Morizet D and Bally-Cuif L (2020) Conserved and Divergent Features of Adult Neurogenesis in Zebrafish. Front. Cell Dev. Biol. 8:525. doi: 10.3389/fcell.2020.00525
Conserved and Divergent Features of
Adult Neurogenesis in Zebrafish
Miriam Labusch1,2†, Laure Mancini1,2†, David Morizet1,2†and Laure Bally-Cuif1*
1Zebrafish Neurogenetics Unit, Institut Pasteur, UMR 3738, CNRS, Team Supported by the Ligue Nationale Contre le
Cancer, Paris, France,2Sorbonne Université, Collège Doctoral, Paris, France
Adult neurogenesis, i.e., the generation of neurons from neural stem cells (NSCs) in the adult brain, contributes to brain plasticity in all vertebrates. It varies, however, greatly in extent, location and physiological characteristics between species. During the last decade, the teleost zebrafish (D. rerio) was increasingly used to study the molecular and cellular properties of adult NSCs, in particular as a prominent NSC population was discovered at the ventricular surface of the dorsal telencephalon (pallium), in territories homologous to the adult neurogenic niches of rodents. This model, for its specific features (large NSC population, amenability to intravital imaging, high regenerative capacity) allowed rapid progress in the characterization of basic adult NSC features. We review here these findings, with specific comparisons with the situation in rodents. We specifically discuss the cellular nature of NSCs (astroglial or neuroepithelial cells), their heterogeneities and their neurogenic lineages, and the mechanisms controlling NSC quiescence and fate choices, which all impact the neurogenic output. We further discuss the regulation of NSC activity in response to physiological triggers and non-physiological conditions such as regenerative contexts.
Keywords: neural stem cell, zebrafish, pallium, adult neurogenesis, quiescence, radial glia, cell fate choice decisions
Adult neurogenesis, first identified as such in birds (Goldman and Nottebohm, 1983), has been documented in all vertebrate species studied (Altman and Das, 1965;Eriksson et al., 1998;Byrd and Brunjes, 2001;Suh et al., 2007). The persistence of neuronal production in the adult brain is the product of specialized neural precursor cells, the neural stem cells (NSCs). In rodents, newly-born neurons are physiologically important for the plasticity of specific circuits, notably involved in learning and memory, and impaired adult neurogenesis can correlate with emotional disorders (Anacker and Hen, 2017; Jorgensen, 2018;Toda et al., 2019). NSCs have also been postulated to be at the origin of some brain tumors (Fan et al., 2019;Matarredona and Pastor, 2019). The fundamental importance of NSCs stimulated an explosive research field during the last 20-years, and, more recently, the development of a new study model: the zebrafish adult brain. The large amount of adult NSCs in this system, their widespread distribution and varied properties, and their reactivity toward regeneration, all propelled the zebrafish model to the forefront of adult NSC research, as a complementary and synergistic model to rodents (Anand and Mondal, 2017;
Lindsey et al., 2018;Zambusi and Ninkovic, 2020). The time to reach sexual maturity in zebrafish (3 months) and the adult lifespan also approximate those of mouse, allowing to draw direct temporal parallels. With specific focus on NSCs of the dorsal telencephalon, we will review here
these different attributes, stressing the contribution of the zebrafish model to understand basic NSC properties such as their lineages, quiescence, fate choices, heterogeneities, population behavior and their physiological and pathological recruitment.
NEURAL STEM CELLS: A VARIETY OF
PROGENITOR CELL SUBTYPES DRIVE
NEUROGENESIS IN THE ADULT
ZEBRAFISH CENTRAL NERVOUS
SYSTEM
Active Neurogenesis From Multiple
Neurogenic Niches
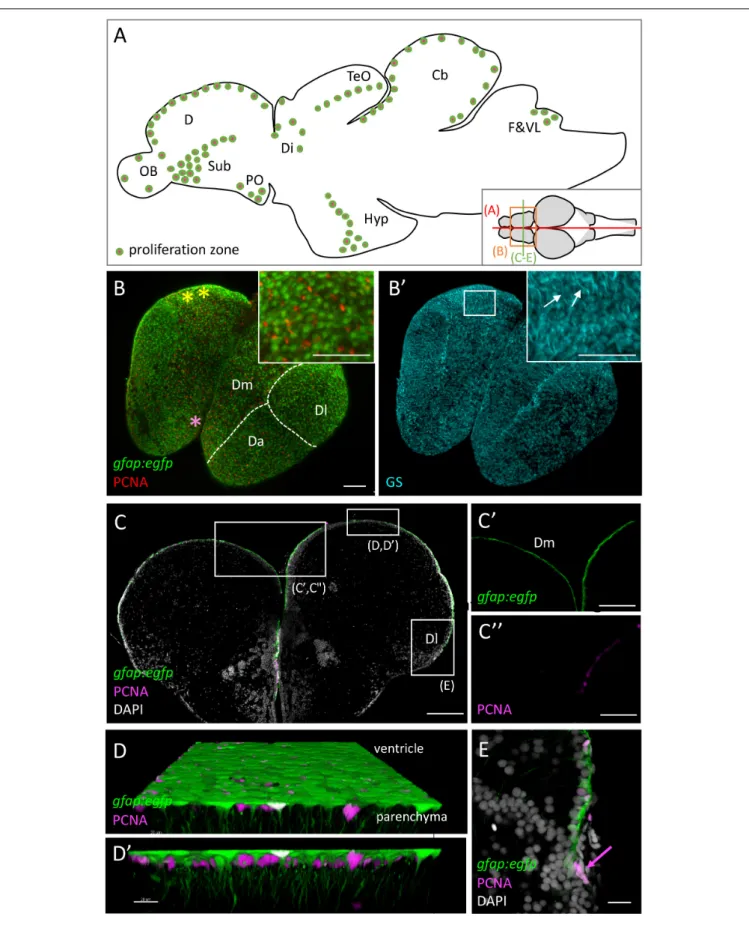
The persistent and widespread neurogenic activity of the zebrafish adult brain was first recognized using classical tracing methods employing thymidine analogs: 16 proliferation domains, present across all brain subdivisions, proved to be at the origin of neurons within a few weeks of chase (Figure 1A; Adolf et al., 2006; Grandel et al., 2006). Using similar approaches, physiologically silent but activatable neural progenitors were also identified in the adult zebrafish spinal cord (Reimer et al., 2009). These constitutive and facultative neurogenic niches raised important interest. Indeed, by their variety, they permit comprehensive comparisons of neurogenic progenitor identities and properties, and of neurogenesis modes, in the adult vertebrate central nervous system.
We will focus in this review on adult neurogenesis in the zebrafish telencephalon, which hosts the territories homologous to two main neurogenic niches of adult rodents: the ependymal zone of the lateral ventricle (SEZ) and the sub-granular zone (SGZ) of the dentate gyrus of the hippocampus [for completeness on other territories, the reader is referred to other recent reviews or articles (Than-Trong and Bally-Cuif, 2015;Anand and Mondal, 2017;Lindsey et al., 2018)]. Following a process of eversion, likely involving both morphogenetic cell shape changes and anisotropic growth, the ventricle of the zebrafish dorsal telencephalon (pallium) becomes exposed dorsally, covered by an enlarged choroid plexus, with its dorsal midline flipped to lateral positions (Folgueira et al., 2012). This results in a medio-lateral inversion of homologous pallial territories between zebrafish and mammals. A tentative correspondence, based on ontogenetic and functional grounds, has been proposed (von Trotha et al., 2014;Dray et al., 2015;Ganz et al., 2015).
Neural Stem Cells and Neural
Progenitors in the Adult Zebrafish
Telencephalon
A variety of genetic and non-genetic tracing methods (Table 1), coupled with precise immunohistochemical or molecular characterizations, identified several neural progenitor subtypes in the adult zebrafish telencephalon. Some of them, notably radial glia (RG) of the pallium, are considered NSCs (discussion
of the “NSC” versus “neural progenitor” nomenclature in
Box 1, and see below).
Pallial Radial Glial Cells Are Molecularly and Cellularly Similar to Rodent Adult NSCs
Pallial RG are organized as a tight monolayer with their cell bodies lining the pallial ventricle. They exhibit overt apico-basal polarity, exposing a small apical membrane domain to the cerebrospinal fluid and extending a long and highly branched basolateral process across the pallial parenchyma (Figures 1C–D’). Pallial RG express astroglial markers (Glial Fibrilary Acidic Protein - gfap-, Brain Lipid-Binding Protein - blbp-, Nestin, Glutamine Synthetase -GS-) as well as S100β, which highlights NSCs and ependymal cells in rodents, and Aromatase B (Adolf et al., 2006;Grandel et al., 2006;Pellegrini et al., 2007; März et al., 2010a). Parenchymal astrocytes are absent from the adult zebrafish pallium before aging (Ogino et al., 2016); this observation and the expression of factors encoding astrocytic function in RG (GS, and the glutamate transporters Glast and Glt1) suggest that pallial RG serve the function of parenchymal astrocytes, and extend this function into the parenchyma via their basal process. Overall, the morphology and astroglial markers of pallial RG resemble those of adult NSCs in the mouse SEZ and SGZ (Than-Trong and Bally-Cuif, 2015). They also morphologically resemble radial glial cells of the developing mouse cortex, but differ from these in several other aspects such as their proliferation potential and activity, and their transcriptome (Götz et al., 2016) (and see below). In detail, distinct morphologies were described among pallial RG depending on their location (März et al., 2010a). To date, these differences have not been related to functional (whether astrocytic or stem) properties.
Like adult mouse NSCs, pallial RG co-express progenitor markers, such as the transcription factors Sox2, Hey1, and Her4 (mouse Hes5) (Kroehne et al., 2011; Than-Trong et al., 2018;
Than-Trong et al., 2020). Of these, only the function of Hey1 was tested to date in zebrafish, and shown to be necessary for the maintenance of progenitor potentialin vivo (Than-Trong et al., 2018). Hes5 (together with the related Hes factor Hes1) as well as Sox2 are, however, necessary for NSC maintenance in adult mouse (Ehm et al., 2010;Boareto et al., 2017;Sueda et al., 2019), and are likely to play a similar role in zebrafish.
At any given time, approximately 5% of pallial RG are found within the cell cycle (i.e., express the proliferation parkers PCNA or MCM2/5; these cells are referred to as “activated”). The remaining 95% are out of the cell cycle and interpreted as quiescent (see below) (Chapouton et al., 2010; März et al., 2010a). This interpretation as well as the self-renewal and neurogenic potential of the pallial RG population are supported by a number of converging arguments, including: (i) tracing assays demonstrating that individual RGs can oscillate between the activated and quiescent states, (ii) pharmacological assays or experimental injuries demonstrating that all, or most, RG can be brought into the activated state, (iii) genetic tracing identifying RG progeny at the individual and populational levels (Chapouton et al., 2010; März et al., 2010a; Kroehne et al., 2011; Alunni et al., 2013; Than-Trong et al., 2020). The latter
FIGURE 1 | Progenitor cells in the zebrafish adult brain at 3 months-post-fertilization (mpf). (A) Scheme of a mid-sagittal section (anterior left) showing the localization of proliferation zones (colored dots) (Adolf et al., 2006;Grandel et al., 2006). (B,B’) Dorsal view of a whole-mount telencephalon from a gfap:egfp transgenic animal, processed in triple immunohistochemistry for GFP, PCNA (B), and GS (B’). Anterior is bottom left. Note the continuous layer of progenitor cells visible from the dorsal surface. Pallial territories are indicated by the dotted lines (seeDray et al., 2015). Yellow stars indicate the location of the territory homologous to the hippocampus (Ganz et al., 2015, and seeRodríguez et al., 2002in goldfish), and the pink star the territory homologous to the amygdala (von Trotha et al., 2014). Anti-GS immunohistochemistry (B’) permits to see basal RG processes (arrows). (C–E) Cross-section of a telencephalon from a gfap:egfp transgenic animal, processed in double immunohistochemistry for GFP and PCNA and counter-stained with DAPI (C) and high magnifications of the domains boxed (C’,C”,E). In addition, a high magnification view of the ventricular zone of Dm is shown (D,D’) in 3D (Imaris software) to appreciate radial glial cell morphology. (E) Focus on NE progenitors at the pallial edge (arrow). Scale bars: (B,B’,C) 100 mm; (C’,C”) 30 mm; (D,D’) 20 mm; (E) 50 mm. Cb, cerebellum; D, dorsal part of the telencephalon (pallium) (Da: anterior part of D, Dm: medial part of D; Dl, lateral part of D); Di, diencephalon; F&VL, facial and vagal lobes; Hyp, hypothalamus; OB, olfactory bulb; PO, preoptic area; TeO, tectum opticum.
experiments are particularly important as they demonstrate that her4-positive RG generate both pallial neurons and persisting pallial RG that are themselves neurogenic. Thus, at least at the population level,her4-positive RG act as NSCs. For comparison, RG of the developing mouse cortex do not exhibit quiescence phase, and their neurogenic activity is limited to the embryonic period (Götz et al., 2016).
Non-glial Pallial Progenitors
In addition, non-glial neural progenitors (NPs) (negative for astroglial markers and forher4) are present interspersed among RGs along the pallial ventricle (Ganz et al., 2010; März et al., 2010a). NPs are identified as progenitors according to their expression of Sox2, the fact that around 50% of them co-express proliferation markers at any time, and their neurogenic fate (assessed by retroviral tracing at short term) (Rothenaigner et al., 2011;Than-Trong et al., 2020). Cre-lox tracing with short chase times indicates these cells originate from pallial RG ( Than-Trong et al., 2020). This population, however, lacks specific markers and to date was only relatively superficially analyzed. It is possibly heterogeneous, and in particular the properties of Sox2+;PCNA- cells have not been directly defined. NPs are classically considered equivalent to the Transit Amplifying Progenitors (TAPs) described in mouse (März et al., 2010a).
Neuroepithelial Progenitor Cells Are Maintained at the Adult Pallial Edge
Neuroepithelial (NE) cells are also present laterally and posteriorly at the junction of the pallium with the choroid plexus, a location corresponding to the dorsal midline (Figure 1E). These cells are ventricular and apico-basally polarized, express neither astroglial markers norher4, and are proliferating. Their lack of astroglial markers and her4 expression, and their cuboidal as opposed to radial shape, distinguish them from RG. “Negative” tracing of NE cells in the adult pallium, using as landmark a neighboring her4.1:ERT2CreERT2 traced domain, suggests that these cells generate neurogenic RG in the postero-lateral pallial domain, as well as maintain themselves, acting as a local growth zone akin to the ones described in the adult optic tectum and retina (Dirian et al., 2014). Their exact lifespan and fate, however, remain to be studied in detail.
Highly Neurogenic Radial Glia Line the Subpallial Ventricle
RG cells also border the subpallial ventricle. They differ from pallial RG for their high levels of BLBP expression, their thick morphology, their higher proliferative potential, the interkinetic
migration of their nuclei, and their generation of neurons that populate both the (subpallial) parenchyma and the olfactory bulb (Ganz et al., 2010;März et al., 2010a). Progenitors fated to the OB follow a longitudinal anterior-ward migration, akin to the rostral migratory stream of rodents, although glial corridors have not been observed (Kishimoto et al., 2011).
Embryonic Origin of Adult Pallial Radial
Glia: Heterogeneity, Functional Impact,
and Comparison With NSC-Generating
Lineages in Rodents
Cre-lox lineage tracing indicates that pallial RG of the dorsal, medial and anterior pallial territories originate from embryonic RG that border the telencephalic ventricle at 1 day-post-fertilization (dpf) (Dirian et al., 2014). These embryonic RG, like their adult counterparts, express the Her transcription factor Her4. In contrast, as discussed above, adult RG of the postero-lateral pallium originate from the NE progenitor pool maintained at the pallial edge, itself deriving from dorsal NE progenitors located at the tel-diencephalic junction at 1 dpf (Dirian et al., 2014). NE progenitors express typical Her factors found at neural tube boundaries, such as Her6 and Her9, andher9 expression is maintained into adulthood (Figure 2A). The two pallial RG populations remain separated by a cryptic boundary, and differ in a number of ways: posterior RG have a higher proliferation rate, higher expression of blbp and lower expression of GS (these three features possibly being related with their relatively “younger” age). Further, this population can be replenished from the NE pool if RG are depleted at larval stages.
Teleost fish encompass over 26,000 species across a large variety of habitats, and display a number of adaptations including in the morphology, growth rates or sizes of their pallium. As a response to its ephemeral habitat, N. furzeri follows an explosive development to its adult size (Blažek et al., 2013), including accelerated pallial growth and neurogenesis. Recent work demonstrates that this is not due to the enhanced efficiency of existing lineages, but rather to the long-term persistence until adulthood of a highly neurogenic embryonic lineage (Figure 2B;
Coolen et al., 2020). This study, which points to the variety of neurogenic adaptations in the adult vertebrate brain, illustrates the power of fish models to uncover the different natural strategies that can be used to amplify neurogenesis.
Finally, in addition to their embryonic origin, a potential determinant of NSC properties is the duration of their neurogenic
TABLE 1 | Tracing neural progenitors and/or their progeny in the adult zebrafish telencephalon.
Method Principle Output (and limitations) Princeps
publications Thymidine analogs These compounds (BrdU, CldU, EdU)
incorporate into the DNA of cycling cells during the S phase. They are revealed by immuno-histochemistry or click-chemistry.
Labeling of dividing cells only (thus low efficiency to label dormant cells).
Identification of the progeny cells becoming post-mitotic or dividing infrequently post-labeling (dilution of the label at each division round, so rapidly dividing progeny cells are lost).
Detection of cells dividing infrequently, when detected together with a proliferation marker (PCNA, MCM proteins) after a chase (“label retention assay”).
Adolf et al., 2006;
Grandel et al., 2006;Pellegrini et al., 2007
Retroviruses Cells with ventricular contact are infected upon intra-ventricular injection of the viral suspension. Following infection, the genetic material carried by the virus is reverse transcribed and integrates into the host cell genome.
Integration into dividing cells for simple retroviruses, and into non-dividing cells as well for lentiviruses, the genetic material of which can cross nuclear pores.
Permanent labeling of the progenitor and its progeny. Cell specificity of expression can be achieved using specific promoters. Rothenaigner et al., 2011 DNA electroporation or lipofection
Cells with ventricular contact are targeted upon intra-ventricular injection of the virus suspension and electroporation. DNA remains episomal.
Cell specificity of expression can be achieved using specific promoters.
Labeling is transmitted to progeny cells but is a priori not permanent.
Bias toward targeting cells with a large apical surface.
Chapouton et al., 2010;Alunni et al., 2013 Conditional Cre-lox-mediated genetic tracing
Double transgenic animals (driver-reporter) are used. Expression of Cre-ER is driven from the driver transgene by neural progenitor-specific promoters, and nuclear translocation is temporally controlled by tamoxifen treatment. It recombines the reporter transgene at LoxP sites to express a reporter, usually driven by a ubiquitous promoter.
Cell specificity of the recombination is achieved using specific promoters (so far: her4.1; gfap; nestin); these promoters may not recapitulate the endogenous pattern in all lines, and need to drive strong expression for recombination to be efficient.
Labeling is permanent in the progenitor and all its progeny cells.
Various extents of recombination can be used (from clonal to full).
Kroehne et al., 2011
Tet-rtTA-mediated genetic tracing
Double transgenic animals (driver-reporter) are used. Expression of Tet is driven from the driver transgene by neural
progenitor-specific promoters, and its activity is temporally controlled by doxycylin treatment. It then activates the reporter transgene.
Cell specificity of induction is achieved using specific promoters (so far: her4.1).
Labeling is transient in the progenitor following arrest of the doxycycline treatment. If the reporter protein is fused with a histone (e.g., H2B), it will be diluted in the progenitor cell upon division, but stably maintained in post-mitotic cells generated soon after induction, hence also serving as a birth dating method; like with thymidine analogs, rapidly dividing progeny cells will be lost by label dilution. Various extents of induction can be used (from clonal to full); full inductions can also be used to track non-dividing progenitor cells that retain the label (although with caution, as expression levels at induction may be variable).
Furlan et al., 2017
Intravital imaging 2P: Semi-transparent adult animals (casper or nacre) are used, anesthetized and imaged using 2P microscopy. Progenitor cells are tracked using specific transgenic reporter backgrounds or following reporter electroporation.
3P: transgenic casper adults are used, anesthetized and imaged using 3P microscopy.
Individual progenitor cells can be tracked over some weeks. Tracking of progeny cells is transient as they leave the progenitor niche to reach deep parenchymal areas. Only applicable so far to the dorsal-most pallial areas (Da, Dm).
Individual progenitors can be imaged, as well as cells located much deeper in the parenchyma (at least 200 mm below the NSC layer), e.g., neurons. Howerver the method has not been used yet for repetitive imaging.
Barbosa et al., 2015a;Dray et al., 2015;Guesmi et al., 2018
activity. Genetic tracing and birth dating experiments indicate that most, likely all, RG of the dorso-medial and anterior pallial domain originate from a constitutively neurogenic lineage, i.e., generating neurons without interruption from embryo to adult (Figure 2A; Dirian et al., 2014; Furlan et al., 2017). This was later shown to be also the case for NSCs of the adult mouse DG (Song et al., 2018; Berg et al., 2019). In apparent contrast, NSCs of the adult mouse SEZ were shown
to derive from cells entering quiescence at mid-embryonic stages, hence pausing prior to being remobilized in adults (Figure 2C; Furutachi et al., 2015). It is possible, however, that quiescence instatement in the SEZ is more gradual and that an asynchrony exists in the control of quiescence entry and neurogenic activity among SEZ NSCs, reconciling the different models. Finally, it remains to be formally demonstrated whether the NE progenitors located at the pallial edge, and the young RG
BOX 1 | Neural Stem Cells and neural progenitors.
By definition, stem cells are individual cells endowed with long-term self-renewal and at least bi-potency. This initial definition is in line with a classical scheme where a stem cell upon division generates another stem cell and a differentiated progeny. However, clonal tracing in a number of adult stem cell systems rather supports a model where stem cells are self-renewing and bi-potent at the population level, choosing stochastically between balanced numbers of amplifying, asymmetric or differentiative divisions. This is no exception in the adult brain where several studies, both in mouse and zebrafish, are compatible, at least in part, with such “population asymmetry” ensuring both neural stem cell maintenance and neuronal production. These converging observations suggest to revise the strict definition of a neural stem cell toward that of neural stem cell population(s), characterized by their capacity, as a whole, to maintain themselves and generate neurons and/or post-mitotic glial cells. In the zebrafish adult pallium, these properties are met by radial glial cells (although to varying degrees). One can further distinguish constitutive and facultative neural stem cells (or population), the former being active physiologically and the latter being normally silent but becoming active, e.g., upon lesion (as is for example the case in the zebrafish spinal cord). The term “neural progenitor” is generally used more broadly, (i) to mention progenitors that are further committed along the neurogenesis lineage than neural stem cells (for example, the “activated neural progenitors” -NPs- of the zebrafish adult pallium or the equivalent “transit amplifying progenitors” -TAPs- of adult mouse neurogenic niches), (ii) to refer to neurogenic cells whose self-renewal potential has not been clearly assessed, (iii) or to jointly refer to all cells with neurogenic capacity (for example, NSCs + NPs).
that they progressively generatede novo in the adult pallium, have an equivalent in rodents.
Adult Neurogenic Lineages in the
Zebrafish Pallium Are Devoid of
Amplification and Drive Neuronal
Addition
Different Amplification Strategies in Teleosts and Rodents
Downstream of NSCs, adult neurogenesis in mouse involves TAPs, i.e., non-stem neuronal progenitors of limited self-renewal. The amplification potential of TAPs greatly varies between the SEZ and DG: in average, a TAP would divide three to four times in the SEZ (Ponti et al., 2013), but once or twice in the DG (Seri et al., 2004; Encinas et al., 2011; Lugert et al., 2012; Figure 3D). TAP-like progenitors are also present in the developing mouse cortex, notably as basal progenitors expressing the transcription factor Tbr2. These basal progenitors originate from RG and generate cortical neurons following 1 or 2 divisions (Hevner, 2019). Tbr2 expression is also found in the adult SEZ in amplifying progenitors generated from the TAPs (Lugert et al., 2012;Nelson et al., 2020).tbr2 (eomesa) expression in the adult zebrafish pallium is largely regional and has not been directly associated with NPs (Ganz et al., 2015). The lineage amplification by pallial NPs is minimal, with at most one or two divisions, akin to TAPs of the DG (Figure 3C; Rothenaigner et al., 2011;
Furlan et al., 2017). Hence, in the zebrafish pallium, extensive neuronal production is ensured by the continuous neurogenic activity of RG (notably in the cortical area, where neurogenesis is shut-down after birth in mammals) and thede novo addition of neurogenic RG into the system. The latter occurs through the activity of NE progenitors at the pallial edge, and currently unidentified “source cells” disseminated at the pallial ventricle (see below) (Than-Trong et al., 2020).
Adult Neurogenesis in Zebrafish Is Additive
Adult neurogenesis in mouse is globally understood to drive neuronal replacement, following the selective maintenance of a subset of adult-born neurons in the functional circuitry -while most adult-generated neurons would be eliminated (Figure 3B). Some publications, however, report neuronal addition, both in the DG (Bayer, 1985;Dranovsky et al., 2011) and OB (Platel et al., 2019). The output of pallial neurogenesis in zebrafish primarily
drives neuronal addition. No cell death was observed, and the pallial parenchyma (as well as the OB) increases its neuronal population during adult life and grows (Than-Trong et al., 2020). Genetic birth dating and lineage tracing experiments showed that newborn neurons delaminate from the ventricular zone and stack into the parenchyma in age-related layers until adulthood (Furlan et al., 2017; Figure 3C). Because there is no extensive neuronal migration, and little or no death, this process results in an adult pallium where superficial structures are composed of young (late-born) neurons and central structures of old (early-born) neurons, still including neurons born at embryonic and early juvenile stages. This also applies to the lateral pallium, with in addition a lateral to medial gradient in RG age (Figures 3A,B;
Furlan et al., 2017).
To date, the identity of adult-born pallial neurons, as well as their projection pattern and function, remain largely unknown in zebrafish. Like in the mouse, some adult-born neurons in the zebrafish OB are TH-positive (Adolf et al., 2006). In the pallial parenchyma proper, only candidate markers have been tested to date to characterize RG-derived neurons, including some transcription factors and neurotransmitters (identifying for example GABA-ergic and glutamatergic neurons) (von Trotha et al., 2014; Furlan et al., 2017). A neuron atlas was recently generated from the zebrafish telencephalon at 21 dpf using scRNAseq (Raj et al., 2018), and such a description is long awaited in adult, to permit both functional studies -still conducted currently through laborious screening to associate molecularly defined subpopulation with a given function (Lal et al., 2018)- and information on how NSCs generate different neuronal types. In the developing mammalian cerebral cortex and the Drosophila optic lobe, columnar organization is generated through sequential expression of specific transcription factors (Mattar et al., 2015; Doe, 2017). The zebrafish pallium is also built through a sequential stacking process, but in contrast to the mouse, the “migration-free death-free” neurogenesis process of the adult zebrafish pallium makes it possible to readily identify neurons born at adulthood by their (superficial) position (Furlan et al., 2017). This will then make it straightforward to attribute them with molecular signatures. Determining whether neurons at different depths have different identities and when they are generated would therefore represent an important step to know whether there is a temporal heterogeneity in NSCs and how it might be encoded. Moreover, since the same NSCs remain active in an adult brain which keeps on growing, one important
FIGURE 2 | Lineages at the origin of adult neurogenic progenitors in the vertebrate pallium. (A) Lineages in zebrafish, generating adult RG from embryonic RG (top) and NE progenitors (bottom). (B) Lineages in the killifish, where neurogenesis in adults is ensured by a long-lasting non-glial embryonic lineage (blue) dph: days post-hatching, wph: weeks post-hatching. (C) Lineages in mouse, where distinct modes of NSC production are described in the DG (top) and SEZ (bottom) (Dirian et al., 2014;Furutachi et al., 2015;Song et al., 2018;Berg et al., 2019;Coolen et al., 2020).
question would then be whether NSCs maintain a similar level of plasticity throughout life, either physiologically or in a regenerative context. Finally, identifying neural subpopulations
in the pallium could also reveal depth-independent areal heterogeneities, perhaps to be correlated with areal differences in NSC potential.
FIGURE 3 | Global outputs of adult neurogenesis in zebrafish and mouse. (A) Scheme of a typical neurogenesis lineage in adult mouse. Upon quiescence exit, NSCs generate neurons via TAPs. TAPs have variable amplification capacity, high in the SEZ, lower in the DG. Green and purple shades are meant to represent shared cells and attributes between the SEZ and DG (color code in Figure 2C, with proliferating cells indicated with a pink nucleus). (B) Scheme of a typical neurogenic lineage in the adult zebrafish pallium (left) and neuronal output (right). Neurons are generated via an intermediate progenitor (NP: neural progenitor) of limited amplification potential. Because adult-generated neurons persist, however, the number of neurons generated per NSC increases over time in genetically traced lineages from individual NSCs. (C) Spatio-temporal distribution of the neurogenesis output in the zebrafish pallium, from embryonic stages until adult life. Radial glia (triangles) generate neurons that stack in age-related order within the telencephalic parenchyma. Old neurons, at the pallial-subpallial boundary, were generated in the embryo and early larva. In the lateral pallium (orange), the same process operates but radial glia are generated during juvenile and adult stages from NE progenitors (circles). Arrows indicate the spatial organization of neurogenesis over time. (D) Compared output of neurogenesis in the pallium of zebrafish and mouse from embryo to adult, represented on schematic cross-sections where the dotted line separates neurons generated at embryonic versus post-embryonic stages. Neurogenesis is continuous and additive (straight arrows) in zebrafish in all pallial subdivisions (left panel). Neurogenesis stops at birth in the mouse neocortex, spatially isolating the two persisting neurogenic niches SEZ and SGZ. Neurogenesis in these niches is mostly used for neuron replacement (circular arrows) (right panel). Color code as in Figure 1 (Seri et al., 2004;Encinas et al., 2011;Rothenaigner et al., 2011;Lugert et al., 2012;Ponti et al., 2013;Furlan et al., 2017;Than-Trong et al., 2020). D, dorsal part of the telencephalon (pallium); Da, anterior part of D; Dm, medial part of D; Dl, lateral part of D; aNSC, activated neural stem cell; qNSC, quiescent neural stem cell; NP, neural progenitor; TAP, transit amplifying progenitor; V, ventral telencephalon (sub-pallium).
FIGURE 4 | Long-term NSC and neur ogenesis dynamic in the adult zebrafish pallium. (A,B) Genetic clonal analysis driven by the her4:ER T2CreER T2 transgene with chase time over 500 days. The number of NSCs per clone containing at least one Sox2+ cell (A) and the pr oportion of clones containing at least one Sox2+ cell (B) display a bi-phasic dynamics at long term. At early time points after induction, neutral drift is observed -r ed-. At later time points, a behavior characteristic of single cell-based self-r enewal appears -blue-. These two dynamics reflect the behavior of two embedded populations (operational and reservoir , respectively). (C) Total number of Sox2+ cells in the adult Dm between 3 and 25 months post-fertilization (mpf). The Sox2+ population incr eases in size in the young adult (3–8 mpf), reflecting the NSC-generating activity of a “sour ce” population (orange). (D) Schematic of the pr oliferative hierar chy of NSC sub-populations sustaining overall NSC maintenance in Dm. Color code as in (A–C) ( Than-T rong et al. , 2020 ).
Pallial Neurogenesis in Zebrafish Is the Output of a Proliferative Hierarchy Involving Functionally Specialized NSC Sub-Pools
The zebrafish adult pallium is particularly amenable to NSC fate studies for several reasons: (i) its superficial location permits intravital imaging hence the direct tracing, during several weeks, of NSC fate in the absence of biased genetic tools and under non-invasive conditions (Barbosa et al., 2015b;Dray et al., 2015), (ii) its small size permits analyzing clones in whole-mount preparations, avoiding the risk of losing cells that occurs when studying brain sections, and (iii) the absence of cell death and migrations makes it easier to quantify clones in their entirety (Than-Trong et al., 2020). We made use of these attributes, and of broad promoters such as her4 and gfap that encompass the largest progenitor population, to determine the dynamics of NSC fates in the adult pallium between 3 and 18 mpf (Than-Trong et al., 2020). The combination of intravital imaging, long-term clonal genetic tracing (Figures 4A–C) and biophysical modeling revealed that NSC population dynamics is compatible with an organization in 3 hierarchically-organized sub-populations, each endowed with a specific function: NSC population growth (“source pool”), self-renewal (“reservoir pool”), and neurogenic activity (“operational pool”) (Figure 4D). The “source” population accounting for growth remains poorly defined. In contrast, division modes and transition rates could be inferred for the reservoir and operation sub-populations, highlighting the heterogeneities of NSC properties and, within the operational pool, their stochastic fate choices.
In contrast to this unifying conclusion, the results of a large number of careful clonal studies in mouse diverge, documenting NSC loss, maintenance or even gain, in the SEZ and/or DG (Lugert et al., 2010;Bonaguidi et al., 2011;Dranovsky et al., 2011;
Encinas et al., 2011;Fuentealba et al., 2012;Calzolari et al., 2015;
Urbán et al., 2016;Basak et al., 2018;Bast et al., 2018;Obernier et al., 2018;Pilz et al., 2018;Berg et al., 2019). The zebrafish data suggest that these discrepant results could be interpreted by the targeting of distinct NSC sub-populations, although a unifying model in mouse remains to be established.
NEURAL STEM CELL QUIESCENCE AND
ITS IMPACT ON NEUROGENESIS
Quiescence Is an Actively Maintained
State Shared Between Zebrafish and
Mouse Adult Neural Stem Cells
Quiescence is a prominent cell state in adult NSCs, as illustrated in both zebrafish and mice. It is therefore important to consider how it may affect NSC biology and neurogenesis output, likely in a similar way in these species. The quiescence phase of adult NSCs generally corresponds to the G0 state of the cell cycle. In Drosophila, NSCs can also undergo a G2 quiescence phase at late embryonic stages (Otsuki and Brand, 2018), and the existence of a long G2 phase has been suggested in NE progenitors of the medaka optic tectum at post-embryonic stages, based on the expression of G2-M arrest genes (Dambroise et al.,
2017). G2 quiescence, however, remains to be demonstrated in vertebrate adult brains.
Practically, quiescent NSCs are negatively defined by the absence of proliferation markers. Until now, a positive core signature for quiescent NSCs has not been defined, although RNASeq data in both mouse and zebrafish brought deeper understanding of the molecular players of NSC quiescence: generally, pathways involved in transcription, translation, DNA replication and DNA repair, and cell cycle progression, are downregulated (Codega et al., 2014;Dulken et al., 2017), while cell-cell communication (Shin et al., 2015;Basak et al., 2018), cell adhesion (Codega et al., 2014; Shin et al., 2015), cell signaling and lipid metabolism (Llorens-Bobadilla et al., 2015;Than-Trong et al., 2018) are upregulated (Figure 5).
Quiescence is classically linked with the maintenance of stem cell properties (stemness, i.e., self-renewal and differentiation potential, see Box 1). This link is, however, not obligatory, as illustrated in the gut and skin, where adult stem cells proliferate continuously while staying in homeostasis. In the brain, however, quiescence is believed necessary for stemness -hence neurogenesis potential-, avoiding DNA, protein or mitochondria damage that could lead to senescence or malignant transformations. But this has been difficult to demonstrate, both in mouse and zebrafish, in particular because testing for stemness requires functional assays where NSCs will divide, and because many quiescence control factors have pleiotropic effects and in particular are actors of the neurogenesis cascade itself (see below). Nevertheless, several studies to some extent disentangled the two properties. For example, in adult mouse, physical exercise leads to increased SGZ NSC proliferation, but is not followed by exhaustion of the NSC pool (Van Praag et al., 1999;Wu et al., 2008). In the adult zebrafish pallium, bulk RNAseq profiling of quiescent versus activated NSCs or in the presence or absence of Notch3 activity showed that Notch3 promotes quiescence and stemness in part via distinct molecular cascades (Than-Trong et al., 2018). While the transcription factor Hey1 mediates Notch3 activity on stemness, the candidate Notch3 effectors controlling quiescence remain to be experimentally validated. In mouse, the direct effect of Notch on stemness remains to be unraveled, as well as whether Hey1 is a target of Notch and could potentially control stemness. In the mouse SGZ, Notch2 drives expression of the transcription factor-encoding gene Id4. However, unlike the depletion of Notch2, the depletion of Id4 induces NSC activation but does not promote neuronal differentiation (Zhang et al., 2019). Thus, in mouse, NSC quiescence and stemness could also be molecularly uncoupled downstream of Notch2, Id4 controlling only its quiescence-promoting effect.
Quiescence Instatement, Length, and
Depth in Adult Neural Stem Cells:
Variable Geometry Parameters?
Quiescence Length Remains to Be Measured With Precision
Through genetic lineage tracings and live imaging in zebrafish and mouse, we know now that NSCs can re-enter quiescence after activation (Berg et al., 2010;März et al., 2010a;Bonaguidi et al.,
FIGURE 5 | Schematic of the cell cycle including the most important information about the decision to enter quiescence, remain in cycle or differentiate. (A) General cell cycle knowledge, illustrating phases G1, S, G2, and M and the most important checkpoints (purple). During the cell cycle, proteins involved in transcription, translation, DNA replication and DNA repair are upregulated. The schematic includes proliferation markers MCM, PCNA, and Ki67 (gray) that are expressed in different phases of the cell cycle and commonly used to define proliferating NSCs. During the cell cycle, cells can enter into the quiescence state in G1, the decisions for entry happening at a R-point in G1. After passing the R-point, cells are committed to fulfill another cell cycle. Another important check-point is the bifurcation point right after mitosis, a window in which cells are sensitive to mitogen signals that influence CDK2 (R1 and R2 window on the schematic). Cells with a normal level of CDK2 will keep cycling, whereas cells with low levels of CDK2 will enter a transient quiescence and will face a second restriction window at the end of G1, controlled by the CDK inhibitor p21. Only cells that built up enough CDK will be able to bypass quiescence and eventually re-enter quiescence. (B) NSC-specific quiescence cycle. Quiescence can be entered in G1, or G2 (this remains to be shown for vertebrates). During quiescence, genes involved in cell-cell communication, cell adhesion and cell signaling are upregulated, stressing that quiescence is an actively maintained state. Some data (e.g., the dynamics of miR-9 expression) suggest that quiescence can be seen as a cycle, but alternative models exist. Quiescent cells express p21, p27, p57, and p130. Quiescence is heterogeneous, and deeper and shallower sub-states exist. miR-9 is nuclear in deeply quiescent cells. Some NSCs that are insensitive to Notch blockade can also be interpreted as deeply quiescent. A “pro-activated” state precedes activation proper. In this state, NSCs express ascl1, which will also be maintained during activation and differentiation (Pardee, 1974;Alunni et al., 2013;Spencer et al., 2013;Andersen et al., 2014;Katz et al., 2016).
TABLE 2 | Estimated lengths of cell cycle phases and quiescence in adult NSCs of the zebrafish and mouse telencephalon.
Cell cycle phase Length Model Method References
G1 0–35 h, most of the
time: 6–15 h
Mouse NSC cell culture
Hes5:FUCCI line Roccio et al., 2013
S/G2/M 4–12 h, most of the
time: between 4 and 9 h
Mouse NSC cell culture
Hes5:FUCCI line Roccio et al., 2013
Complete cell cycle 17 h Mouse NSCs in the
SEZ
Thymidine analog Ponti et al., 2013
S-phase 4.5 Mouse NSCs in the
SEZ
Thymidine analog Ponti et al., 2013
S-phase ANP (amplifying
neural progenitors, higher level of proliferation): 12.2 ±1.1 QNP (quiescent neural progenitors, low level of proliferation): 7.8 ± 0.7 Mouse NSCs in the SGZ
Thymidine analogs Encinas et al., 2011
Cell cycle 28–35 h Mouse NSCs in the
SGZ
Thymidine analogs Encinas et al., 2011
G0 20 ± 4 days Mouse NSCs in
SEZ
Genetic tracing based on Wnt-target Troy:GFP. In the model, qNSCs become activated at constant low rate, and aNSC go to quiescence at constant rate.
Basak et al., 2018
G1 G0 transition 5 ± 2 days Mouse NSCs in
SEZ
Genetic tracing based on Wnt-target Troy:GFP. In the model, qNSCs become activated at constant low rate, and aNSC go to quiescence at constant rate.
Basak et al., 2018
Division rate 5 ± 2 h Mouse NSCs in
SEZ
Genetic tracing based on Wnt-target Troy:GFP. In the model, qNSCs become activated at constant low rate, and aNSC go to quiescence at constant rate.
Basak et al., 2018
Non-proliferating Mouse NSC in the
SGZ
Live imaging with inducible Ascl1:tdTomato line
Pilz et al., 2018
G0 24.4 and 143 days Zebrafish pallium Genetic tracing based line
Tg(her4:RFP). In the mathematical model, qNSCs become activated at 2 different rates.
Than-Trong et al., 2020
2011;Dray et al., 2015;Pilz et al., 2018;Than-Trong et al., 2020). It remains, however, unclear, and debated, whether NSCs keep the same properties (fate, quiescence length. . .) upon division (Bonaguidi et al., 2011; Urbán et al., 2016; Than-Trong et al., 2020). Quiescence length, as well the duration of cell cycle phases, also remain to be precisely defined in NSCs, and key studies on these issues are summarized in Table 2. Overall, S-phase can last between 4 and 8 h (Encinas et al., 2011;Ponti et al., 2013), and the complete adult NSC cell cycle will take 10–35 h (Encinas et al., 2011;Ponti et al., 2013;Roccio et al., 2013). The time between 2 divisions can lie between 14 and 36 days, as observed by live imaging in the SGZ, but the upper limits of quiescence were not explored (Pilz et al., 2018). In the zebrafish adult pallium, mathematical models predict average quiescence times reaching 143 days, which is yet to be confirmed experimentally ( Than-Trong et al., 2020). It is likely that the zebrafish pallium will be highly instrumental to fill these gaps, as the superficial location of the pallial progenitor zone (contrasting with the deep location of mammalian NSCs) permits long-term intravital imaging.
Quiescence Instatement Is Progressive With a Schedule That May Differ Between Niches and Species
Progenitors in the SGZ produce granule neurons during embryonic and postnatal stages and enter quiescence postnatally. Then, they acquire their radial morphology and organize in the SGZ (Li et al., 2013; Berg et al., 2019). In contrast, in the SEZ, stem cells with quiescence characteristics were identified at embryonic stages by H2B-mediated lineage tracing (Furutachi et al., 2015). These cells would slow down their cell cycle at E13.5, then remain quiescent to re-activate at adult stages (Fuentealba et al., 2012). As mentioned earlier, these differences between the SEZ and SGZ may be apparent and due to tracing some cells only, or due to using indirect measurements. For example, H2B-tracing is based on differential dilution, and a positive read-out necessitates a minimal quiescence length. In zebrafish, pallial neural progenitors start entering quiescence at 5 dpf (Alunni et al., 2013), and the average duration of quiescence -as inferred from the decreasing proportion of PCNA-positive cells within the population- gradually increases until adulthood (Dirian et al., 2014;Katz et al., 2016). It remains unclear whether the data above can directly be compared, as they use different methods with their inherent limitations. Likewise, measures based on the lack of PCNA protein will not distinguish cells in early G1 phase (PCNA transcription and protein stability being low prior to the G1-S transition) (Chang et al., 1990) from cells in G0. Progressive quiescence instatement, concluded from the increasing duration of a PCNA-negative state, may therefore be concluded for cells that in fact progressively lengthen early G1. Overall, it remains urgent for the field to positively label G0.
NSC Quiescence Is a Heterogeneous State
Several analyses support the idea that G0 quiescence is heterogeneous. Some studies suggest different types of quiescence (mainly short versus long-term) depending on the cell and its history (Urbán et al., 2016). Additionally, quiescence can consist of sub-states, defined as transient phases, arguably harboring
specific molecular or cellular signatures and properties, that cells transit through during their quiescence phase. Zebrafish adult pallial NSCs were instrumental to experimentally exemplify potential quiescence sub-states. For example, pharmacological blockade of Notch signaling in zebrafish, which globally leads to NSC quiescence exit (see below), revealed different lag phases to re-enter cycling, and approximately 5% of quiescent NSCs did not respond to the blockade (Alunni et al., 2013). Convincingly, a subset of quiescent NSCs express microRNA-9 (miR-9), and BrdU chase experiments suggest that the miR-9-positive state is a transient phase in a quiescence cycle and may reflect deep quiescence (Katz et al., 2016). Indeed BrdU incorporated during the S phase of dividing NSCs becomes associated with miR-9 staining only after long chase, showing that miR-9 is expressed in now deeply quiescent NSCs but that were previously dividing. scRNAseq and expression analyses conducted in mouse also suggest the existence of a distinct quiescent sub-state close to activation, as was proposed for muscle satellite cells. The first study reporting such heterogeneity in the mouse SEZ identified three non-dividing NSC clusters (Llorens-Bobadilla et al., 2015): a dormant cluster in the deepest state of quiescence, a second cluster containing cells expressing markers related to activation but that do not divide, and a third cluster that falls in between on the spectrum between quiescence and activation. The same group reported the same subpopulation structure in a new study and using a different technology, suggesting that these cells can be reliably and reproducibly grouped into distinct clusters (Kalamakis et al., 2019). Recently a separate group reported the most extensive scRNAseq conducted on NSCs so far (Mizrak et al., 2019), in which they captured close to 40k SEZ astrocytic cells. They identified several independent clusters that also matched distinct regions along the SEZ which differ in proliferation rate. This can be explained if NSCs along the lateral ventricles rest in different depths of quiescence. An important limitation to these experiments in the SEZ, however, is the difficulty to distinguish between astrocytes andbona fide NSCs (Dulken et al., 2017). In the dentate gyrus, astrocytes and RGL-cells formed distinct clusters (Hochgerner et al., 2018). However so far only low numbers of stem cells were captured in scRNAseq experiments conducted on the hippocampus, which prevents proper analysis of their intrinsic heterogeneity. Two reports were recently published in zebrafish, based on NSCs isolated from her4.1-driven transgenes (Cosacak et al., 2019;Lange et al., 2020). However these studies only captured small numbers of NSCs (609 and 76, respectively). One of them conclusively shows the existence of distinct NSC clusters in the pallium (Cosacak et al., 2019), but more extensive studies will be necessary to get a better idea of the level of heterogeneity as well as whether and how these subpopulations differ in quiescence depth.
Control Mechanisms of Quiescence Are
Highly Conserved Between Zebrafish
and Rodents
Control mechanisms of NSC quiescence in zebrafish and rodents appear similar, yet many mechanisms that were identified in rodents remain to be studied in zebrafish and vice versa.
FIGURE 6 | Schematic of a quiescent NSC including the pathways controlling quiescence, which are summarized in this review. The scheme highlights knowledge generated in mouse, and confirmed pathways in zebrafish are illustrated in green. Knowledge generated in zebrafish and later extended to mouse is shown in green as well. Knowledge generated in zebrafish and still to be confirmed in mouse is depicted in yellow. Differences (Notch2 is not expressed in qNSCs in zebrafish), or data that need consolidation in zebrafish (Ascl1 expression and its regulation by ID and Hes1, BMP receptor), are shown in black. See text and Table 3 for references.
Conditional functional studies in the adult zebrafish remain technically challenging, especially when genetics-based, and this is still slowing down the field. We will focus here only on the control mechanisms that have been studied in the zebrafish pallium and compare them to data in mouse (Figure 6) (but see Table 3). It is to note that, while these studies convincingly implicate various factors in quiescence control, they do not resolve their function in controlling quiescence entry, maintenance, exit, or transition through the different sub-states discussed above.
Notch Signaling Is a Key Quiescence-Promoting Pathway
One of the most prominent NSC quiescence-promoting pathway is Notch signaling, as first demonstrated in the adult zebrafish pallium (Chapouton et al., 2010), and later confirmed to be conserved by numerous studies in mice. In zebrafish and mice, Notch is highly expressed in NSCs. Whereasnotch3 is strongly upregulated in quiescent cells, notch1 (notch1b in zebrafish) is strongly expressed in activated NSCs (Aguirre et al., 2010;
Chapouton et al., 2010;Basak et al., 2012; Alunni et al., 2013;
de Oliveira-Carlos et al., 2013;Kawai et al., 2017;Zhang et al., 2019).notch2 expression was not detected in the zebrafish brain, but is expressed in quiescent NSCs in mice (Basak et al., 2012;
Kawai et al., 2017;Zhang et al., 2019). Blocking Notch signaling with a gamma-secretase inhibitor dissolved in fish water leads to
activation of NSCs and expansion of the NSC pool by symmetric divisions (Chapouton et al., 2010;Alunni et al., 2013), and this was recapitulated by the selective blockade of Notch3 using morpholinos (Alunni et al., 2013). In mice, Notch inhibition, either at the level of the ligands or the effector RBPjK leads to exit of quiescence and exhaustion of the NSC pool, a phenotype also often understood to mean that NSC quiescence is crucial for stemness maintenance (Ehm et al., 2010;Imayoshi et al., 2010;
Kawaguchi et al., 2013;Lavado and Oliver, 2014). In zebrafish, NSC exhaustion was not observed, but long-term Notch blockade at adult stage was not conducted beyond 7 days (Alunni et al., 2013). One transcription factor functionally interacting with Notch signaling is Fezf2 (Fez family Zinc Finger 2), which is expressed at high levels in quiescent NSCs in the zebrafish adult pallium and mouse SGZ (Berberoglu et al., 2014). In zebrafish, fezf2 expression correlates with the nuclear localization of NICD and with high expression level of the Notch targether4, and is necessary for quiescence (Berberoglu et al., 2014).
Other Quiescence Promoting Pathways Are Highly Conserved Between Rodents and Zebrafish
Another important pathway for NSC quiescence is BMP (bone morphogenic protein) signaling. NSCs express components of the BMP pathway like Smads, BMPR I and II (Lim et al., 2000;Bonaguidi et al., 2008;Mira et al., 2010). Overexpressing BMP ligands leads to a decrease in NSC proliferation and
TABLE 3 | Quiescence promoting factors. Quiescence
promoting factor
Model Method References
Notch (in general) Mouse SGZ Conditional knockout of RBPJk in Glast-expressing NSCs enhances neurogenesis (quiescence exit) and leads to NSC depletion 2 months after induction
Ehm et al., 2010
Mouse SEZ Conditional knockout of RBPJk in Nes-expressing NSCs enhances neurogenesis (quiescence exit) and leads to NSC depletion 3 months later
Imayoshi et al., 2010
Notch3 Adult zebrafish
pallium
Pharmacological blockade of gamma-secretase (Notch signaling pathway), notch3 mutant and notch3 MO show that Notch3 maintains quiescence
Alunni et al., 2013
Mouse SEZ Notch3-null mice and knockdown in adult with lentiviral expressing shRNA targeting Notch3 drive quiescence exit of NSCs, especially in the lateral and ventral wall
Kawai et al., 2017
Notch2 Mouse SEZ Conditional knockout of Notch2 in Hes5-expressing NSCs and short-term lineage tracing of Notch2-expressing cells shows that Notch2 maintains NSCs in quiescence, as loss of function leads to quiescence exit, increased neurogenesis and accelerated NSC exhaustion
Engler et al., 2018
Mouse SGZ Conditional knockout of Notch2 in Hes5-expressing NSCs leads to proliferation of NSCs and increased neurogenesis
Zhang et al., 2019
Dll1 Mouse SEZ Conditional knockout of Dll1 in Nes-expressing NSCs leads to quiescence exit (feedback to activate Notch in quiescent cells is not ensured anymore)
Kawaguchi et al., 2013
Jagged1 Mouse SGZ Conditional knockout of Jagged1 in Nes-expressing NSCs leads to quiescence exit, implying that the interaction between Jagged1 and Notch is important for NSC quiescence and maintenance
Lavado and Oliver, 2014
Fezf2 Adult zebrafish
pallium
Vivo-morpholino against fezf2 (short-term knock-down) leads to quiescence exit and increased proliferation
Berberoglu et al., 2014
Bone morphogenic proteins
Mouse SEZ BMP7 overexpression (virus-mediated) and Noggin expression (through protein purification or virus-mediated) show that expression of BMP maintains quiescence in type B cells/NSCs and therefore inhibits neurogenesis. It promotes the survival of type A progenitors
Lim et al., 2000
Mouse SGZ Blocking BMP through Noggin leads to reactivation and expansion of the NSC pool, suggesting that BMP is involved in quiescence control
Bonaguidi et al., 2008
Mouse SGZ Intracerebral infusion of Noggin, lentivirus-mediated ablation of BMPR-1A and conditional knockout of Smad4 in Glast-expressing NSCs lead to quiescence exit, increased proliferation and exhaustion
Mira et al., 2010
NSCs derived from ESCs
NSC culture can be pushed to quiescence by adding BMP4 in 24 h Martynoga et al., 2013
Inhibitors of DNA binding
Mouse SGZ Conditional knockout of Id4 in Glast-expressing NSCs leads to increased ASCL1 expression and reactivation of previously quiescent NSCs
Blomfield et al., 2019
Mouse SGZ Conditional knockout of Id4 in Gfap-expressing cells using adeno-gfap::Cre viruses leads to NSC activation and cell-cycle entry without inducing neurogenesis
Zhang et al., 2019
NFIX NSC culture
derived from Mouse ESCs
Knockdown in vitro leads to impaired quiescence Martynoga et al.,
2013
Mouse NFIX-/- knockout: lethal at 3 weeks. Proportion of cycling NSCs is increased in the mutant. Martynoga et al., 2013
Forkhead box O3 Mouse SEZ and SGZ
Conditional knockout of FOXO1,3,4 in Gfap-expressing cells: decline of NSC pool and neurogenesis.
Paik et al., 2009
Neurospheres from NSC culture
Neurospheres from FOXO3-/- versus FOXO3+/+, genome-wide microarray analysis: FoxO3 induces a program to preserve quiescence
Renault et al., 2009
Mouse SEZ and SGZ
FOXO3-/-: reduced number of NSCs in vivo (NSCs got activated and lost) Renault et al., 2009
Adult mouse primary NSC culture
ChIP: FOXO3 binds proneural genes that are also targeted by Ascl1 possibly as a competitor to repress their expression and maintain NSC identity
Webb et al., 2013
Mouse SGZ Conditional knockout of FoxO1,3,4 in Glast-expressing NSCs: leads to quiescence exit, increased proliferation followed by loss of NSC number
Schäffner et al., 2018
Mouse SEZ FoxO3-/- knockout results in quiescence exit and increased neurogenesis Webb et al., 2013
miR-9 Zebrafish pallium Vivo-MO targeting mature miR-9 leads to reactivation of previously quiescent mir-9+ NSCs. Katz et al., 2016
Gaba Mouse postnatal
SEZ, acute slices
GABAA-R-antagonist bicuculline leads to increase of proliferation in GFAP+ cells Liu et al., 2005
SGZ adult Clonal analysis after cKO of gamma2-subunit-containing GABAAreceptor in Nes-expressing
NSCs –> quiescence exit and symmetrical self-renewal
Song et al., 2012
SGZ adult Pharmacological inhibition –> increase of NSC proliferation Genetic deletion of GABAB1
(homozygous mutant) –> increase of NSC proliferation (Sox2+ cells) and differentiation to neuroblasts. Later loss of progenitors and increased neurogenesis
Giachino and Taylor, 2014
differentiation, while overexpression of the BMP inhibitor Noggin leads to increased proliferation and neurogenesis in the SGZ, the SEZ and in vitro (Lim et al., 2000; Bonaguidi et al., 2008; Martynoga et al., 2013). Targets of the BMP pathway include ID transcription factors (“Inhibitor of DNA binding/differentiation”), which are also targeted by the Notch pathway. IDs are strongly expressed in zebrafish adult pallial NSCs, and recent work shows that BMP positively controlsid1 expression through conserved enhancers in the adult zebrafish brain (Zhang et al., 2020). In zebrafish, id1 expression is specific of quiescent NSCs, and is necessary and sufficient for quiescence (Diotel et al., 2015; Rodriguez-Viales et al., 2015). In response to injury, id1 is upregulated. It may play a role in maintaining the NSC pool through stabilizing its interactor proteins such as the Her factors Her4 or Her6, also expressed in adult pallial NSCs (Rodriguez-Viales et al., 2015). In mouse NSCs, Id interacts with and stabilizes Hes1, the mammalian ortholog of zebrafish Her6. Hes1 represses the transcription factor Ascl1 (Bai et al., 2007), which itself normally promotes NSC activation (Andersen et al., 2014; Sueda et al., 2019). Id4 does not affect Ascl1 transcription, but binds the normal Ascl1 stabilizing partner E47, leading to Ascl1 clearing (Blomfield et al., 2019).
Finally, the miR-9 quiescence-promoting factor initially identified in adult zebrafish pallial NSCs (see above) (Katz et al., 2016) is also conserved in mouse, as well as its striking sub-cellular localization: in both species, miR-9 is nuclear in NSCs transiting through a deep quiescence sub-state. Further, primary NSCs in culture derived from the SGZ and pushed toward quiescence through BMP relocalize miR-9 to the cell nucleus (Katz et al., 2016). The targets of miR-9 in quiescence control remain unknown.
Overall, a tentative quiescence cycle is presented in
Figure 5B, indicating the transient-sub-states (miR-9-positive, Ascl1-positive, Notch-insensitive) that NSCs transit through.
Activating Factors Are Also Shared Between Rodents and Zebrafish
A key promoter of NSC activation, mentioned above, is Ascl1 (achete and scute homolog 1), which directly upregulates the expression of cell cycle genes (Castro et al., 2011;
Andersen et al., 2014). Ascl1 is expressed in all activated NSCs and some neural progenitors in the mouse SEZ and SGZ. Conditional loss of function experiments showed that Ascl1-negative NSCs neither proliferate nor differentiate (Andersen et al., 2014). Ascl1 is transcribed in some quiescent NSCs (Blomfield et al., 2019; Zhang et al., 2019), but its expression and activity are repressed during quiescence by Id4 and the Notch target Hes1, which is expressed at high level with moderate oscillation amplitude (Sueda et al., 2019). How high Ascl1 expression levels become induced to drive NSC activation remains to be uncovered. Lower and oscillating levels of Hes1 expression preceding NSC activation can lead to Ascl1 oscillations, themselves driving NSC activation (Sueda et al., 2019). Then, following NSC division, the ubiquitin ligase HUWE1 degrades Ascl1 thus enabling the cell to re-enter quiescence (Urbán et al., 2016). In zebrafish, ascl1a is
expressed in activated NSCs (Than-Trong et al., 2018), but its function remains to be studied. Further to this transcription factor, growth factors are also activating factors in NSCs. In the mouse brain, intracerebroventricular infusions of the fibroblast growth factor FGF2 lead to increased proliferation and neurogenesis (Rai et al., 2007). Accordingly, conditional knock-out of FgfR1 in Nestin-expressing NSCs in the SGZ impairs proliferation and neurogenesis (Zhao et al., 2007). In the zebrafish brain, fgfr1-4 are expressed in the dorsal telencephalon. Whereas heat shock-induced expression of dominant negative forms of FGFR1 does not alter NSC activation, the overexpression of FGF8a results in strong proliferation (Topp et al., 2008; Ganz et al., 2010). fgf8a expression is restricted to the ventral telencephalon, but fgf8b, strongly expressed in the pallium (Topp et al., 2008), may play the same role.
STEMNESS-RELATED NEURAL STEM
CELL FATE CHOICES
Decisions taken by NSCs along their life include whether to activate (or remain quiescent) but also whether to maintain (or lose) their stemness (Box 1). We will refer to “stemness-related NSC fate choices” the checkpoints when a NSC decides to remain stem or to commit toward expression of the genetic program reflective of another cell type.
NSC Potency: Do NSC Fates Differ
Between Zebrafish and Mouse?
In the SEZ, the differentiation potential of individual NSCs is limited to specific neuronal subtypes based on their regional localization (Merkle et al., 2007;Merkle et al., 2014;Chaker et al., 2016;Mizrak et al., 2019). However, fate mapping experiments confirmed that even if most NSCs produce neurons, few NSCs produce oligodendrocytes (Menn et al., 2006) or astrocytes (Sohn et al., 2015). Still, the capacity for a single NSC to produce the 3 lineages in vivo at adult stage remains unclear (but seeLevison and Goldman, 1993for the neonate).In vitro, clonal cultures of primary NSCs are able to generate neurons and oligodendrocytes (Menn et al., 2006) but continuous live-imaging of dividing NSCs revealed their commitment toward oligodendrogenic or neurogenic lineages only (Ortega et al., 2013). Also, ependymal cells were not described to originate from NSCs under physiological conditions (Spassky et al., 2005; Shah et al., 2018). NSCs of the SGZ most probably possess a heterogenous range of self-renewal and fate potential (Bonaguidi et al., 2012). Compared to the SEZ, clearer examples of multipotent NSCs were unraveled by careful analysis of lineage tracing outputs and notably of clones of 3–4 cells, showing that an individual NSC can self-renew and give rise to neurons and astrocytes (Bonaguidi et al., 2011; Encinas et al., 2011). While they do not give rise to oligodendrocytes physiologically, they can do so under conditions of demyelination or following the functional abrogation of inhibitory transcription factors (Nait-Oumesmar et al., 1999; Xing et al., 2014;
The situation in the adult zebrafish pallium is inherently different, as there are no “specialized” NSCs given that, as mentioned, RG cells also serve the function of parenchymal astrocytes. Thus, stemness maintenance includes the maintenance of astrocytic function (the reverse not being true, as stemness can be lost while astroglial characteristics are maintained; Than-Trong et al., 2018). At present, adult pallial NSCs are viewed as bipotent, able to self-renew and to generate neurons (Adolf et al., 2006; Grandel et al., 2006; Kroehne et al., 2011; Than-Trong et al., 2020). Little is known about neuronal subtypes in the dorsal pallium and it remains unexplored if specific NSC pools give rise to neuronal subtypes (like in the SEZ). The dorsal pallium is deprived of ependymal cells, but hosts an Olig2-positive population of oligodendrocytes. No clear lineage relationship has been made between oligodendrocytes and NSCs. The Olig2-positive population of cells is heterogeneous and located mostly in the parenchyma -although some cells can be found close to the ventricular surface-, comprising mature oligodendrocytes, slow proliferating oligodendrocyte progenitors (OPCs), proliferating OPCs, quiescent OPCs and radial glia-like cells (März et al., 2010b). These observations suggest that oligodendrocytes are produced within the parenchyma from OPCs. A recent publication based on scRNAseq argues that her4.1-positive NSCs express olig2 at very low level, suggesting nascent NSC progeny differentiating toward OPCs (Lange et al., 2020). Likewise, pseudo-lineages inferred from scRNAseq in the mouse SEZ reveal a molecular connection between NSCs and oligodendrocytes (Mizrak et al., 2019). This hypothesis needs to be carefully tested with a lineage tracing approach.
These observations together suggest potential differences between the panel of fates endogenously taken by SEZ, SGZ, and pallial NSCs between mouse and zebrafish. Hence, stemness-related fate choices are complex and not limited to remaining or not stem, but may include the choice of a particular fate. These differences may reflect a different potential, or the presence of different contextual cues.
Stemness-Related Fate Choices in
Zebrafish Pallial NSCs Can Be Taken in
the Quiescent or Activated States
Direct Neuronal Differentiation Is a Frequent Adult NSC Fate in Zebrafish
Both the quiescent and activated NSC states harbor potential windows where stemness can be maintained or altered. In the zebrafish adult pallium, the generation of neurons directly from quiescent NSCs has been suggested based on intravital imaging methods where NSCs were observed to differentiate after over 6–20 days without division (Barbosa et al., 2015b; Than-Trong et al., 2020). Thus, stemness needs to be actively promoted even during quiescence. Some effectors of NSC stemness maintenance have been identified in mice (Ars2 and Sox2) (Andreu-Agulló et al., 2009; Baser et al., 2019) and in zebrafish (Hey1) (Than-Trong et al., 2018).
Interestingly, the depletion of their function in quiescent NSCs leads to a non-stem RG (GS+
; Sox2−
) fate suggesting that direct neuronal differentiation further requires active neuronal commitment cues.
The Mechanisms Driving NSC Fate Choices at Division Remain Poorly Understood
Adult zebrafish pallial NSCs can take several fates at division and generate two NSCs, one NSC and one aNP, or two aNPs. Models of clonal dynamics are compatible with stochastic decisions under physiological conditions (Than-Trong et al., 2020). Following a mechanical lesion, which leads to enhanced NSC recruitment for neuronal regeneration, a bias toward neurogenic consuming divisions (generating two aNPs) was observed (Barbosa et al., 2015b). In contrast, upon pharmacological Notch blockade, enhanced NSC recruitment is accompanied by a bias toward amplifying divisions (generating two aNSCs). It remains largely unknown how these decisions are taken.
Examples of all three division modes were also directly observed in mouse in vivo by clonal analysis of small clones (Bonaguidi et al., 2011; Encinas et al., 2011; Song et al., 2012;
Calzolari et al., 2015;Basak et al., 2018;Obernier et al., 2018) or by live-imaging (Pilz et al., 2018). In both NSC niches, the choice for a given division mode seems to vary in part depending on the driver line used to follow NSCs, and the discrepancies may reflect experimental designs. Still, this observation would argue for the existence of NSC signatures highlighting specific modes of division (Figure 7).
Key studies in embryonic neural progenitors, including in zebrafish, pointed to several mechanisms controlling or biasing daughter cell fate at division. These notably include cell cycle dynamics such as the length of G1 or S phases (Calegari and Huttner, 2003; Huttner and Kosodo, 2005;
Chen et al., 2015; Turrero García et al., 2016), asymmetrical inheritance of cellular components at division (Knoblich, 2008; Kressmann et al., 2015; Tozer et al., 2017; Lukaszewicz et al., 2019; Taverna and Huttner, 2019), and intra-lineage or niche-mediated bias in Notch signaling (Dong et al., 2012). Corresponding data in adult NSCs are sparse and were generally obtained in vitro, in mouse. For example, in cultured adult SGZ NSCs, G1 lengthening (through CDK4 inhibition) pushes NSCs toward differentiation (Roccio et al., 2013). Speculatively, basal process inheritance could be a fate determinant, as suggested by ex vivo SEZ cultures analyzed with live imaging (Obernier et al., 2018). Cultures of individual NSCs from the SEZ also showed asymmetric molecular segregations or activations. Specifically, the asymmetric segregation of the Dual-specificity tyrosine-phosphorylated and regulated kinase Dyrk1A at NSC division stabilizes EGFR and Notch signaling, biasing daughter cell fate (Ferron et al., 2010). Overexpressed Delta1-eGFP fusion protein also distributes asymmetrically upon NSC division, and marks the daughter cell fated to neuronal commitment (Kawaguchi et al., 2013). Finally, PEDF signaling from the niche can locally activate Notch in one NSC daughter (Ramírez-Castillejo et al., 2006; Andreu-Agulló et al., 2009). Parallels to these