HAL Id: inserm-00807595
https://www.hal.inserm.fr/inserm-00807595
Submitted on 23 Apr 2013
HAL is a multi-disciplinary open access
archive for the deposit and dissemination of
sci-entific research documents, whether they are
pub-lished or not. The documents may come from
teaching and research institutions in France or
abroad, or from public or private research centers.
L’archive ouverte pluridisciplinaire HAL, est
destinée au dépôt et à la diffusion de documents
scientifiques de niveau recherche, publiés ou non,
émanant des établissements d’enseignement et de
recherche français ou étrangers, des laboratoires
publics ou privés.
Single cell rheometry with a microfluidic constriction:
quantitative control of friction and fluid leaks between
cell and channel walls
Pascal Preira, Marie-Pierre Valignat, José Bico, Olivier Théodoly
To cite this version:
Pascal Preira, Marie-Pierre Valignat, José Bico, Olivier Théodoly. Single cell rheometry with a
mi-crofluidic constriction: quantitative control of friction and fluid leaks between cell and channel walls.
Biomicrofluidics, 2013, 7 (2), pp.024111. �10.1063/1.4802272�. �inserm-00807595�
Single cell rheometry with a microfluidic constriction:
quantitative control of friction and fluid leaks between cell and
channel walls
Pascal Preira
a, Marie-Pierre Valignat
a, José Bico
band Olivier Théodoly
a*
a Université de la Méditerranée, Adhesion & Inflammation, INSERM U600-CNRS UMR6212, 163 Av. de Luminy, F-13009 Marseille,
France. Fax: +33 (0)4 91 82 88 69; Tel: +33 (0)4 91 82 88 51; E-mail: olivier.theodoly@inserm.fr
b Ecole de Physique et Chimie Industrielles de Paris, Laboratoire PMMH, Paris, France.
1
We report how cell rheology measurements can be performed by monitoring the deformation of a cell in a microfluidic constriction, provided that friction and fluid leaks effects between the cell and the walls of the microchannels are correctly taken into account. Indeed, the mismatch between the rounded shapes of cells and the angular cross-section of standard microfluidic channels hampers efficient obstruction of the channel by an incoming cell. Moreover, friction forces between a cell and channels walls have never been characterized. Both effects impede a quantitative determination of forces experienced by cells in a constriction. Our study is based on a new microfluidic device composed of two successive constrictions, combined with optical interference microscopy measurement to characterize the contact zone between the cell and the walls of the channel. A cell squeezed in a first constriction obstructs most of the channel cross-section, which strongly limits leaks around cells. The rheological properties of the cell are subsequently probed during its entry in a second narrower constriction. The pressure force is determined from the pressure drop across the device, the cell velocity and the width of the gutters formed between the cell and the corners of the channel. The additional friction force, which has never been analyzed for moving and constrained cells before, is found to involve both hydrodynamic lubrication and surface forces. This friction results in the existence of a threshold for moving the cells and lead to a non-linear behavior at low velocity. The friction force can nevertheless be assessed in the linear regime. Finally, an apparent viscosity of single cells can be estimated from a numerical prediction of the viscous dissipation induced by a small step in the channel. A preliminary application of our method yields an apparent loss modulus on the order of 100 Pa.s for leukocytes THP-1 cells, in agreement with literature data.
Introduction
Cell mechanical properties play an important role in the transit of circulating cells in blood microvasculature and are involved in various cardiovascular and immunological pathological disorders. However, in vivo investigation of microscopic events occurring in the microvasculature is a difficult task, especially for deep organs. Non-invasive imagery techniques (e.g. Magnetic resonance imaging, tomography, nuclear and positron imagery, fibroscopy imagery) lack the spatial resolution necessary to analyze microscopic events, whereas optical microscopy requires surgical windows to reach organs of interest1, restricting applications to humans. In this context, microfluidics has emerged in the last decade as a powerful tool to mimic blood microcirculation and probe the behavior of circulating cells in microenvironments2-24. Indeed microfluidic systems circumvent the lack of appropriate living models and provide simplified testing procedures of pharmacological therapeutic treatments9,21,25-30. However, if devices for qualitative probing of cells passage in a microfluidic constriction have fast developed, these approaches remain to be adapted into quantitative tests for circulating cell rheological parameters.
Physicists have developed various tools to measure the rheological properties of living cells. Micropipette experiments yielded the first quantitative data on cell rheology with erythrocytes31-33, and leukocytes34-40. The principle is to suck a single cell into a narrow glass capillary at a controlled pressure and to monitor simultaneously the rate of deformation. More sophisticated techniques allowing direct measurement of forces during cell deformation have later been developed. These techniques are based on the mechanical micromanipulation of cells and involve different equipments, such as atomic force microscopes, microplates, or optical and magnetic traps41. They correspond to microscopic versions of standard rheometers and allow stress relaxation, creep recovery or frequency sweep experiments. Different groups have used these setups to establish the existence of a universal viscoelastic behavior of living cells, which is characterized by dynamic moduli that follow a power law dependence with the excitation frequency. The main asset of these recent techniques is their accuracy. However, they have a low throughput and are difficult to implement into a microfluidic device to analyze non-adherent circulating cells. Conversely, the principle of micropipette experiments is well adapted to microfluidics technologies. The kinetics of cell shape deformation during entry into a microfluidic constriction has for instance already been used to infer
qualitative information on cell compliance properties of leukocytes5,6,9,22,23, erythrocytes10,28,42,43, or cancer cells3,44. However, performing a quantitative measurement of cell rheology with a microfluidic constriction is still challenging.
Microfluidic research is largely dominated by devices fabricated via soft lithography in Polydimethylsiloxane (PDMS) due to fabrication simplicity, cost-efficiency, low cytotoxicity, and permeability to oxygen and carbon dioxide. Nevertheless, performing cell deformation measurements similar to the micropipette technique with standard PDMS microchannels of rectangular cross section presents some difficulties. Indeed, the rounded shape of the cells cannot accommodate the sharp corners of the channels, contrary to the case of pipettes of circular cross-section. The driving liquid may then leak along the edges of the channel. Whereas in micropipette experiments the force acting on the cell is simply given by the pressure drop across the cell times the tube cross-section, the shear force acting on the cell is more difficult to estimate with a microfluidic constriction due to this additive flow. Although PDMS circular microchannels have been fabricated with the aim of imitating actual blood vessels45,46, the fabrication process is not adapted for controlling precisely the shape of complex circuitries. Moreover, developing systems involving rectangular channels presents specific advantages. Indeed, flat channel walls are well adapted to observe cell-surface interactions by optical microscopy during cell transit in a capillary. Efforts in modeling have been undertaken for the entry of a cell in a simple constriction47,48, but they omit leakage and friction effects. A microfluidic micropipette
method was recently described to measure the cell cortical tension, but not the viscous properties, or loss modulus, of cells49. Spatz et al.50 have for instance proposed a system with a cantilever-based polydimethylsiloxane (PDMS) force sensor incorporated into a flow cell chip. This device has the advantage to provide a direct measurement of the compression force that the cantilever exerts on the cell. Herein, we present a new solution to perform micropipette-like experiments with rectangular PDMS micro-channels. To circumvent the difficulty related to the leakage flow, we consider a pair of successive constrictions of increasing confinement. Single cells are navigated in the microfluidic circuitry without deformation and introduced in a first constriction channel designed to be geometrically clogged by the deformed cell. The following constriction of narrower gauge is subsequently used to perform the quantitative force vs. deformation experiment. Measurements of the steady-state velocity of cells flowing in a straight channel allowed us to show, for the first time to the best of our knowledge, that cell friction with walls is non linear with velocity and can have a significant effect in the entry of cells in constrictions. Interferometry imaging of the cell/wall interface can be used to calculate the local pressure drop pushing the cell in presence of corner leaks. We finally show how our method permits in-line determination of the apparent loss modulus of circulating cells once friction and leakage flow effects have been taken into account. The method is suitable for cells with a wide range of deformability, which makes it a versatile tool to investigate cells in the context of pathologies6,51.
Material and methods
Microfabrication. Microfluidic devices were fabricated using standard soft lithography routines52. A positive mould was created with SU-8 2010 negative resin (Microchem, Newton, MA, USA) spin-coated on silicon wafers (Siltronix, Archamps, France) and insulated/aligned with a photolithography device (Süss Microtec, Munich, Germany). Replicas of the moulds were prepared in polydimethylsiloxane, PDMS (Sylgard 184 Silicone Elastomer Kit, Dow Corning, Midland, USA). Ports to plug inlet and outlet reservoirs were punched with a 1 mm outer diameter needle and the devices were finalized by sealing the PDMS piece on a 170 µ m thick glass coverslip via O2-plasma activation
(Harricks plasma) of both surfaces. All channels were incubated with a 1% Pluronic F108 solution (BASF, Mount Olive NJ, USA) for 2 h to deter cell adhesion.
Cell preparation. We used the Human monocytic THP-1 cell line (TIB-202™, ATCC)53 maintained as previously described54.
Microscopy setup. Force vs. deformation measurements were carried at 37°C with a Zeiss axiovert 200 inverted microscope (Carl Zeiss, Jena, Germany) equipped with a Zeiss Plan-Neofluar 100X/1.30 Oil Ph3 objective, and a camera BURLE (model TC65) for fluorescence and phase contrast video-microscopy at 24 frames/s. For reflection interference contrast microscopy (RICM), we used adjustable field and aperture stops, a crossed-polarisers Cube, an Antiflex EC Plan-Neofluar 63X/1.25 Oil Ph3 objective, a high-speed camera Fastcam SA4 (Photron, CA, US) and an X-cite 120Q lamp (Exfo, Mississauga, Canada) coupled to a narrow bandpass filter (1 = 546nm ± 12nm). RICM measurements were performed with an illumination numerical aperture 1.25. We used µManager55 to pilot the set-up, and MATLAB to process images56.
Reflection interference contrast microscopy modeling. Details on the model can be found in previous publication57. We consider two reflecting surfaces, the glass/solution and the solution/cell interfaces and calculate the reflected intensity as a function of the thickness of the film of water separating the cell from the glass substrate using refractive indices of n0 = 1.525 for the glass substrate, n1 = 1.334 for water, n = 1.45 for PDMS and an effective
intensities
I
glass−waterandI
glass−PDMS reflected at the glass/water and glass/PDMS interfaces: Eq. 1 i water glass i i PDMS glass i i N I I I I I − − − − =where the subscript index N stands for normalized, and the superscript index i=t,e stands respectively for theoretical or experimental. The theoretical curve
I
tf
(
h
)
N
=
allows us to convert the experimental intensities e NI
into a local thickness h of the interstitial film between the cell and the glass substrate.Experimental Device
Device rationale of the double constriction device. Since a cell inserted in a narrow rectangular channel cannot perfectly match the angular shape of the corners, the surrounding fluid may leak along the edges upon a pressure gradient (Figure 1-a-i). The force acting on the cell thus results from a combination of pressure gradient and shear stress, which is difficult to model precisely. In our device, the cell is pushed in a first narrow channel, C1, designed in such a way that the deformed cell plugs the channel (Figure 1-a-ii). Considering that C1 has a width W smaller than the cell diameter, its height H1 should be chosen so that the deformed cell touches all sides of channel C1.
Considering volume conservation, a spherical cell of initial diameter Di squeezed in a slit of width W is roughly
deformed into a “puck” of thickness W and diameter Dpu:
Eq. 2 W 3 D 2 D 3 i pu=
C11 should therefore be designed with a height H1 smaller than Dpu in order to limit leakage around the puck. The
force acting on a cell in C1 is thus dominated by pressure drop and can be determined as described in the following section. After the first constriction C1, a narrower channel C21with the same width W but a smaller height H2 is used
to perform the quantitative force vs. deformation measurement during the displacement of the cell from C1 to C2 (Figure 1-a-iii and iv). Other advantages of this double constriction design are to provide a cell deformation that is 2 dimensional and localized (with a small difference between H1 andH2), which significantly simplifies the estimate of
the rheological properties of the cell.
Setup used for single cell experiment. The circuit to select, to isolate and to manipulate single cells (Figure 1-b), has already been described by Gabriele et al.58. The microfluidic chip has two inputs: E1 is connected to a reservoir of
pure cell culture medium R1, E2 is connected to a reservoir R2 containing the suspension of cells to analyze. An output
EO is finally connected to a reservoir RO. The fluids injected in entries E1 and E2 converge at junction JC into a single
channel up to junction Ji, where the flow is split between the analysis circuit, AC (red dashed box in Figure 1-b), and a
bypass (black dashed box in Figure 1-b). The junction Ji is an important element of the device. Indeed, it is
characterized by a highly anisotropic flow division in favor of the bypass route, which fulfils four functions: passive filtering of submicron particles from the AC, selection of single cells to introduce in the AC, finer precision control in the AC through a pressure division, maintenance of a constant pressure drop ∆PAC across the AC with or without any
cell in AC.
The device is built by superposing two layers of resins of thickness 8.5 µ m on the whole design, except on C2 which is only coated with one layer of 8.5 µ m. THP-1 cells of mean diameter 14 µ m move freely with the flow in the whole device except in the constrictions, since the height of the ceiling is HD = 17 µ m and the width of the channels is larger
than 20 µm. This design insures that cells are not damaged or perturbed by interactions with channel walls before they enter the double constriction section. To manipulate cells, the macroscopic pressure drop across the device, ∆Pext, is
changed by a simple actuation of the height of reservoirs R1 relatively to R2 and RO on a centimeter range, which
allows us to reach a precision of a few Pascals for the local pressure driving the cells. Cell selection and isolation are performed at junction Ji, and the force-deformation measurement is performed upon cell passage from constrictions
C1 to C2.
The double constriction. To avoid excessive stress on cells before the force-deformation measurement, it is important to introduce the cells inside C1 as gently as possible. The geometry of the entrance is known to influence the entry time of the cell59, a larger radius of curvature Rcu facilitating the penetration of the cells. The entrance
channel toward C1 is therefore designed with a large curvature Rcu of 150 µ m (Figure 1-c). The typical diameter of
the cells is Di = 14 µ m, which leads to a puck diameter Dpu = 17.5 µ m for channels of width W = 6 µ m. In practice,
the superposition of two resin layers on patterns of small area results into a cumulated thickness smaller than expected. The height of C11is thus of 11 µ m instead of twice 8.5 µ m (Figure 1-d)2 At the end of the process, C1 and C2 have the same width W = 6 µ m, and heights of respectively H1 = 11 µ m and H2 = 8.5 µ m. The small height
difference between C11 and C2 is important in the following since it allows to assume small and localized deformations in the modeling of the force-deformation process.
Results and discussion
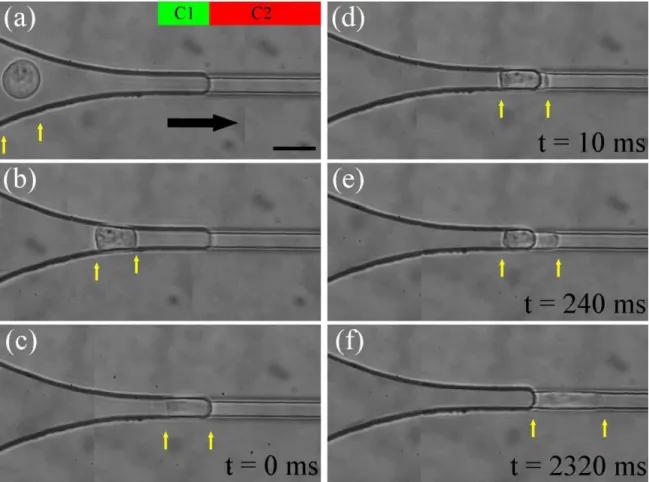
Cell entry in a rectangular constriction with reduced leakages around the cell. Figure 2 presents a sequence of micrographs of a THP-1 cell of diameter 17 µ m entering successively C11 and C2 at a constant external applied pressure of ∆Pext = 400 Pa, which corresponds to a pressure drop across the constriction of 160 Pa. Due to the large
radius of curvature of the connection, the penetration of cells in C1 is significantly facilitated as compared to entries in constrictions with sharp funnel-shaped connections5,51. In order to visualize possible leaks around a cell in C1, we added in the fluid fluorescent nanoparticles of diameter 200 nm. We compare in Figure 3 the flow conditions in a “single constriction” device with funneled entry, which has been used in previous works5,10,51, and in the new “double constriction” device. A force vs. deformation experiment begins when the cell has reached the constriction entrance after the converging neck of the funnel in the case of a “single constriction” device, and the entrance of C2 for the double constriction device. At this point, the flow around the cell is still important in the “single constriction” device, whereas it apparently vanishes in the “double constriction” device. The path followed by fluorescent particles while the image is captured is indeed much shorter in the second situation. This observation validates the double constriction design approach to limit leakage in channel corners.
In terms of orders of magnitude, a typical pressure drop measured across the constriction is ∆PAC =160 Pa (∆Pext
=400 Pa), which leads to a force on the order of 10-8 N for a cell of 6x11 µ m2 cross section that would perfectly clog
the channel. The fluid velocity V leading to the same pressure in the case of a free channel would be on the order of 500 µ m/s. The corresponding Stokes forces acting on the cell (3πηDiV) would thus be of order 10-10 N. This estimate
explains why, with a single constriction device, stiff cells remain blocked for a long time at the entrance and then suddenly enter with a large speed. This sharp transition can be explained by the non-linear increase of the force acting on the cell upon cell deformation. Indeed, the driving force starts from an extremely low value when weak deformation of the cell leads to important leaks of the carrier fluid. However this force increases by two orders of magnitude when the cell is deformed and plugs the channel. From our experience, a single constriction device is not appropriate to perform reproducible and quantitative measurements with stiff cells. Conversely, the double constriction device allows an accurate comparison of cell properties in a wide range of stiffness, which has already allowed us to investigate pathologies involving the plugging of lung microvasculature by stiffened leukocytes60. In the present work, we demonstrate how this device can also be used to infer quantitative rheological analysis on single cells.
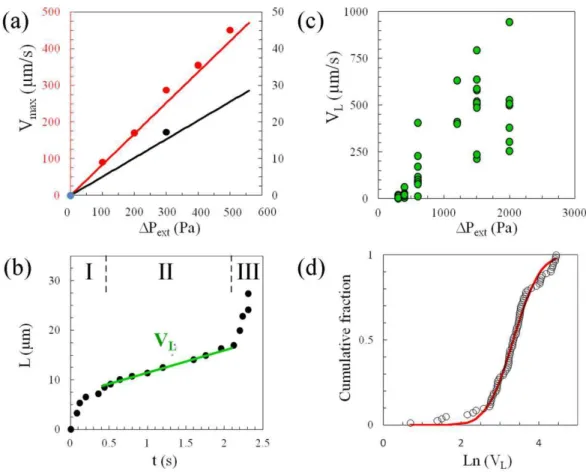
Quantitative force vs. deformation experiment. The quantitative measurement of the force acting on a cell entering C2 requires the absolute control of the local pressure in the device. Flow and pressure through the device can be deduced from a lumped element modeling of the microfluidic circuit applying Kirchhoff’s and Ohm’s laws, as classically done with electrical circuits. Each channel resistance is calculated using the solution of Stokes’ law in a rectangular channel which dimensions are measured through optical profilometry. The details of the derivation for our circuitry are reported by Gabriele et al.58. On Figure 4-a, we compare the predicted maximum fluid velocities
Vmax in two positions of the channels with experimental data obtained from tracking the displacement of fluorescent
nanoparticles. The good agreement (within 8%) between these data (without fitting parameter) validates our modeling of the local pressure drops in the circuit.
Concerning cell deformation, we first verified that the volume of the cell is constant as the cell penetrates into the constriction. For instance, the cell in Figure 2 has initially a spherical shape of diameter Di = 14±0.5 µ m and is
transformed into a block of length L1 = 18 µ m, height H1 = 11 µ m and width W = 6 µ m in C1, and L2 = 22 µ m and H2
= 8.5 µ m in C2. The volume remains therefore within 1400±150 µ m3. The characterization of the deformation of a cell penetrating in C2 is based on the measurement of the extension of the cell in C2, L, as a function of time (Figure 4-b). The curves L(t) present three stages. In the transient first and third stages, the fast increase of L corresponds to the respective entry of the leading and receding edges of the cell in the section C2. The intermediate regime corresponds to the penetration of the main body of the cell. In this stage, L(t) is linear, which allows us to define the corresponding steady velocity, VL. The steadiness of VL for a given cell indicates that the dissipation induced by the deformation of
the cell is constant. VL is therefore a qualitative indicator of a cell rheological dissipation modulus and appears roughly
proportional to the external applied pressure (Figure 4-c). At a given pressure, the data obtained for a population of cells present a distribution that can be nicely fitted by a log-normal function (Figure 4-d). A log-normal distribution is consistent with literature data for other living cells, obtained with other rheometric techniques41.
This distribution provides a qualitative characterization of the deformability of a cell population. A careful analysis is nevertheless required to extract more quantitative insights. Indeed, the absolute force acting on a cell entering into C2 results not only from the pressure drop across the cell but also from the hydrodynamic friction with walls. Several parameters should thus be considered before estimating this force: 1- the pressure drop changes upstream and
downstream of the cell as a function of the velocity VL,2- the pressure drop dependency with residual flow along the
corners of the channel, and 3- the thickness of the lubrication films squeezed between the cell and the channel walls. All the above issues involve complex and intricate hydrodynamic phenomena that will be presented successively in the following paragraphs.
Cell-channel interface: lubrication film and “gutters” in channel corners. The thin glass wall on the microfluidic chip allows Reflexion Interference Contrast Microscopy (RICM) to be implemented to the experimental setup. RICM observations of cells traveling in constriction C2 can be used to determine the topography of the cell membrane in the “contact zone” corresponding to the lower channel (Figure 5-a). The darkest regions on the upper and lower part of the pictures correspond to the glass/PDMS interface, whereas the bright stripe in between corresponds to the glass/water interface inside the channel. The “contact zone” between the cell and the glass surface appears as a dark region in the channel. The grey levels correspond to different distances between the cell and the substrate, darker zones corresponding to thinner lubrication films.
Contact zones present different patterns from one cell to the other. On Figure 5-a-i, the contact zone is homogeneous, indicating that the cell membrane is flat in the vicinity of the walls. The distance from the cell to the surface is on the order of 20 nm in this particular example but typically ranges from 20 to 80 nm for different cells at different applied pressures. The bright ring around the contact zone indicates a larger distance, which corresponds to the concavity of the edge of the cell. On Movie 2 in ESI, the contour of the contact zone has a higher radius of curvature at the front of the cell than at the rear, which is reminiscent of the shape of floppy vesicles forced into constrictions61. Interestingly, the contact zone may occupy the whole apparent channel width, at least within the resolution of the pictures (1 pixel corresponds to 0.18 µ m), which confirms that cells can plug efficiently the cross–section of the channels. However, efficient plugging is not systematic and Figure 5-a-ii presents an example with a gutter between the side of the contact zone and the channel corner. Gutters have a maximum width G on the order of 1.5 µ m and are more frequent with smaller cells. Finally, Figure 5-a-iii presents an example of a contact zone with an irregular topography. This phenomenon concerns about half of cells and is not correlated with any obvious external aspect of the cells. It may arise from inner mechanical inhomogeneities leading to inhomogeneous pressures on walls. A deep understanding of the shape of the gutters and of the contact zone properties as a function of the cells characteristics would deserve much further investigations but is beyond the scope of this paper. In the following, we take advantage of the geometrical characterization of gutters and contact zones to model and analyze the hydrodynamic behavior of cells entering constrictions.
Effect of cell size on the passage through the constriction. Since our method relies on the deformation of polydisperse cells moving through a constriction of fixed geometry, it is important to investigate the influence of the size of the cells in our measurements. We first consider the velocity of the cell in C2, after the complete entry of the cell in C2. We report in Figure 5-b the cell velocity 500 µ m downstream of C2 entrance, VC2, normalized by the mean
fluid velocity in C2 at the same applied pressure but in the absence of the cell, VMF. The ratio VC2/VMF is found to
depend strongly on the size of the cell: it is larger than 1 for the smallest cells, decreases with the cell size and reaches a plateau order of 0.3 for cells of diameters larger than 15 µ m. The fact that small cells travel faster than the average fluid velocity in the absence of cells, can be explained by the position of cells in the centre of the channel where the flow is faster than in the vicinity of the walls. Conversely, large cells tend to clog more efficiently the constriction, like a “piston”. Since the ratio VC2/VMF is significantly smaller than 1, we can deduce that “piston”-cells
are slowed down by friction against the walls62. Additional insights on friction can finally be extracted from RICM images, which shows that the mean cell-to-wall distance h in the contact zone depends strongly on cell size for cells traveling in C2 (Figure 5-c). The distance h is found smaller for larger cells, indicating a higher pressure against the wall. These observations show the importance to select cells of comparable size to investigate the dependence of friction with the cells velocity. Indeed, data with cells of diameters limited to the range 13-15 µ m (Figure 5-d) show that h is hardly dependent on velocity. This result is further discussed in the friction force section.
Pressure force in presence of gutters. In our setup, fluid flows are precisely controlled through the pressure drop across the device, ∆Pext, imposed externally with columns of fluid. However, the relevant parameter to derive the cell
force vs. deformation data is the local pressure drop across the cell, ∆Pcell. Indeed, the resulting pressure force,
Fpressure, acting on a cell moving along a constriction is given by:
Eq. 3 Fpressure=∆PcellScell
where Scell is the cross section of the cell in the constriction. Let us estimate ∆Pcell from ∆Pext. The pressure drop
across the analysis circuit, ∆Pac, is not significantly affected by the presence of a cell in the analysis circuit, as a
result of the large asymmetry of flow rate at the Ji junction58. ∆Pac is therefore stable and proportional to ∆Pext. We
now consider the pressure drop in the analysis circuit in presence of a cell. As sketched in Figure 6-a, ∆Pac can be
Eq. 4 : ∆Pcell=∆Pac−
(
Rup+Rdown)
Qwhere Rup and Rdown are the hydrodynamic resistances of the analysis circuit upstream and downstream of the cell and
can be directly derived from the geometry of the channels. The only unknown parameter in Eq. 4 is the flow rate Q, which is not directly measured but can be inferred from the velocity and the shape of the cell in the constriction. In the absence of leaks through the gutters, the cell indeed acts as a tight piston and Q is equal to the cell velocity, Vcell,
times cell cross-section Scell. The local pressure acting on cells in absence of gutters, ∆Ppiston, can been expressed as:
Eq. 5 ∆Ppiston=∆Pac−VcellWH(Rup+Rdown )
where W and H are the width and height of the channel. Due to the possible leakage of the fluid along the gutters, Q is actually the resultant of two contributions, the flow rate due to the piston-cell, Vcell Scell, and the sum of the flow rates
in each gutter, Qgutter. The cross-section of gutters in each corner is delimited by the channel walls and by the surface
of the cell, which is approximately an arc of circle (Figure 6-b), with a radius of curvature G. We solve numerically Stokes equation in this geometry with no slip boundary conditions on the walls (due to the high contrast of viscosity with the solution, the cell is considered as a rigid wall) within the limit where the velocity of the cell is negligible in comparison with the average velocity in the gutter. We obtain the hydrodynamic resistance of gutters, Rgutter:
Eq. 6 gutter4 gutter G L 254 . 0 1 R = η
where the length of the gutters Lgutter, and the radius of curvature, G, are experimentally determined from RICM
pictures, G being equal to the width of the non-contact zone in corners (Figure 6-b). The global flow rate Q can thus be expressed as (still within the limit of a slow cell):
Eq. 7
(
(
)
)
gutter cell 2 cell gutter cell cell R P 4 4 G WH V Q 4 S V Q= + = − −π + ∆Combining Eq. 4 and Eq. 7 finally allows us to express the local pressure drop across a cell moving in a constriction with flow leakage in gutters, to ∆Pcell, as:
Eq.8
(
)
[
(
)
(
(
)
)
cell]
2 down up ac down up gutter gutter cell P R R WH G 4 V R R 4 R R P ∆ π ∆ − + − − + + =where all parameters are experimentally available. The influence of gutters on the local pressure across a cell, appears clearly in Figure 6-d where ∆Pcell and ∆Ppiston (normalized by ∆PAC) are reported for cells of different diameters and for
∆PAC ranging from 100 to 1000 Pa. Eq.8 corrects efficiently the irrelevant negative pressure drops obtained for the
smallest cells with Eq. 5. However the correction becomes negligible for cells larger than 14 µ m. With the present device, gutter effects on the pressure force Fpressure can therefore be neglected for cells of diameter larger than 14 µ m.
Note that the latter result is not trivial at the light of the literature on deformable objects (bubbles, drops) traveling in channels of rectangular cross-section63,64,65,66,67,68,69. Wong et al.67,68 have for instance shown how changing a channel
cross section from circular to polygonal modifies drastically the fluid flow in the presence of bubbles, because the lubricating layer present in the gutters is orders of magnitude thicker than the thin layer observed in a cylindrical channel62. In a cylindrical channel, a bubble is indeed more difficult to move because of the large drag exerted in the homogeneous lubrication film. Conversely, in a rectangular channel, the liquid can flow along the leaky corners with a speed of one order of magnitude larger than the speed of the bubble. However, these conclusions for bubbles do not apply straightforwardly to cells, which adopt different conformations than bubbles and drops in a constriction. Indeed, the shapes of both front and rear ends of a quasi-static drop or bubble in a square constriction of side 2R are hemispherical shapes with a radius close to R. According to Laplace law, the curvature of the bubble/drop in channel corners is therefore R/2 (with a minor correction70). Gutters for bubbles or drops are therefore much wider than gutters observed with cells (Figure 6-c). Indeed, interfacial tension of bubbles/drops is in the range 10-70 mN/m, whereas the cell cortical tension is typically 10-2 mN/m71. This difference by three orders of magnitude can explain why surface tension play a much lesser role in dictating the shape of cells as compared to drops and bubbles.
Friction force and lubrication film. For a highly viscous object like a cell, the main dissipation due to the cell motion relative to the channel walls arises from shearing the lubricating film separating the moving object from the cell walls. This assumption is valid as long as viscous dissipation in the film is lower than it would be in within the cell in the absence of lubrication: 72 Eq. 9 1 H / H / film film cell cell >> η η
With hcell = 5 µ m, hfilm = 10 nm, ηfilm = 10-3 Pa.s and ηcell = 100 Pa.s71, the ratio of Eq. 9 is equal to 200. In our case,
the friction force, Ffriction, can thus be written as:
Eq. 10 1 2 3 4 5 6 + = W H 1 2 h S V F cell c 2 friction η
where h is the average thickness, Sc the area of the contact zone on the lower channel wall measured from RICM
pictures, and 2(1+ H2/W) is a multiplicative factor which accounts for the contact zone corresponding to the three
other interfaces. From a theoretical point of view, the thickness of the lubricating layer is expected to rely on a balance between viscous dissipation and interfacial forces and to follow Bretherton’s law73,62:
Eq. 11 2/3 2Ca
H h∝
which should be valid while surface forces remain negligible (typically for h > 100 nm). However, our experimental results in Figure 5-c indicate a thickness on the order of 70 nm practically independent from the cell velocity. Eq. 11 is therefore not valid in our case. The thickness of the lubricating layer may however be inferred from the balance between Ffriction and Fpressure in a steady regime, using Eq. 3 and Eq. 10 with the data for the cell velocity in C2. This
approach yields a thickness for the lubrication film in a range 5-30 nm (Figure 6-e), which is significantly smaller than the data measured by RICM. Nevertheless, the gap between the glass and the cell membrane is not only occupied by a free flowing film layer but also by the polymer and glycocalyx layers coating the glass and cell surfaces74. Our optical measurements may therefore overestimate the actual thickness of the lubricating film. However, both approaches agree that the lubrication film is too thin to exclude the effect of surface forces and consider only a hydrodynamical approach. A deeper characterization of the complex cell/wall friction mechanics is a difficult task and is beyond the scope of this paper. For our present purpose, our analysis of the balance of Ffriction with Fpressure allows us to get the
magnitude of the friction force on a cell in a constriction versus its velocity, which can be used to interpret force– deformation experiments.
Small deformation and steady state regime. We now focus to the phase where a cell enters at constant velocity in the second constriction C2 (Figure 4, stage II). We would expect that the dissipation induced by the step is dominant (Figure 7-b,c). Since the step is relatively small (2 µ m for a height on the order of 10 µ m and a cell length around 20 µ m), most of the dissipation should be localized and invariant during the whole transfer of the body of the cell from constrictions 1 to 2. However, we find that the velocity of the cell during this stage, VL, is not negligible as compared
to the velocity of the cell travelling freely in the constriction 2, VC2. In other words, the friction force Ffriction cannot be
neglected when compared to the force exerted by the step Fstep. To the best of our knowledge, this additional friction
force has never been taken into account in previous works.
Note finally that the friction force should in principle be different in C2 and C1. Nevertheless since the cross-sections of both constrictions are very close we neglect this slight difference in force. The linear regime observed in stage II confirms this approximation.
Apparent cell loss modulus. We have shown that the cell deformation in double constrictions can be monitored with a quantitative control of friction and fluid leaks between cell and channel walls. We describe how to extract rheological properties of single cells. The only rheological data accessible in the literature have been performed with the micropipette technique. Interestingly, this technique is very similar to the present double constriction method. In most of these works, cells are considered as viscous liquid droplets surrounded by an elastic membrane38. The elastic behavior influences mostly the threshold pressure to deform single cells through the constrictions, whereas for small deformations, pressure dissipation within the cell cortex was deemed negligible75,. We thus propose to model the cell as a mostly viscous blob and to extract an apparent viscosity. This approach has the advantage to provide data that are directly comparable to previous micropipette data. However, recent experiments suggest that a more appropriate model should include visco-elasticity41. Nevertheless, the loss modulus (viscous dissipation) is found to be dominant for frequency solicitations larger than 100 Hz. In our data, with VL > 200 µ m/s and step height of 2 µ m, the typical
frequency rate is larger than 100 Hz and cell can therefore reasonably be considered as mostly viscous.
To determine the viscous dissipation imposed by the step during the quasi-static transfer of cells from C1 to C2 (Figure 4, stage II), we have simulated with the finite element software FreeFem++ the flow of a viscous fluid filling entirely the double constriction with boundary conditions of total slip at the channel walls. The selection of this condition was motivated by the presence of a lubrication layer between the cell and the walls of the channel. The contribution of the step in the global pressure drop has been finally fitted by the third order polynomial function:
Eq. 12 7 7 8 9 A A B C 1 1 2 3 4 4 5 6 + 1 1 2 3 4 4 5 6 + 1 1 2 3 4 4 5 6 = 3 1 2 1 1 2 1 2 2 step H H 0 . 15 H H 14 . 4 H H 66 . 0 H H u P η ∆ ∆ ∆ ∆
This expression provides an estimate of the pressure with an accuracy of 2%. If friction is neglected, an apparent viscosity of the cell, ηapparent, can be derived directly from Eq. 12 using ∆Pcell in place of ∆Pstep and VL in place of u2.
However, since friction during the cell entry in C2 is not negligible, the applied pressure ∆Pcell is dissipated both in
the deformation induced by the step and in friction. We assume, as discussed further below, that the friction force is proportional to the cell velocity. The contribution of the step on the pressure drop is then given by ∆Pstep=∆Pcell
.(1-VL/ VC2), where VC2 is the cell velocity after completed entry in C2. Figure 8-a reports the estimation of the apparent
viscosity for different cells at different applied pressures where ∆Pstep has been corrected. We observe a plateau
around ηapparent =100 Pa.s at large pressures, which is remarkably consistent with data from the literature for THP-1
cells76 and other leukocytes38,39,71 The apparent viscosity ηapparent also tends to slightly increase with the applied
pressure (or the solicitation rate), which is consistent with recent characterization of cell rheological behaviorError! Bookmark not defined.,77. These results validate our microfluidic method and our analysis to extract quantitative information from the passage of a cell in a microfluidic constriction at high-applied pressures.
Non-linear friction vs. velocity. At low applied pressures, our analysis of ηapparent in Figure 8-b yields a diverging
cell viscosity, while the loss modulus of living cell is expected to decrease for lower rates of deformation. To understand this non-physical behavior, we conducted precise measurements of the cell velocity VC2 versus pressure
for individual cells (Figure 8-b). In the regime of high pressure, we observe that VC2 increases linearly with pressure,
as assumed in our analysis of ηapparent in Figure 8-b. However, in the regime of low pressure the evolution of the
friction force is strongly non-linear: VC2 decreases more rapidly than the linear behavior observed at high pressures,
and we find a threshold in pressure before initiating a movement of the cell (between ∆Pext = 100 and 300 Pa from one
cell to another). Since our analysis is based on linear friction, our estimate of ηapparent can only be valid in the regime
of high pressures, ∆Pext > 800 Pa (Grey area in Figure 8). Altogether, our results confirm that friction can play a
significant role during the passage of the cell in constrictions, although this effect has been largely overlooked in the literature. However, we have shown that friction effects in the linear regime of high cell velocities can be efficiently taken into account to assess quantitatively the apparent loss modulus of individual cells from their deformation during their passage in a constriction.
Final protocol to measure cell loss modulus with a double constriction. In this paper, the precise investigation of friction and gutter effects has necessitated a series of measurements with multiple techniques including interference microscopy. Finally, rheological measurements with the double constriction can however by assessed from a rather simple protocol. Only two parameters shall be recorded by video-microscopy: the kinetics of the projection length in C2, L(t), and the cell velocity in C2 after completed entry, VC2. The velocity of the extension of the cell VL is
extracted from the linear regime of L(t). The effective pressure drop across the cells, ∆Pcell., is determined from a
standard pressure drop calculation in a circuit of resistive channels, considering that cells behave as non-leaky pistons. This latter assumption is valid for cells sufficiently deformed in C1, i.e. in our case for cells of diameter larger than 14 µ m. Finally, Eq. 11 with u2=VL and ∆Pstep=∆Pcell.(1-VL/ VC2) yields the apparent cell viscosity in the
plateau region at high pressure. This protocol has been optimized for THP-1 cells. To extend the method to other cellular systems, appropriate adjustments may have to be developed. The geometry of the double constriction should be adapted to the average size of the cells of interest. Moreover the experimental conditions where gutters are negligible and friction is linear should be determined.
Conclusion
We have designed a novel double constriction device to measure in line the loss modulus of circulating cells in a microfluidic chip, by monitoring the deformation kinetics of a cell when passing a small step. The squeezing of a cell in a first constriction limits flow leaks along the angular edges of the channels and the deformation is measured in a second constriction. Optical interferometry of the cell/wall interface and steady-state cell velocities in straight channels have been used to estimate the effective pressure and friction forces acting on the cell during the passage of the step by taking into account residual flow leaks through the corners of the channels. Since the thickness of lubrication films is on the order of tens of nanometers, friction is not purely hydrodynamic but also involves surface forces effects. Moreover, friction is not negligible as compared to pressure force and has to be accounted for in rheological measurements. The dependence of friction with velocity is not linear for low velocities and we measure a threshold in pressure to initiate the motion of the cell. In the linear friction regime at high velocity, the measurement of the velocity of the cell exiting the step can be used to estimate friction during step passage. The loss modulus of individual cells can finally been determined quantitatively. One advantage of this novel cell micro-rheometer relies on the possible integration of multiple analysis devices for single-cells. For instance the surface of the flat channels permits a precise investigation of cell-surface interactions in micro-channels using optical microscopy techniques for surfaces investigations (SEEC, RICM, TIRF). The method is adapted to probe cells of high rigidity and can be useful for the study of pathologies such as ARDS, cancer, sepsis, or pneumonia. We hope it will inspire future tools for medical analysis.
Acknowledgements.
The authors are grateful to P. Bongrand, F. Gallet, A. Asnacios, and M. Sokol for helpful discussions. They also thank Rhodia Company (LOF, Pessac, France), as well as I. Ozerov and F. Bedu from Cinam (CNRS, Marseilles, France) for technical support with microfabrication. PP’s PhD grant was supported by Région PACA and the company CAPSUM-SAS.
Figures
Figure 1: Device rationale and fabrication. (a) Sketch representing the passage of a cell in a double constriction device. i. Spherical cell blocked at the entrance of a rectangular constriction. Red arrows illustrate flow leaks around the cell in the channel corners. ii. The cell is squeezed in constriction C1. The deformed cell fills the cross-section of the channel and plugs the passage of the fluid around the cell. iii. Cell deformation during the penetration into constriction C2, L is the projection length of the cell in C221 iv. End of the stage of cell entrance in constriction C2. (b) Design of the microfluidic device showing the inputs E1 and E2 for medium and cell suspensions and the output EO. The junction Ji divides the flow between
the analysis circuit (red dashed box), and a bypass (black dashed box). Ji is used to select and isolate cells of interest. The
dark circle localizes the portion of the device zoomed in (c). The scale bar corresponds to 500 µm. (c) Design of the double constriction device, showing the entrance and exit zones (grey), the first constriction C1 of cross-section WxH1 = 6x11 µm
(green) and the second constriction C2 of cross-section WxH2 = 6x8.5 µm (red). The entrance channel leading to C1 has a
radius of curvature Rcu of 150 µm. All channels except C2 have a targeted height of 17 µm. The black disk has a diameter of
14 µm like the cells used in the experiments. The scale bar corresponds to 100 µm. (d) SEM micrograph of the resin mould of double constriction zone (the scale bar corresponds to 20 µm).
1
Figure 2: Cell force vs. deformation experiment in a double constriction. Series of micrographs showing THP-1 cells of diameter Di = 17 µm (a) flowing freely with the flow in the entrance zone of C1, (b) squeezed during entry in C1, (c) stoppedin C1 at the entrance of C2, (d-e) transferring from C1 to C2, and (f) after complete entry in C2. The green and red bars in (a) indicate the position along the axis of the transition between constrictions C1 and C2, the black arrow in (a) shows the direction of the fluid flow in the whole experiment, and the yellow arrows point to the back and front edges of the cell. The scale bar corresponds to 20 µm. [Enhanced Online]
1
1
Figure 3: Reduction of flow leaks around a deformed cell in a double constriction. Micrographs showing the fluid flow, materialized by fluorescent nanoparticles, when a cell has just arrived at the entrance of (a) the constriction of a simple constriction device5 of size 4x16 µm, and (b) the constriction C2 of a double constriction device. The flow is stopped by the cell in (b) but not (a). White dashed lines underline the edges of the cell. The green and red bars in (b) indicate the position along the axis of the transition between constrictions C1 and C2. The scale bar corresponds to 10 µm.
1
Figure 4: Measurement with a double construction device. (a) Comparison of experimental (dots) and computed (solid line) of the maximum fluid velocities Vmax at two positions in the device, before the bifurcation Ji (red data) and in
the analysis circuit (black data) at positions indicated by respectively red and black arrows in Fig1-b. (b) Cell projection length in C2, L, versus time, t, of a THP-1 cell of diameter 14 µm at an applied pressure ∆Pext = 400 Pa. Stages I,
II, III correspond respectively to the entry of the cell front in C2, the transfer of the cell body from constriction C1 to C2, and the final entry of the rear of the cell. The slope in stage II yields the velocity of the projection length, VL. (c) Velocity of the
projection length in stage II, VL, against the external applied pressure ∆Pext. (d) Cumulative fraction of cells vs. VL at
∆Pext = 400 Pa of normal THP-1 cells (dots) and fit (black line) with a log-normal distribution in semi-log
representation.
1
1
Figure 5: Effect of the size of the cell and of the contact zone on the cell flow. [Enhanced online] (a) RICM Imaging of the cell-wall interface of different THP-1 cells at the end of constriction C2 moving at a steady-state velocity showing: (i.) a flat homogeneous contact zone without measurable gutters along the corners, (ii.) a contact zone with gutters of width 1.5 µm along the corner, (iii.) an inhomogeneous contact zone. The scale bar corresponds to 10 µm. (b) Cell velocity in C2, VC2,measured 500 µm away from the entrance of C2, normalized by the mean fluid velocity in C2 in the absence of cells, VMF at
the same applied pressure versus the initial diameter of the cell, Di, for different cells and applied pressures. (c) Cell-to-wall
distance in the contact zone, h, estimated from RICM images of cells traveling in C2, versus the cell diameter, Di, for
different cells and applied pressures. (d) Distance h versus cell velocity in C2, VC2, for cells of diameters limited to a range
1
Figure 6: Pressure and friction force. (a) Sketch showing the distribution of pressure drop in the analysis circuit with a single cell in the channel. (b) Sketch of the contact zone around a cell squeezed in a channel. Insert is a zoom on the cross-section in the plane (xy) of the gutter. The width of the gutter, G, which is also the radius of curvature of the cell along the corner, can be directly measured in RICM pictures on the interval between the edges of the channel and the contact zone of the cell. (c) Comparison of the section of a bubble or a liquid droplet (yellow) obstructing a channel of side 2R with the case of a living cell (grey). Section plane is (yz) in i- and (xy) ii- and iii-. The tip of droplet or bubble has a spherical cap shape with a radius close to R leading to rounded sections with radii R/2 in corners. From our observations, corners of cells are much sharper. (d) ∆Pcell* (red circles) and ∆Ppiston* (black circles) correspond to
∆Pcell and∆Ppiston calculated with Eq.8 and Eq. 5 and normalized by∆Pac.Data are reported against the diameter of the
cells, Di, and correspond to a range of ∆Pac between100 and 1000 Pa. (e) Thickness of lubrication film, hv estimated
from ratio of Ffriction and Fpressure as calculated using equations Eq. 3 and Eq. 10. The red dots correspond to data where
Figure 7: Constant viscous dissipation in the vicinity of the step. Sketch representing the different stages of the cell entry from constriction C1 to C2, (a) stage I, (b, c) stage II and (d) stage III. During stage II, the viscous dissipation due to cell deformation is constant and localized in the vicinity of step (red shadow).
1
1
Figure 8: Measurement of the cell loss modulus with a double constriction setup. (a) Apparent cell viscosity, ηapparentmeasured for different cells versus applied pressure. The grey zone corresponds to the range of pressure where friction is abnormally high. (b) Velocity of a cell in C2, VC2, versus applied pressure ∆Pext for 3 different cells of
diameter Di = 15.5 µ m (1) and 13.5 µm (1,2). The solid line is a guide to the eye for the linear behavior at high
pressure. The black arrows indicate the threshold of pressure required for moving the cell. The grey area underlines the range of pressures where VC2 is abnormally lower than the linear dependence.
1
1
1
1
References
1111111111111111111111111111111111111111111111111111111111
11M. R. Looney, E. E. Thornton, D. Sen, W.J. Lamm, R.W. Glenny and M. Krummel, Nat. Methods, 2011, 8, 91-96. 2 Y. Zheng and Y. Sun, Micro&Nano Lett., 2011, 6, 327-331.
3 H. W. Hou, W. C. Lee, M. C. Leong, S. Sonam, S. R. K. Vedula and C. T. Lim, Cell. Mol. Bioengineering, 2011, 4, 591-602. 4 M. Nishino, H. Tanaka, H. Ogura, Y. Inoue, T. Koh, K. Fujita, and H. Sugimoto, J. Trauma, 2005, 59, 1425–1431. 5
S. Gabriele, A. M. Benoliel, P. Bongrand and O. Theodoly, Biophys. J., 2009, 96, 4308-4318.
6 P. Preira, T. Leoni, M.-P. Valignat, A. Lellouch, P. Robert, J.-M. Forel, L. Papazian, G. Dumenil, P. Bongrand and O. Théodoly, Int. J.
Nanotechn., 2012, 9, 529 – 547.
7 M. J. Rosenbluth, W. A. Lam, and D. A. Fletcher, , Lab. Chip, 2008, 8, 1062–1070. 8
K. C. Chaw, M. Manimaran, E. H. Francis, and S. Swaminathan, Microvascular research, 2006, 72, 153-160.
9 B. Yap, and R.D. Kamm, J. Appl. Physiol, 2005, 98, 1930–1939.
10J. P. Shelby, J. White, K. Ganesan, P.K. Rathod, and D.T. Chiu, PNAS, 2003, 100, 14618-14622.
11R.J. Hawkins, M. Piel, G. Faure-Andre, A.M. Lennon-Dumenil, J.F. Joanny, J. Prost, and R. Voituriez, Phys. Rev. Lett., 2009, 102, 058103. 12J. Jacobelli, R. S. Friedman, M. A. Conti, A. M. Lennon-Dumenil, M. Piel, C. M. Sorensen, R. S. Adelstein and M. F. Krummel, Nature
Immunology, 2010, 11, 953-961.
13 K. C. Chaw, M. Manimaran, F. E. H. Tay and S. Swaminathan, J. Phys.: Conf. Series, 2006, 34, 747-751.
14 A. D. Van der Meer, A. A. Poot, M. H. G. Duits, J. Feijen, and I. Vermes, J. Biomed. and Biotech., 2009, ID.823148, 1-10. 15 E. W. K. Young, and C. A. Simmons, Lab. Chip, 2010, 10, pp.143-160.
16 J.W. Song, W. Gu, N. Futai, K. A. Warner, J. E. Nor, and S. Takayama, , Anal. Chem, 2005, 77, 3993-3399. 17
E. Tkachenko, E. Gutierrez, M.H. Ginsberg. and A. Groisman, Lab. Chip, 2009, 9, 1085-1095.
18 O. F. Khan and M. V. Sefton, Biomedical Microdivices, 2011, 13, 69-87.
19 A. D. Van der Meer, A.A. Poot, J. Feijen, and I. Vermes, Biomicrofluidics, 2010, 4, 011103, pp. 1-10.
20 J. W. Song, S. P. Cavnar, A. C. Walker, K. E. Luker, M. Gupta, Y. C. Tung, G. D. Luker and S. Takayama, Plos one, 2009, 4, 6, e.5756. 21 J. B. Shao, L. Wu, J. Z. Wu, Y. H. Zheng ,H. Zhao, Q. H. Jin, and J. L. Zhao, Lab Chip, 2009, 9, 3118-3125.
22 McFaul, S. M., Lin, B. K. & Ma, H., Lab Chip, 2012, 12, 2369–2376. 23 S.A. Vanapalli, M.H.G Duits, F. Mugele, Biomicrofluidics 2009, 3, 012006.
24 P. Preira , V. Grandné , J.-M. Forel , S. Gabriele , M. Camara and O. Theodoly, Lab Chip, 2013, 13, 161-170.
25 D. Huh, B.D. Matthews, A. Mammoto, M. Montoya-Zavala, H. Yuan Hsin and D.E. Ingber, Science, 2010, 328, 1662-1668.
26 A. Gunther, S. Yasotharan, A. Vagaon, C. Lochovsky, S. Pinto, J. Yang, C. Lau, J. Voigtlaender-Bolz and S.-S. Bolz, Lab Chip, 2010, 10,
2341-2349.
27 J.P. Shelby, J. White, K. Ganesan, P.K. Rathod and D.T. Chiu, Proc Nat Acad Sci, 2001, 100, 14618-14622. 28 M. Abkarian, M. Faivre and H.A. Stone, Proc Nat Acad Sci 2006, 103, 538-542.
29 K. Tsukada, E. Sekisuka, C. Oshio and H. Minamitani, Microvasc Res, 2001, 61, 231-239.
30 K.C. Chaw, M. Manimaran, F.E.H. Tay and S. Swaminathan, Microvascular Research, 2006, 72, 153-160. 31 R.P. Rand, and A.C. Burton., Biophysical Journal, 1964, 4, 115-135.
32 E.A. Evans, Biophyical Journal, 1973, 13, 941-954. 33
S. Chien, Blood Cells, 1977, 3, 71-99.
34 M.A. Lichtman, J. Clin. Invest. 1973, 52, 350-358.
35 M.E. Miller, and K. A. Myers., J. Reticuloendothel. Soc., 1975, 18, 337-345. 36 G.W. Schmid-Schonbein, Y.Y. Shih, and S. Chien, Blood, 1980, 56, 866-875.
37 G.W. Schmid-Schonbein, K.-L. Paul Sung, H. Tozere, R. Skalak, and S. Chien, Biophys. J., 1981, 36, 243-256. 38
E. Evans and B. Kukan, Blood, 1984, 64, 1028-1035.
39 D. Needham and R.M. Hochmuth, B. Biomed. Eng, 1990, 112, 269-276.
40 F. Richelme, A.M. Benoliel and P. Bongrand, Cell motility and the cytoskeleton, 2000, 45, 2, 93-105.
41 M. Balland, N. Desprat, D. Icard, S. Fereol, A. Asnacios, J. Browaeys, S. Henon and F. Gallet, Phys. Rev. E, 2006, 74, 021911. 42
T. Herricks, M. Antia and P.K. Rathod, Cell Microbiol., 2009, 11, 1340-1353.
43 S.C. Gifford, J. Derganc, S.S. Shevkoplyas, T. Yoshida and M.W. Bitensky, Brit. J. Haemathol., 2006, 135, 395-404. 44 Z. S. Khan, S. A. Vanapalli Biomicrofluidics. 2013, 7, 011806.
45
E. Kang, S.-J; Shin, K.H. Lee and S.-H. Lee, Lab on a Chip, 2010, 10, 1856-1861.
46 L.K. Fiddes, N. Raz, S. Srigunapalan, E. Tumarkan, C.A. Simmons, A.R. Wheeler and E. Kumacheva, Biomaterials, 2010, 31, 3459-3464. 47 C. Zhou, P. Yue and J. Feng, Ann Biomed Eng, 2007, 35, 116-780.
48 F. Y. Leong, Q. LI, C. T. Lim, K. H. Chiam, Biomed model mechanobiol , 2011, 10, 755-766. 49
Q. Guo, S. Park and H.S. Ma, Lab Chip, 2012, 12, 2687-2695.
50 N. Walter, A. Micoulet, T. Seufferlein and J. P. Spatz, Biointerphases , 2011, 6, 117-125.
51 P. Preira, T. Leoni, M.-P. Valignat, A. Lellouch, P. Robert, J.-M. Forel, L. Papazian, G. Dumenil, P. Bongrand and O. Theodoly, Int. J.
Nanotechnol., 2012, 9, 529–547.
52 Y. Xia and G. M. Whitesides, Angew. Chem., 1998, 37, 550-575.
53 S. Tsuchiya, M. Yamabe, Y. Yamaguchi, Y. Kobayashi, T. Konno, and K. Tada., 1980, Int. J. Cancer., 26, 171-176. 54 J. Vitte, A.-M. Benoliel, P. Eymeric, P. Bongrand and A. Pierres. Biophys. J., 2004, 86, 4059-4074.
55 A. Edelstein, N. Amodaj, K. Hoover, R. Vale and N. Stuurman Computer Control of Microscopes Using 2Manager. Current Protocols in
Molecular Biology , 2010, 14.20.1-14.20.17
56 W.S. Rasband, ImageJ, U.S. National Institute of Health, Bethesda, Maryland, USA, http://rsb.info.nih.gov/ij/,1997-2010.;
http://www.micro-manager.org/
57 O. Theodoly, Z.-H. Huang and M.-P. Valignat, Langmuir, 2010, 26, 1940-1948.
58 S. Gabriele, M. Versaevel, P. Preira, and O Theodoly, Lab on a Chip, 2010, 10, 1459–1467. 59
M. Bathe, A. Shirai, C.M. Doerschuk and R.D. Kamm, Biophysical Journal, 2002, 83, 1917-1933.
60 P. Preira, J.-M. Forel, P. Robert, F. Xeridat, P. Bongrand, L. Papazian and O. Theodoly, A Microfluidic Study of Early Acute Respiratory
111111111111111111111111111111111111111111111111111111111111111111111111111111111111111111111111111111111111111111111111111111111111111111111111111111111111111111111111111111111111
161 V. Vitkova, M. Mader and T. Podgorski, Europhys. Lett., 2004, 68, 398–404. 62 C. N. Baroud, F. Gallaire and R. Dangla, Lab on a Chip, 2010, 10, 2032-2045. 63
J. Bico and D. Quéré, J. Coll. Int. Sci., 2002, 247, 162-166.
64
W.B. Kolb and R. Cerro, J. Coll. Int. Sci., 1993, 159, 302-311.
65 T.C. Thulasidas, M.A. Abraham and R.L. Cerro, Bubble-train flow in capillaries of circular and square cross section, Chem. Eng.
Sci., 1995, 50, 183-199.
66 T.C. Ransohoff and C.J. Radke, J. Coll. Int. Sci., 1988, 121, 392-401. 67 H. Wong, C. J. Radke, S. Morris, Journal Of Fluid Mechanics, 1995, 292, 71-94. 68
H. Wong, C. J. Radke, S. Morris, Journal Of Fluid Mechanics, 1995, 292, 95-110.
69 S.A. Vanapalli, A.G. Banpurkar, D. van den Ende, M.H.G. Duits and F. Mugele, Lab Chip, 2009, 9, 982-990. 70
M. Dong and I. Chatziz, J. Coll. Int. Sci, 1995, 172, 278-288.
71 R.M. Hochmuth, Journal of Biomechanics, 2000, 33, 15-22.
72 J. Bico and D. Quere, Journal of Fluid Mechanics, 2002, 467, 101-127. 73 F. P. Bretherton, Journal of Fluid Mechanics, 1961, 10, 166–188. 74 E. R. Damiano, Microvasc. Res., 1998, 55, 77–91.
75 A. Yeung and E. Evans, Biophysical Journal, 1989, 56, 139-149.
76 Fabienne Richelme, Anne Marie Benoliel and Pierre Bongrand, Experimental Biology Online, 1997, 2-5 77
X. Trepat, D. Linhong, A.S. An, D. Navajas, D. J. Tschumperlin, W. T. Gerthoffer, J. P. Butler and J. J. Fredberg, Nature, 2007, 447, 592– 595.

![Figure 5: Effect of the size of the cell and of the contact zone on the cell flow. [Enhanced online] (a) RICM Imaging of the cell-wall interface of different THP-1 cells at the end of constriction C2 moving at a steady-state velocity showing: (i.) a flat](https://thumb-eu.123doks.com/thumbv2/123doknet/14612763.545792/14.892.106.752.103.752/figure-effect-enhanced-imaging-interface-different-constriction-velocity.webp)


