Publisher’s version / Version de l'éditeur:
Vous avez des questions? Nous pouvons vous aider. Pour communiquer directement avec un auteur, consultez la
première page de la revue dans laquelle son article a été publié afin de trouver ses coordonnées. Si vous n’arrivez pas à les repérer, communiquez avec nous à PublicationsArchive-ArchivesPublications@nrc-cnrc.gc.ca.
Questions? Contact the NRC Publications Archive team at
PublicationsArchive-ArchivesPublications@nrc-cnrc.gc.ca. If you wish to email the authors directly, please see the first page of the publication for their contact information.
https://publications-cnrc.canada.ca/fra/droits
L’accès à ce site Web et l’utilisation de son contenu sont assujettis aux conditions présentées dans le site LISEZ CES CONDITIONS ATTENTIVEMENT AVANT D’UTILISER CE SITE WEB.
Combustion Institute Canadian Section 2004 [Proceedings], 2004
READ THESE TERMS AND CONDITIONS CAREFULLY BEFORE USING THIS WEBSITE. https://nrc-publications.canada.ca/eng/copyright
NRC Publications Archive Record / Notice des Archives des publications du CNRC :
https://nrc-publications.canada.ca/eng/view/object/?id=9a31ec26-d5d6-4031-a995-e3e0a9d13a5c https://publications-cnrc.canada.ca/fra/voir/objet/?id=9a31ec26-d5d6-4031-a995-e3e0a9d13a5c
Archives des publications du CNRC
This publication could be one of several versions: author’s original, accepted manuscript or the publisher’s version. / La version de cette publication peut être l’une des suivantes : la version prépublication de l’auteur, la version acceptée du manuscrit ou la version de l’éditeur.
Access and use of this website and the material on it are subject to the Terms and Conditions set forth at
Measurement and modeling of soot formation in binary fuel mixtures
MEASUREMENT AND MODELING OF SOOT FORMATION IN
BINARY FUEL MIXTURES
S. Trottier1, H. Guo2, G.J. Smallwood2, and M.R. Johnson1
1 Dept. of Mechanical Engineering, University of Ottawa
2 Combustion Group, Institute for Chemical Process & Environmental Tech., NRC
INTRODUCTION
Airborne particulates resulting from combustion processes have recently been found to increase the risk of mortality through lung and heart diseases. In a large study of 90 cities in North-America, Dominici et al. [1] have reported that an increase 10µg/m3 of airborne particulate matter corresponded to a 0.27% increase in human mortality. Particulates have also been identified as having a noticeable impact on the climate change phenomena. It is therefore crucial to gain better understanding of the complex phenomena leading to their formation and by the same, gain insight on how to reduce these emissions. Soot formation in elemental fuel combustion has been studied extensively; however, fuel mixtures have been the subject of a limited number of studies.
The need to further explore this area is highlighted by considering that most fuels commonly used are mixtures. It has been demonstrated that by mixing fuels, the soot production is not cumulative but subject to chemical interactions. This project focuses on further exploring this phenomenon and its causes by experimentally and numerically analysing simple fuel mixtures. The reactions involved in polycylic aromatic hydrocarbon (PAH) and soot formation and growth are very complex and not fully understood to this day. It has been established that the main agent involved through hydrogen-abstraction-carbon-addition (HACA) reactions is acetylene (e.g. Xu and Faeth. [2]). However, recent observations of sooting behaviours of fuel mixtures have indicated that the process could involve many other reactions and radicals. Initial studies of binary fuel mixtures by Frenklach et al. [3] have found that, for all mixtures studied, a synergistic behaviour in soot formation existed. According to their observations, this behaviour could be explained solely by the aromatic-acetylene reactions and the non-linearity of the fuel mixing. However, Hwang et al [4] have since noted that the HACA reactions alone were insufficient to explain the synergistic effect observed in ethylene/propane and ethylene/ethane flames. Using numerical modelling, they demonstrated that the soot formation in these mixtures was also significantly affected by odd-carbon-numbered species, namely propagyl (C3H3).
Similar effects were observed by Roesler et al. [5] in ethylene/methane and methane/alkane mixtures. They have found that methane has a synergistic effect in these mixtures due to the recombination of methyl radicals. This was indicated by the analysis of the gas phase species sampled in the flame.
This paper presents results from ongoing work to further understand this effect by examining the relative importance of acetylene and odd-carbon-numbered species in the formation of soot in
other simple fuel mixtures, namely methane/propane. To provide further insight in the chemical pathways to soot formation, experimental results will be replicated numerically to assess individual species concentrations to better understand their role in soot formation and growth.
EXPERIMENTAL SET-UP
Experiments were designed to quantify the soot volume fraction resulting from the combustion of binary fuel mixtures of methane and propane. Fuel mixtures were combusted in a laminar co-flow type burner consisting of a 10.9 mm diameter brass fuel tube centered within an 89 mm diameter annular air flow. The flow rate of the co-flowing air was fixed at 284 LPM using a mass flow controller and the flow was passed through glass beads and sintered metal foam to ensure a uniform velocity profile in the annulus.
Experiments were designed to vary the fuel mixture from 0-100% methane in propane while maintaining constant carbon content in the fuel of 3.025 mg/sec. The mass flow rates of fuel were varied between 3.70 mg/sec of propane and 4.04 mg/sec of methane with corresponding volumetric flow rates as summarised in Table 1. The Reynolds number of the fuel flow varied between 439 for pure CH4 to 545 for pure C3H8 and the length of the fuel tube was sufficient for
the velocity profile to be fully developed and laminar. These flow rates correspond to experimental conditions previously used by Gülder [6]. The two fuel lines were connected together with sufficient length prior to the burner to ensure proper mixing of the two fuels.
β (Fraction of Carbon
from Propane) 1 0.9 0.8 0.7 0.6 0.5 0.4 0.3 0.2 0.1 0
Propane (cc/min at STP) 120 108 96 84 72 60 48 36 24 12 0 Methane (cc/min at STP) 0 37 73 110 146 183 219 256 292 329 365
Table 1: Fuel Volumetric Flow rates
Soot volume fraction was measured using 2-D line-of-sight optical attenuation diagnostics using an optical layout as described by Snelling et al. [7]. An Oriel thermal Hg arc lamp was used as the light source. The lenses were chosen as to have 1 to 1 imaging, meaning that to capture the full flame, four sets of pictures were taken at 18mm intervals through the height of the flame. The detector is a CCD array of 1152 x 1242 pixels where each pixel represents 22.6µm x 22.6 µm area of the flame. As such, the soot volume fraction could be determined efficiently and with a high degree of spatial resolution. The signal was filtered using a filter of 20nm bandwidth centred at 577nm. Four images were taken at every vertical position. Two were taken while the flame was not in the optical path. The first one, measured with the lamp blocked, yielded the surrounding contributions to intensity while the second measured the total intensity with the lamp. The difference between these two yielded I, or the unattenuated intensity.
The same technique was repeated with the flame present in the optical path, the difference between the surrounding intensities, including the flame, and the lamp intensity attenuated by the flame yielded I0. The resulting transmittances were then normalised with the data in the noise
free regions. In processing the data, intensities from vertical columns of pixels over a height of 500µm were smoothed using the Mathcad Loess algorithm to suppress noise. Soot volume
fraction, fv(r), was calculated in radially across the flame at 2mm vertical increments using the following equation: = ) ( 6 ln ) ( m LE dr d r fv π λ τ (1)
where L is the path length and E(m), the function of the refraction index, equals 0.258 as calculated by Snelling et al. [7] and adapted from Hall and Bonczyk [8]. The derivative of the natural logarithm of the transmittance is obtained from the three point Abel inversion algorithm. Due to the noticeable difference in sooting behaviour over the range of mixtures, the distribution of soot volume fraction was integrated radially to yield the mass of soot/height distribution using the following equation:
∫
= rf r dr
height
mass/ s ρs 2π v( ) (2)
where the density of soot was taken to be ρs=1.8g/cm3 as measured by Choi et al. [9] By
integrating over the height of the flame, the total soot mass can then be calculated. This yields a more consistent basis for comparison between different mixtures than the soot volume fraction because a pure methane flame was seen as having wider peaks of intensity attenuation by soot.
RESULTS AND DISCUSSION
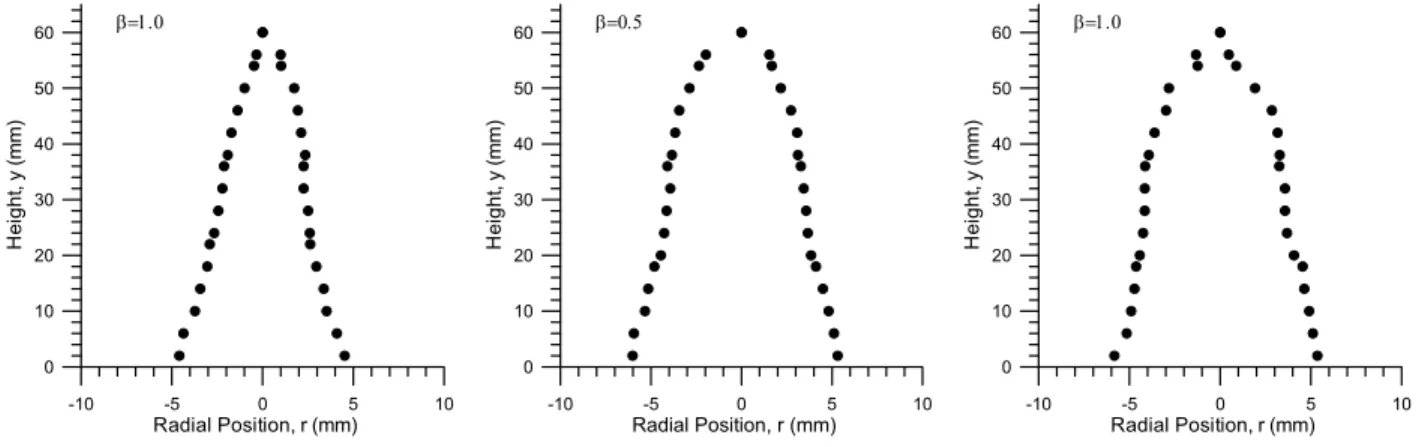
The preliminary experimental data was gathered as to provide an initial overview of the sooting behaviour of the different mixtures. A qualitative assessment of the flame indicated that as the methane flow rate was increased, the flame tip became rounder although the variation in flame height was negligible as shown in Figure 1.
-10 -5 0 5 1 Radial Position, r (mm) 0 0 10 20 30 40 50 60 H e ig h t, y (m m ) β=1.0 -10 -5 0 5 10 Radial Position, r (mm) 0 10 20 30 40 50 60 H e ig h t, y (m m ) β=0.5 -10 -5 0 5 10 Radial Position, r (mm) 0 10 20 30 40 50 60 H e ig h t, y (m m ) β=1.0
Figure 1: Flame shapes of different mixtures
In one given flame, plotting the radial distribution of the soot volume fraction indicated that the soot volume fraction peaked at the sides of the flame at lower heights whereas, higher in the flame, the maximum soot volume fraction was at the center of the flame.
Low er Soot Pe ak (He ight=32m m ) 0 0.5 1 1.5 2 2.5 3 3.5 4 -10 -5 0 5 10 Radial Position [m m ] So o t Vo lu m e F ra ct io n [ P P M ]
Higher Soot Peak (Height=52mm)
0 0.5 1 1.5 2 2.5 3 3.5 4 -10 -5 0 5 10
Radial Pos ition [m m ]
P eak S o o t V o lu m e F ract io n [ P P M ]
Figure 2 Soot Peaks for 100% Propane Flow
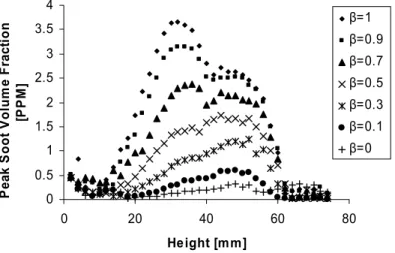
In the pure propane flame the overall maximum soot volume fraction was found in an annular region approximately 32 mm above the burner tip. As the proportion of methane in the flame was increased, the location of overall maximum soot volume fraction shifted to higher in the flame as illustrated in Figure 3. Interpretation of these results in terms of total soot volume fraction in the flame requires consideration of the relative flame areas associated with annular versus central peak profiles. A peak in the annular region would represent a greater total volume of soot than a peak of similar magnitude in the center region of the flame. This effect can be clarified by integrating the soot volume fraction radially throughout the flame at various positions along the flow direction as shown in Figure 4.
0 0.5 1 1.5 2 2.5 3 3.5 4 0 20 40 60 80 Height [mm] P ea k S oot V o lum e F ra ct ion [P P M ] β=1 β=0.9 β=0.7 β=0.5 β=0.3 β=0.1 β=0
-5 0 5 1 0 1 5 2 0 2 5 3 0 0 5 0 1 0 0 H e ig h t [m m ] S oot M as s per He ight [ng/ mm]
Figure 4: Annular Integral of Soot Volume Fraction vs. Height
By taking the results from Figure 4 and integrating over the height of the flame, it was then possible to obtain the total soot mass in the flame which offers a better basis for comparison of sooting tendency in the various fuel mixtures. The trends of the peak soot volume fraction and the soot mass in the flames were compared over the mixture ranges and were both found to follow linear trends as shown in Figure 5.
0 0 .5 1 1 .5 2 2 .5 3 3 .5 4 4 .5 0 0 .2 0 .4 0 .6 0 .8 1 β Soot V o lu me Fract io n [ P P M ] D a ta S e t 1 D a ta S e t 2 0 500 1000 1500 2000 2500 0 0.2 0.4 0.6 0.8 1 β T ot al S oot in F la m e [ ng ]
Figure 5 Sooting Tendency of different Propane/Methane mixtures
The repeatability of the testing method was verified by taking a second set of measurements over the range of mixtures. The results obtained indicated that the test has very good repeatability. These results are further confirmed by the fact that the soot volume fraction obtained for a pure methane flame is very comparable to that obtained by Gülder [6] under similar experimental conditions.
Although previous studies have suggested that a synergistic effect in soot formation and growth in alkane/methane fuel mixtures, the linear trend does not yield any evidence of this effect. However, further experiments and analysis will be required before any final conclusion as to the presence or absence of a synergistic effect in methane/propane flames can be established. Detailed numerical modelling will be an essential tool in this work providing insight necessary to evaluate the pathways to soot formation in methane/propane mixtures by indicating clearly if the diminution in C2H2 concentration expected from increasing methane concentration could account
for the diminution in soot volume fraction or if other radicals also play a part in this trend.
NUMERICAL MODELLING
The model is currently in development. It will be based on the numerical model designed by Hongsheng et al. [10] which assumes that the pathway to soot formation and growth involves acetylene only. The work at this time is mainly focused on identifying the numerous reactions that will be added to account for the mixture itself, the new species involved and the more complex reactions that will be observed.
CONCLUSION
A 2D line of sight attenuation optical diagnostic method was used to measure the sooting behaviour of methane/propane mixtures. To offer a better comparison basis, the carbon content of the mixture was kept constant and the fuel flow rates were varied accordingly. The results were found to be repeatable and in agreement with previous results.
The data show a linear trend in soot volume fraction with methane content in the fuel mixture and surprisingly does not indicate the presence of any synergistic effect. However, in order to gain a clearer picture of the pathways to soot formation in this mixture, further experiments and numerical analysis will be required.
REFERENCES
[1] F. Dominici, A. McDermott, S. L. Zeger, J. M. Samet, A report to the Health Effects Institute on
Reanalysis of the NMMAPS Database. The Health Effects Institute, Cambridge, MA, 2002.
[2] F. Xu, G. M. Faeth, Combust. Flame 125 (2001) 804-819.
[3] M. Frenklach, T. Yuan, M. K. Ramachandra, Energy and Fuels (1988) 462-480. [4] J. Y. Hwang, W. Lee, H. Kang, S. H. Chung, Combust. Flame 114 (1998) 370-380.
[5] J.F. Roesler, S. Martinot, C. S. McEnally, L. D. Pfefferle, et al., Combust. Flame 134 (2003) 249-260. [6] Ö. Gülder, Combust. Flame 101 (1995) 302-310.
[7] D. R. Snelling, K. A. Thomson, G. J. Smallwood, Ö. Gülder, Applied Optics 38 (1999) 2478-2485. [8] R. J. Hall, P. A. Bonczyk, Applied Optics 29 (1990) 4590-4598.
[9] M. Y. Choi, G. W. Mulholland, A. Hamins, T. Kashiwagi, Combust. Flame 102 (1995) 161-169.
[10] G. Hongsheng, L. Fengshan, G. J. Smallwood, Ö. Gülder, Combust. Theory and Modelling 6 (2002) 173-187.