HAL Id: hal-03124818
https://hal.archives-ouvertes.fr/hal-03124818
Submitted on 29 Jan 2021
HAL is a multi-disciplinary open access
archive for the deposit and dissemination of
sci-entific research documents, whether they are
pub-lished or not. The documents may come from
teaching and research institutions in France or
abroad, or from public or private research centers.
L’archive ouverte pluridisciplinaire HAL, est
destinée au dépôt et à la diffusion de documents
scientifiques de niveau recherche, publiés ou non,
émanant des établissements d’enseignement et de
recherche français ou étrangers, des laboratoires
publics ou privés.
A Doppler lidar for measuring winds in the middle
atmosphere
Marie-Lise Chanin, Anne Garnier, Alain Hauchecorne, Jacques Porteneuve
To cite this version:
Marie-Lise Chanin, Anne Garnier, Alain Hauchecorne, Jacques Porteneuve. A Doppler lidar for
measuring winds in the middle atmosphere. Geophysical Research Letters, American Geophysical
Union, 1989, 16 (11), pp.1273-1276. �10.1029/GL016i011p01273�. �hal-03124818�
A DOPPLER LIDAR FOR MEASURING WINDS IN THE MIDDLE ATMOSPHERE
M.L. Chanin, A. Garnier, A. Hauchecorne, J. Porteneuve
Service d'A6ronomie du Centre National de la Recherche Scientifique, Verri•res le Buisson, France
Abstract. The possibility to measure winds in the middle atmosphere with a Doppler lidar has just been demonstrated. It is aimed to study the wave-mean flow interaction, when used in association with the Rayleigh lidar providing density and temperature profiles and their fluctuations. The new Doppler lidar relies on the Rayleigh scattering from air molecules and is designed to cover the height range 25-60 km, a region where radars cannot operate. The Doppler shift of the backscattered echo is measured by inter-comparing the signal detected through each of two high-resolution, narrow band- pass, Fabry-Perot interferometers tuned on either side of the emitted laser line.
Introduction
In spite of the numerous experimental developments aimed towards a better description of the middle atmosphere both from the ground and satellites, the wind field in the altitude range 25-60 km is still poorly monitored. An evaluation of the zonal mean wind can only be given in this height range from the pressure field observed from satellite, assuming geostrophic balance. However this is not valid at low latitudes and above 1 hPa and cannot describe the mean meridional circulation. Whereas numerous techniques exist
below 25 km (S.T. radars, radio-sondes, anemometers...)
and above 60 km (VHF and meteor radars, interferometry and spectrometry of natural emissions...), the height range 25-60 km is only covered sporadically by rocket soundings, mainly by tracking a falling target. This technique has been the main source of data on which is built the climatology of the middle atmosphere wind field (Schmidlin, 1986). However the number of rocket ranges in operation has diminished critically during the last few years (due to their high maintenance cost as well as the cost of any individual sounding) without any alternate policy either by ground based or satellite measurements. It is hoped that a global coverage of stratospheric winds as well as other parameters will be obtained from the Upper Atmosphere Research Satellite (UARS) to be launched at the erld of 1990, but no continuity is insured until the polar platform era.
Therefore the interpretation of most middle atmospheric dynamical and chemical data relies on the climatological description of the wind field. As an example the waves generated in the troposphere by weather systems or orography, which are known to strongly affect the mesosphere circulation, are filtered by the zonal stratospheric winds and their-level of dissipation and/or breaking in the
mesosphere depends strongly on the wind direction and intensity. Numerous theories exist to describe the interaction
between the waves and the general circulation, but a full understanding of the process and meaningful test of the
theories require simultaneous observations of the wind field
fluctuations.
Furthermore, rocket sounding wind measurements using very light inflatable spheres have shown the importance of
Copyright 1989 by the American Geophysical Union.
Paper number 89GL03189. 0094-8276/89/89GL-03189503.00
very high vertical resolution (-- 1 km) to detect the sharp wind
shears often encountered at around 50 km and which play an important role in reflecting or filtering the waves. Such height resolution will be inaccessible to satellite instruments: the expected resolution of the instruments on board UARS is 3 km. The lidar technique would be a good candidate to reach such a high vertical resolution.
Until now, the lidar Doppler technique has only been used in the troposphere. The coherent lidar operates in the infra-red at 10.6 gm using CO2 lasers and relies upon the Mie scattered echo from droplets and particles mostly present in the lower
atmosphere (Huffaker, 1974, Eloranta et al., 1975). The
spectroscopic measurement of the Doppler shift of a narrow visible laser by backscattered aerosols was proposed long ago (Benedetti-Michelangeli et al., 1972) and has led to measurements in the low troposphere (Congeduti et al., 1981) but still remains to be demonstrated in the stratosphere. Both of these techniques will not be of any use in the height range
25-60 km, where most of the time the aerosol contribution is
negligeable.
In this height range, Rayleigh lidars have been widely used to monitor the density and the temperature of the middle atmosphere, wherever the contribution from aerosols could be neglected (i.e. from 25 km upwards except after intense volcanic eruptions). The intensive use of this technique has been carried up to an operational level by Chanin and
Hauchecorne (1984) and has led to a number of results on
planetary waves (Hauchecorne and Chanin, 1983), gravity
waves (Chanin and Hauchecorne, 1981; Wilson et al., 1989)
as well on the long term variability of the atmosphere (Chanin
et al., 1987).
The Rayleigh lidar survey, as performed at the Observatory of Haute Provence (OHP) in France for almost
one decade, has demonstrated the interest of continuous
monitoring of the variability of the middle atmosphere with high spatial and temporal resolution, though continuity is limited to clear meteorological conditions. This interest led to the development of a Doppler lidar to monitor the wind in the middle atmosphere in clear meteorological conditions, simultaneously with density and temperature and with comparable high resolution in space and time. Due to the choice of the height range to be monitored, the echo had to rely on Rayleigh scattering, but the method developed for this specific range can also lead to applications below 25 km, even though this aspect will not be treated in detail hereafter.
Principle
Since the wind vector in the atmosphere has a vertical
component generally negligible compared to the horizontal one
(one or two orders of magnitude smaller) and therefore inaccessible to our measurements, we will limit our study only
to the determination of the mean horizontal component. The
wind velocity is measured through the Doppler shift of the
Rayleigh backscattered laser beam resulting from the relative
motion between the lidar and the scattering particles. We then measure the radial wind velocity (vr), i.e. the projection of the horizontal velocity (vh) on the line of sight at an optimal angle of 0=48 degrees from the vertical. Two such measurements in two - for example orthogonal - azimuths are necessary to determine completely the horizontal mean velocity component. 1273
1274 Chanin et al.: Middle Atmosphere Winds With a Doppler Lidar
In a first step, we have measured the mean East-West component, predominant at the Observatory of Haute
Provence (44 ø N, 6 ø E) where the instrument has been set up.
This instrument is made up basically from the same
elements as the Rayleigh lidar. It is however designed
specifically
for the high resolutidn
spectral
filtering
of the
signal backscattered from layers above 25 km where the echois only due to the Rayleigh scattering. Although our
instrument is presently providing wind measurements below 25 km, the design of a slightly different version of the instrument, specifically for the altitudes at which the Mie scattering contributes to the signal, is envisaged.
Description of the method
When the atmosphere is excited by a narrow spectral width laser at 532 nm, the Rayleigh backscattered photons are spectrally spread by the thermally distributed molecules and displaced if the medium has a mean velocity. Therefore, the backscattered laser beam is Doppler broadened (by about 2.5 pm) and shifted by a value depending upon the wind velocity
(about
0.3 pm for vh=120
ms-l).
The Doppler shift is measured by the change in transmission of the signal through two filters A and B having a sharp slope and centered on either sides of the emitted line. We used for this purpose a doubled monolithic Fabry-Perot interferometer assembled by molecular contact. Placed in a thermally controlled enclosure, it presents two instrumental
functions slightly separated by a selected and fixed value Aks.
Each peak of these instrumental functions can be seen, if used with an extremely narrow field of view, as a filter with a slope depending upon the finesse and upon the thickness of the thin air plate. The interferometers have been adjusted so that both
peaks •,A and )•B of the instrumental functions, of identical full width at half height (FWHH) A•,I/2, are respectively on each side of the center •, of the backscattered line. Therefore, a
shift of the central backscattered wavelength leads to a variation of the number NA of photons transmitted through the filter A and an opposite variation of the number NB of photons transmitted through the filter B.
The FWHH of each filter (A•,l/2) and the spectral spacing
(A•,s) are chosen to minimize the statistical standard error on the wind velocity. The statistical standard error was calculated for different atmospheric conditions. Fig 1 show the results in
arbitrary units for a temperature of 260 K versus A•,1/2 and A•, s. To optimize for middle atmosphere conditions (200-
280K), we selected the following spectral characteristics:
3.1.
•'3'0
k
• ABOVE
17.93
11;
'"'":•':•
17.86-
17.93
2.9 ... . .•i 17.79 - 17.86 •ii:iii!i:i•i 17.72 - 17.70 :':..-i'• 17.05- 17.72 ma8 [..'-F• 17.58- 17.65i
•-:•
•17.51
17.37- 17.58
17.44 _ L__JI BELOW 17.37 HAI_Y WlDTH(D m)Fig. 1. Evolution of the statistical standard error on the wind
velocity versus A3•1/2 and Ages (in arbitrary units).
A•,i/2 = (1.2+0.05)pm
and A•,s = (2.8+0.08)pm.
In order to implement this method of measurement, we need to use a pulsed and sufficiently powerful laser, emitting a spectral line with a well known and stable shape, and with a
stable central wavelength
(8•,/k0 about 10-8). These last
conditions lead to the choice of a longitudinal and transverse monomode laser. We selected a pulsed, doubled Nd:YAG laser, made monomodal by the injection of a cw and stable master frequency in the slave cavity (repetition rate=30 HZ and energy=200mJ per pulse at k0=532 nm). Under these conditions, we can assume that the spectral line of this laser can be represented by a Gaussian distribution with a FWHH
of AXE smaller than 0.2 pm.
The number
N^,B (z,0) of photons
backscattered
for one
laser pulse from a layer of vertical thickness dz, centered at the height z, then transmitted through the filters A or B, andfinally
detected
by two cooled
photomultipliers,
A and
B, can
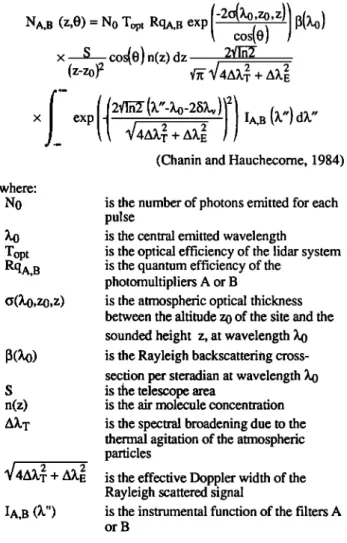
be written as a function of the height, z, and the angle, 0, between the line of sight and the zenith as:-2olX0,z0,z))
(x0)
N^,B
(z,0)=
No
Topt
Rq^,B
exp cos(O)
x S cos(O}n(z)dz 2¾i-62-
(z-z0)
2
• •4AX}
+ AX•
x exp[•
44A}
+
'
(Chanin and Rauchccomc, 1984)
where: NO )•0 Topt
RqA,B
o(t.o,zo,z) s n(z) A•, T•4AXI
2 +
IA,B (•,")is the number of photons emitted for each pulse
is the central emitted wavelength
is the optical efficiency of the lidar system is the quantum efficiency of the
photomultipliers A or B
is the atmospheric optical thickness
between the altitude z0 of the site and the sounded height z, at wavelength X0
is the Rayleigh backscattering cross-
section per steradian at wavelength X0
is the telescope area
is the air molecule concentration is the spectral broadening due to the thermal agitation of the atmospheric particles
is the effective Doppler width of the Rayleigh scattered signal
is the instrumental function of the filters A
or B
In this last expression, the term 28•,v is the spectral shift
observed at the ground when the projection vr(z) of the wind velocity on the line of sight at the height z and at the angle 0
from the zenith, is:
vr(z)
= •00
x 8X
v
'• 40
• 35
15
-o.t5 -0.05 0.05 o.,5 0.25 oa5 o.4s o5s
RESPONSE
Fig. 2. Response profiles obtained at the Observatory of
Haute-Provence (44øN,6øE) during the night of ]anuary 24-25
for each line of sight: (1) 0=-48 ø, (2) t3=0 ø, (3) t3=48 ø.
The wind velocity vh(z) at the height z, in the plane defined by
the two directions passing by the center of the telescope, one vertical, and the other one in the line of sight, depends upon
vr(z) as:
vr(z)
c•Z v
vh(z)- sin0 - Z sin0
0We measure
the response
R (z,O)=R(z,•SZv)
given
by:
R(z, 13)=NA( z, O)- NB'(
z, O)
NA( z, O) + NB'(
z, O)
with NB'(z, O) = NB( z, O)
where C is a corrective factor determined experimentally, by
taking into account the different efficiencies of the detectors.
Knowing the spectral characteristics of the interferometer, the response depends upon the FWHH of the backscattered line
for each height z- inferred from the temperature profile
simultaneously obtained with the Rayleigh lidar- and upon
the position of the center Z of the backscattered line compared to the one of the transmission peaks ),.A and kB.
The wind velocity vh(z) is deduced from the variation of
the response by passing from the tilted line of sight (0--48 ø) to
the vertical one (O=0 ø) corresponding to a null Doppler shift and used therefore as a reference. It may be written:
c x(R(z,
aX )-R(z, 0))
x
vh(z)=
2k sin0
0v
S(z)
where S(z) is the sensitivity of the system, given by:
S(z)
=
i)z•(NA(z,
NA( z, 0) + NB'(z, 0)0)
- NB'(z,
0)
)
assuming that it can be considered to be constant over the
whole variation range of R.
Experiment
The instrument is made up of 3 receiver telescopes of 445
mm diameter, the first one pointing vertically, the two other
ones pointing in two directions tilted at 48 degrees on either sides of the vertical and in the same plane, providing the measurement of Doppler shifts of opposite signs for the two different angles.
The measurement sequence includes a series of one hour integration measurements successively in one or the other of the three lines of sight. It is then possible to follow an eventual spectral drift of the device, which can be deduced from the variation of the response, R, observed from the
vertical pointing, corrected for the temperature fluctuations.
The error on the wind measurement is mainly given by the statistical standard error, therefore height dependent, and the uncertainty about the instrumental sensitivity.
Figure 2 presents the response profiles obtained from 15 to 50 km during the night of January 24 - 25 1989, for each
line of sight: (1) 0=-48 ø, (2) 0=0 ø, (3) 0=48 ø. The profile (2),
corresponding to the vertical direction, shows a slight variation in the response versus height, due to the sharp vertical temperature gradients observed at the same time at the Centre d'Essais des Landes (44øN,løW) where planetary waves have an effect similar to OHP. We observe very clearly a strong vertical variation of the responses (1) and (3), but in opposite directions, expressing the spectral shift of the backscattered laser beam, positive for the profile (3), and negative for the profile (1).
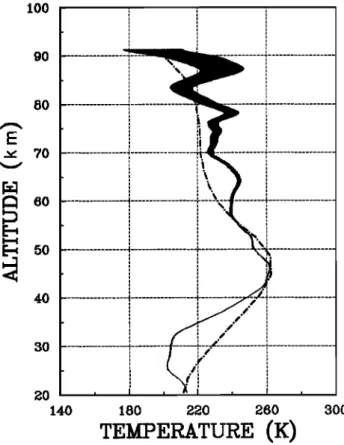
After correcting for the vertical temperature fluctuations and for spectral drift, the wind profile can be obtained from the responses obtained in the opposite directions (1) and (3). Data have only been used above 25 km where the echo is only due to the Rayleigh scattering, even though they could be used downwards after correcting for the Mie scattering contribution. The wind profile is presented in figure 4 for 2
100 90 õ0 i::::1 6o E-i 50 40 30 , I 140 180 220 260 300
TEMPERATURE
(K)
Fig. 3. Temperature
profile
obtained
with + 1 (5 standard
error
during
the night of January
24-25 at the Centre
d'Essais
des
Landes (44øN,løW). In dashed lines, the CIRA 88 Model for January.
1276
Chanin et al.: Middle Atmosphere
Winds
With a Doppler Lidar
45 • 35 3o 0 20 40 60 80 100 120 140 160 180 200 WIND ( m s- 1 )Fig. 4. Wind profile deduced from figure 2. In clear the statistical standard error in ms -1 with + 1(5, the outside dark envelope includes the calibration uncertainty.
hours integration time and a vertical resolution of 2 kilometers. The + 1 (5 error bar includes the statistical standard error and the calibration uncertainty. On the same figure have been plotted the values of the thermal wind deduced from the SSU radiances measured at 12:00 a.m. on January 24 and 25. The agreement of these data with the lidar profile is quite satisfactory and within the uncertainty expected from the difference in time and the different spatial resolution of the measurements. One notices the very large amplitude of the
westerly
zonal
component
reaching
160 ms
-1 around
50 km,
considerably above the average winter values. The position of the exceptionally deep vortex, shown by the SSU map at 1 hpa (see figure 5), probably explains the causes of this unusually strong wind at the site of OHP.For this first experiment, only one horizontal wind component could be measured, as another set of telescopes in the orthogonal N.S. direction was not yet available. Both components will however be obtained in the near future.
25 JAN 89
1 MB GEOPoTENTIAL (DAM:)
Fig. 5. SSU map at 1 hpa obtained on 25th of January 1989.
Conclusion
The possibility of performing direct measurement of the
mean horizontal wind component in the height range 25-50 km was demonstrated with a Doppler lidar using Rayleigh
scattering. The instrument has yet to be improved to lead to
the nominal performances (range of 60 km with an accuracy
of + 15 m/s for Az = 2 km and At = 2h ). But the laser and
interferometers stabilities are shown to be compatible with the
expected accuracy.
An operational system is now being set up at the lidar station of OHP together with other lidars providing density,
temperature, ozone and aerosols, all of them with comparable time and height resolution. This new Doppler lidar will be a
worthwhile addition to the existing systems, as it will provide
knowledge of the background wind through which the waves
propagate, and which carries the air masses and the tracers measured simultaneously. It will also be very useful to validate the wind measurements which will be provided by
UARS on a global scale.
Acknowledgements
This work was supported by the Departement des Recherches
et Etudes Techniques under the grants 87/825 and 87/1217,
and by the Centre National de la Recherche Scientifique under
the grant MOY 05 0A.
References
Benedetti-Michelangeli G., F. Congeduti and G. Fiocco,
Measurement of Aerosol Motion and Wind Velocity in the
Lower Atmosphere by Doppler Optical Radar, J. Atmos.
Sci., 29, 906-910, 1972.
Chanin M.L. and A. Hauchecorne, Lidar observation of gravity and tidal waves in the stratosphere and mesosphere,
J. Geophys. Res., 86, 9715-9721, 1981.
Chanin M.L. and A. Hauchecorne, Lidar studies of
temperature and density using Rayleigh scattering, MAP Handbook, 13, 87- 89, 1984.
Chanin M.L., N. Smires and A. Hauchecorne, Long-term variation of the temperature of the middle atmosphere at
mid-latitude: dynamical and radiative causes, J. Geophys.
Res., 92, 903-914, 1987.
Congeduti F., G. Fiocco, A. Adriani and C. Guarrella, Vertical wind velocity measurements by a Doppler lidar and comparisons with a Doppler sodar, Appl. Opt., 20, 2048-
2054, 1981.
Eloranta E.W., J.M. King and J.A. Weinman, The determination of wind speeds in the boundary layer by monostatic Lidar, J. Appl. Meteor., 14, 1485-1489, 1975.
Hauchecorne A. and M.L. Chanin, Mid-latitude Lidar
observations of planetary waves in the middle atmosphere during the winter of 1981-1982, J. Geophys. Res., 88,
3843-3849, 1983.
Huffaker R.M., CO2 laser Doppler systems for the measurement of atmospheric winds and turbulence, Atmospheric Technology, 6, 71-76, NCAR (1974). Schmidlin F.J., Rocket techniques used to measure the neutral
atmosphere, MAP Handbook, 19, 1-28, 1986.
Wilson R., M.L. Chanin and A. Hauchecorne, Gravity waves in the middle atmosphere by Rayleigh Lidar, to be submitted to J. Geophys. Res., 1989.
(Received: July 5, 1989; revised: September 8, 1989;