HAL Id: hal-01153607
https://hal.archives-ouvertes.fr/hal-01153607
Submitted on 11 Mar 2021
HAL is a multi-disciplinary open access
archive for the deposit and dissemination of
sci-entific research documents, whether they are
pub-lished or not. The documents may come from
teaching and research institutions in France or
abroad, or from public or private research centers.
L’archive ouverte pluridisciplinaire HAL, est
destinée au dépôt et à la diffusion de documents
scientifiques de niveau recherche, publiés ou non,
émanant des établissements d’enseignement et de
recherche français ou étrangers, des laboratoires
publics ou privés.
Detection of trace-level uranium and samarium in glasses
by combined laser-induced breakdown spectroscopy and
plasma-induced fluorescence spectroscopy
Lei Liu, Shuo Li, Xi Huang, Yao Lu, Kevin Chen, Raphaël Pik, Lan Jiang,
Jean-François Silvain, Yong Feng Lu
To cite this version:
Lei Liu, Shuo Li, Xi Huang, Yao Lu, Kevin Chen, et al.. Detection of trace-level uranium and
samar-ium in glasses by combined laser-induced breakdown spectroscopy and plasma-induced fluorescence
spectroscopy. Journal of Analytical Atomic Spectrometry, Royal Society of Chemistry, 2015, 30 (5),
pp.1128-1132. �10.1039/c5ja00020c�. �hal-01153607�
ARTICLE
Detection of Trace-Level Uranium and Samarium in
Glasses by Combined Laser-induced Breakdown
Spectroscopy
and
Plasma-induced
Fluorescence
Spectroscopy
Lei Liu
a, Shuo Li
b, Xi Huang
a, Yao Lu
a, Kevin Chen
b, Raphaël Pik
c, Lan Jiang
d,
Jean Francois Silvain
e, and Yong Feng Lu
aDetection of uranium and samarium in zircon glasses by combined laser-induced breakdown spectroscopy (LIBS) and plasma-induced fluorescence spectroscopy (PIFS) was studied in this work. A standard LIBS system with a pulsed Nd:YAG laser operating at 1064 nm was used to induce plasmas. LIBS spectra were used to identify the major elements in the target. For trace-level uranium and samarium elements, their atomic or ionic signals could be submerged in the background signals or suffer from spectral interference. Fluorescence spectra induced by plasma emission from the solid targets were then used to indicate the existence of uranium and samarium. This combined analysis provides the advantages of using fluorescence emission from solids without the limitation of laser wavelengths in the UV-Vis range and the capability of detecting uranium and samarium in zircon glasses with high sensitivity. The achieved limits of detection for uranium and samarium elements in this study are 154 and 6 ppm, respectively.
1. Introduction
Laser-induced breakdown spectroscopy (LIBS) is an elemental analysis technique in which laser-induced plasma emissions are collected and analysed.1 LIBS has been proven to be a powerful technology for element analyses with the advantages of no sample preparation, multi-element detection, real-time or in situ analysis, nearly non-destructive, and ability to be used for gas, liquid, and solid detection. These advantages offer LIBS wide range of applications, such as gas or aerosol analysis, chemical imaging, biomedical and pharmaceutical analysis, cultural heritage, and military environmental contamination analysis.2, 3 However, there are still some challenges for detecting low-concentration rare-earth elements by LIBS due to their special chemical and physical characteristics. Many works on the detection of uranium in different matrix by LIBS has been reported.4-9 Some works on samarium detection by LIBS have also been reported.10, 11
In laser-generated plasmas, different types of emitting species dominate the emission in different time ranges. The strong continuum emission from Bremsstrahlung radiation dominates in the very early stage of plasma lifetime, around several to tens of nanoseconds. The ionic line emissions begin to dominate and then gradually decay within several microseconds. After that the neutral atomic line emissions dominate within the subsequent tens of microseconds.2 The atomic and ionic emission lines are usually used for elemental identifications. For trace-level uranium and samarium in glasses, their atomic and ionic signals are weak and could be easily submerged in background signals.
However, many rare-earth elements or uranium-doped hosts give characteristic optical emission lines with long lifetime and can be easily detected when irradiated by UV-Vis wavelength nanosecond lasers, which is due to the electronic transitions within the 4fN shell configuration. The position of the spectral lines vary only slightly within the environment since the f orbitals are strongly shielded from the outside ligands.12 Uranium-doped glasses usually give characteristic optical emission lines, broadening into a band at around 520 nm due to the existence of uranyl group [(UO2)2+)].13-17 This characteristic emission band was used to indicate the existence of uranium in our study. Samarium-doped glasses usually give bright orange emission due to Sm3+ via the transitions from excited energy level, 4G
5/2 to various ground levels, 6H5/2, 6H7/2, 6H9/2, 6H11/2 and 6H
13/2, with corresponding emission bands at around 561, 598, 642, 708 and 733 nm, respectively.18-23 Three characteristic bands at around 561, 598 and 642 nm were chosen to indicate the existence of samarium in this study.
The aim in this study was to detect trace-level uranium and samarium elements in zircon glasses using a simple LIBS system, by combining LIBS and plasma-induced fluorescence spectroscopy (PIFS) of the solid targets. LIBS spectra were used to identify the major elements. For trace-level rare-earth elements with weak atomic or ionic signals or suffering from elemental emission line interference, the characteristic fluorescence spectra from the substrates were used to detect those elements. Unlike time-resolved laser-induced fluorescence spectroscopy (TRLIFS) which uses a nanosecond laser with the wavelength in the UV-Vis range,13, 24, 25 plasmas generated in
ARTICLE Journal Name
LIBS are also able to induce fluorescence from the solid substrates. PIFS has the advantages of conducting sensitive fluorescence spectroscopy using any pulsed lasers, without the restriction of having laser wavelengths in the UV-Vis range.
2. Experiment
The schematic diagram of the LIBS/PIFS experiment setup is shown in Fig. 1. A Q-switched Nd:YAG laser operating at 1064 nm (Continuum, Powerlite Precision II 8010, pulse duration of 6 ns) with a pulse energy of 220 mJ and a repetition rate of 10 Hz was used to induce plasmas. The experiment was operated in the atmospheric environment. The laser beam was normally focused onto the target by lens 1 (L1 with 17-cm focal length) to a spot size diameter of 1 mm. The estimated fluence is about 28 J/cm2.The emissions from the laser-induced plasmas were coupled into an optical fiber by lens 2 (L2 with 10-cm focal length) and lens 3 (L3 with 6-cm focal length) with a detection angle of 45o with respect to the laser beam direction. The optical fiber with a core diameter of 100 µm was coupled into a spectrometer (Andor Tech., Shamrock 303i). The spectrometer has three gratings of 2400, 600 and 150 lines/mm. The 2400 and 150 lines/mm gratings were used for acquisition of atomic and fluorescence spectra, respectively. The spectrometer slit width is 10µm. A 512×512 pixel intensified charge coupled device (ICCD) detector (Andor Tech., iStar, DH-712) was attached to the exit focal plane of the spectrometer. The ICCD detector was operated in the gated mode so that the gate delay and width can be adjusted for different measurements. The spectrometer and laser were synchronized by a digital delay generator (Stanford Research System DG 535, 5 ps delay resolution).
Fig. 1. Schematic diagram of the LIBS/PIFS system Two kinds of glass samples were used in this study. One was vaseline glass with a uranium concentration around 1-2 %. The bulk composition of the vaseline glass is SiO2 with variable amounts of Al, Na, Mg, Fe and Ca. The other kind of samples were eight zircon glasses doped with different concentrations of uranium and samarium, with variable amounts of Li, B and Th. The bulk composition of the samples is ZrSiO4 formed in a size of about 2.5 cm in diameter and 5 mm in thickness. The uranium and samarium were doped in the glass center in an area of 1 cm in diameter and homogeneous in the doped areas. The concentrations and uncertainties of the uranium and samarium elements in eight samples were calibrated by inductively coupled plasma mass spectrometry (ICP-MS) and listed in Table 1.
Table 1. Concentrations of uranium and samarium elements in
zircon glasses (ppm) No. #1 #2 #3 #4 #5 #6 #7 #8 U 1 26 91 98 191 582 964 1761 ±0.2 ±5 ±9 ±2 ±8 ±80 ±81 ±80 Sm 0 28 88 94 181 553 930 1631 ±0.1 ±7 ±1 ±3 ±10 ±93 ±76 ±96
3. Results and discussion
3.1 LIBS spectra
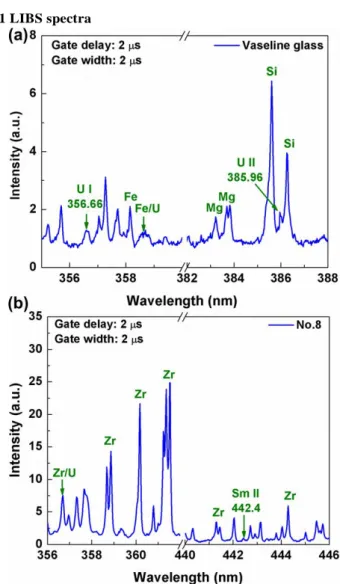
Fig. 2. LIBS spectra from (a) vaseline glass and (b) zircon glass No. 8 with a gate delay of 2 µs and gate width of 2 µs.
The LIBS spectra acquired with a gate delay of 2 µs and a gate width of 2 µs from vaseline glass and zircon glass sample No. 8 were shown in Figs. 2(a) and 2(b), respectively. In Fig. 2(a), the elements (such as Si, Fe, Mg, and U) in vaseline glass can be easily identified by the LIBS spectrum. Figure 2(b) shows that the LIBS spectrum of zircon glass sample No. 8, which was doped with uranium and samarium with concentrations of 1716 and 1631 ppm, respectively. Due to the low concentrations, the emission signals from uranium and samarium were weak. Only one weak emission line of Sm II 442.43 nm was identified and the uranium emission lines were interfered by dense emission
lines from a major element zirconium, such as U I 356.66 nm interfered by Zr I 356.61 nm. Thus it was difficult to identify the uranium and samarium elements in LIBS spectra from these samples using LIBS. However, after the strong plasma emissions have decayed, the weak characteristic fluorescence emissions from bulk samples could be observed using very large gate width. This fluorescence emissions were used to indicate the existence of uranium and samarium in the zircon glasses.
3.2 Fluorescence spectra
Fig. 3. PIFS spectra from (a) vaseline glass and (b) zircon glass No. 8 with a gate delay of 200 µs and gate width of 200 µs. Figures 3(a) and 3(b) show the PIFS spectra from the vaseline glass and zircon glass No. 8, respectively, in the range of 450-675 nm, taken with a gate delay of 200 µs and a gate width of 200 µs. The characteristic fluorescence band around 520 nm due to the existence of uranium was observed. A sensitive Na atomic line at 589.3 nm (Na I 589.0 nm and Na I 589.6 nm) was also observed for the vaseline glass due to the large gate width of 200 µs. The characteristic fluorescence bands with peaks at 564, 599 and 647 nm were also observed due to the existence of samarium. Normally for nanosecond lasers, this kind of characteristic fluorescence emissions can only be induced when laser wavelengths are in the range of UV-Vis. Since we used the laser wavelength of 1064 nm, the fluorescence emissions were induced by the laser-generated plasmas. Two more experiments were conducted to verify that the observed emissions are PIFS
instead of laser-induced fluorescence or molecular emissions from the plasmas.
3.3 Plasma-induced fluorescence
Fig. 4(a) Spectra from vaseline glass with the laser focused with plasma generation (blue solid line) and defocused without plasma generation (black solid line); Relationship between the fluorescence emission intensities and delay times (b) for uranium fluorescence at 520 nm from vaseline glass and (c) for samarium fluorescence at 599 nm from zircon glass No. 8. The inserted figures in both (b) and (c) represented the spectra acquired at the delay time of 2 ms.
ARTICLE Journal Name
In the first experiment, the Nd:YAG laser was operated at the wavelength of 1064 nm with the same pulse energy as above. However, the laser was both focused to a spot size diameter of 1 mm to induce plasmas and defocused to a spot size diameter of 4 mm to avoid plasma generation. Figure 4(a) shows the spectra from vaseline glass with (blue solid line) and without plasma generation (black solid line). The ICCD gate delay and width were set to be 200 and 100 µs, respectively. The detected Na signal was weaker with the smaller gate width 100 µs. No fluorescence emission was observed when the sample was irradiated by the defocused 1064 nm laser without plasma generation. However, fluorescence emission was observed when there was plasma generation due to laser ablation. The observed fluorescence emission was therefore due to the existence of the plasma, which we refer as plasma-induced fluorescence in this work. In addition, time-resolved spectra were taken to observe the band emission lifetime. Figures 4(b) and 4(c) show the relationship between the fluorescence emission intensities and delay times for uranium fluorescence at 520 nm from vaseline glass and samarium fluorescence at 599 nm from zircon glass No. 8, respectively. A fixed gate width of 200 µs was used and the spectra were accumulated by 30 pulses. The inserted figures in Figs. 4(b) and 4(c) represent the spectra at the delay time of 2 ms from vaseline glass and zircon glass No. 8, respectively. As observed, the emission lifetime is very long, more than 2 ms, which supported the previous claim that the emissions came from the plasma-induced bulk fluorescence instead of molecular emission from plasma reactions since molecular emission lifetimes are usually within hundreds of microseconds and shorter than the scale of milliseconds.2
Fig. 5. Spectrum from vaseline glass with the fiber detection angle 90o to the laser beam direction.
The second experiment was conducted using the same system but with the direction of the detection fiber perpendicular (90o) to the laser beam, instead of 45 degrees to the laser beam. Therefore, the fiber detection direction was parallel to the sample surface. The vaseline glass was wrapped by an opaque black tape to block the fluorescence emission from the bulk sample but with an unwrapped size of 6x6 mm2 at the laser spot position to allow laser ablation and plasma generation. The spectrum from a vaseline glass with the detection angle 90o to the laser beam is shown in Fig. 5. A gate delay of 200 µs and a gate width of 200µs were used. Figure 5 shows that no uranium fluorescence band could be observed when the observation angle was set at 90o at which the collected signals were mainly from the plasma
emissions. In contrast, we observed obvious uranium fluorescence band at 520 nm previously when the observation angle was around 45o. Hence we can conclude that the previously observed uranium fluorescence emissions mainly come from the solid bulk fluorescence instead of molecular emissions from the plasmas.
3.4 Limits of detection
The relationship between the PIFS intensities and elemental concentrations in the eight zircon glasses has been established. The limits of detection (LODs) of uranium and samarium in the zircon glasses have also been calculated using the following equation (1).26, 27
LOD =3σB
S (1)
where σB is the standard deviation of the background; S is the slope of the calibration curve for specific emission line. Figures 6(a) and 6(b) show the calibration curves of peak intensities and concentrations for the uranium (520 nm) and samarium (599 nm) fluorescence emission, respectively. The both coefficients of determination (R2 factors) are 0.9478 and 0.9969, respectively. The acquired spectra were accumulated by 100 pulses. A gate delay of 400 µs and a gate width of 200 µs were used to avoid possible emission signals from the plasmas. The calculated LODs for uranium and samarium in the zircon glasses were evaluated to be 154 and 6 ppm, respectively.
Fig. 6 Calibration curves of peak intensities and concentrations for (a) uranium fluorescence emission at 520 nm and (b) samarium fluorescence emission at 599 nm from zircon glasses.
4. Conclusions
In conclusion, the combined LIBS and PIFS were used for detection of trace-level uranium and samarium elements in zircon glasses. LIBS was used to identify the major elements existed. For trace-level uranium and samarium elements in glasses, it is difficult to be identified by LIBS due to the easily swamped atomic or ionic signals by background or other spectral interferences. PIFS was used as an effective way to indicate the existence of uranium and samarium. This approach provides the capability of detecting the trace-level uranium and samarium in zircon glasses by a simple LIBS system. In addition, it provides the advantages of using the characteristic fluorescence emission from uranium- and samarium-doped glasses without the requirements of using laser wavelengths in the UV-Vis range to induce fluorescence as long as plasmas are generated. The limits of detection for uranium and samarium in zircon glasses reached 154 and 6 ppm, respectively.
Acknowledgements
This work was supported by the Defence Threat Reduction Agency (through HDTRA1-12-1-0019 and HDTRA1-13-1-0019).
Notes and references
a Department of Electrical Engineering, University of Nebraska-Lincoln,
Lincoln, NE 68588-0511 USA
b Department of Electrical and Computer Engineering, University of
Pittsburgh, Pittsburgh, PA 15260 USA.
c CRPG-CNRS, BP20, 54501 Vandoeuvre-Lès-Nancy Cedex, France d School of Mechanical Engineering, Beijing Institute of Technology,
100081, PR China
e Institut de Chimie de la Matière Condensée de Bordeaux –
ICMCB-CNRS 87, Avenue du Docteur Albert Schweitzer F-33608 Pessac Cedex – France
1. R. Noll, Laser-induced breakdown spectroscopy, Springer, 2012. 2. A. W. Miziolek, V. Palleschi and I. Schechter, Laser-induced
breakdown spectroscopy (LIBS), Cambridge University Press
Cambridge, 2006.
3. J. P. Singh and S. N. Thakur, Laser-induced breakdown spectroscopy, Elsevier, 2007.
4. E. J. Judge, J. E. Barefield, J. M. Berg, S. M. Clegg, G. J. Havrilla, V. M. Montoya, L. A. Le and L. N. Lopez, Spectrochim Acta B, 2013,
83-84, 28-36.
5. E. C. Jung, D. H. Lee, J. I. Yun, J. G. Kim, J. W. Yeon and K. Song,
Spectrochim Acta B, 2011, 66, 761-764.
6. Y. S. Kim, B. Y. Han, H. S. Shin, H. D. Kim, E. C. Jung, J. H. Jung and S. H. Na, Spectrochim Acta B, 2012, 74-75, 190-193.
7. P. Ko, K. C. Hartig, J. P. McNutt, R. B. D. Schur, T. W. Jacomb-Hood and I. Jovanovic, Rev Sci Instrum, 2013, 84.
8. X. K. Shen and Y. F. Lu, Appl Optics, 2008, 47, 1810-1815. 9. J. R. Wachter and D. A. Cremers, Appl Spectrosc, 1987, 41,
1042-1048.
10. D. Alamelu, A. Sarkar and S. K. Aggarwal, Talanta, 2008, 77, 256-261.
11. S. H. Kim, J. S. Ju, H. S. Shin, H. D. Kim and K. J. Yee, Spectroscopy, 2010, 25, 38-44.
12. M. Gaft, G. Panczer, R. Reisfeld and E. Uspensky, Phys Chem Min, 2001, 28, 347-363.
13. N. Baumann, V. Brendler, T. Arnold, G. Geipel and G. Bernhard, J
Colloid Interf Sci, 2005, 290, 318-324.
14. J. Halverson, Y. Pan and R. Chang, Aerosol Science and Technology,
Report Number (s): WSRC-MS-2002-00948, 2003.
15. R. K. Mishra, V. Sudarsan, S. Jain, C. P. Kaushik, R. K. Vatsa and A. K. Tyagi, J Am Ceram Soc, 2014, 97, 427-431.
16. C. Moulin, P. Decambox and L. Trecani, Anal Chim Acta, 1996, 321, 121-126.
17. G. J. Wang, Y. Su and D. L. Monts, J Phys Chem A, 2008, 112, 10502-10508.
18. M. Elisa, B. A. Sava, I. C. Vasiliu, R. C. C. Monteiro, J. P. Veiga, L. Ghervase, I. Feraru and R. Iordanescu, J Non-Cryst Solids, 2013, 369, 55-60.
19. P. Kaur, S. Kaur, G. P. Singh and D. P. Singh, Solid State Commun, 2013, 171, 22-25.
20. S. Babu, A. Balakrishna, D. Rajesh and Y. C. Ratnakaram,
Spectrochim Acta A, 2014, 122, 639-648.
21. S. Arunkumar and K. Marimuthu, Journal of Alloys and Compounds, 2013, 565, 104-114.
22. C. R. Kesavulu and C. K. Jayasankar, Journal of Luminescence, 2012,
132, 2802-2809.
23. R. Reisfeld, G. Panczer, A. Patra and M. Gaft, Mater Lett, 1999, 38, 413-417.
24. G. Geipel, A. Brachmann, V. Brendler, G. Bernhard and H. Nitsche,
Radiochimica Acta, 1996, 75, 199-204.
25. G. Plancque, V. Moulin, P. Toulhoat and C. Moulin, Anal Chim Acta, 2003, 478, 11-22.
26. X. K. Shen, H. Wang, Z. Q. Xie, Y. Gao, H. Ling and Y. F. Lu, Appl
Optics, 2009, 48, 2551-2558.
27. J. D. Ingle and S. R. Crouch, Spectrochemical analysis, Prentice-Hall, Englewood Cliffs, 1988.