COMPARISON OF THE HUYGENS MISSION AND THE SM2 TEST FLIGHT FOR
HUYGENS ATTITUDE RECONSTRUCTION
(*
)A. Sarlette(1), M. Pérez-Ayúcar, O. Witasse, J.-P. Lebreton
Planetary Missions Division, Research and Scientific Support Department, ESTEC-ESA, Noordwijk, The Netherlands. Email: mperez@rssd.esa.int, owitasse@rssd.esa.int, Jean-Pierre.Lebreton@rssd.esa.int
ABSTRACT
The Huygens probe is the ESA’s main contribution to the Cassini/Huygens mission, carried out jointly by NASA, ESA and ASI. It was designed to descend into the atmosphere of Titan on January 14, 2005, providing surface images and scientific data to study the ground and the atmosphere of Saturn’s largest moon.
In the framework of the reconstruction of the probe’s motions during the descent based on the engineering data, additional information was needed to investigate the attitude and an anomaly in the spin direction. Two years before the launch of the Cassini/Huygens spacecraft, in May 1995, a test probe called SM2 (Special Model 2) was dropped in the Earth’s atmosphere from the balloon launch site of Kiruna, Sweden, to verify proper operation during the descent and especially the parachute deployment sequence. It featured a flight standard structure and DCSS (Descent Control SubSystem) and, unlike the Huygens probe, was fully instrumented to monitor the orientation of the descent module (3-axes accelerometers and gyroscopes).
We describe how a comparison between the SM2 test flight and the Huygens mission provides some useful information about the Huygens probe’s behavior. After discussing the spin direction, we focus on the tip and tilt.
The final conclusions of this comparison at the time of writing are still of qualitative nature, but the results are a starting point for better interpretation of the engineering data in terms of attitude to derive the probe’s orientation.
(*) This poster won the 1st prize of the IPPW #3 student poster competition.
1. The SM2 probe characteristics
In agreement with its main purpose – performing a full system check of the Huygens descent sequence – the SM2 probe was a full scale model of the Huygens probe, having the same inner and outer structure (except that the deploying booms of the HASI instrument were not mounted on SM2), the same mass and a similar balance. A complete description of the Huygens flight model system can be found in [1].
All Descent Control SubSystem items (parachute system, mechanisms, pyro and command devices) were provided according to expected flight standard; as the test flight was successful, only few differences actually exist at this level with respect to the Huygens probe. The most significant ones, at least for our purpose, concern the parachutes and the spin vanes.
As the test flight showed ([2]) that the probe-parachute system oscillated more than expected, exceeding mission specification limits under stabilizer chute, the gap of this Disk Gap Band parachute was doubled for the Huygens mission.
The little winglets called “spin vanes” mounted on the front dome of the descent module were designed to make the probe turn in a controlled way around its vertical axis in order to provide a panoramic view of the surroundings to the instruments; a swivel was incorporated in the raiser of the parachutes to decouple the probe’s spin movement from the parachute’s motions. During the test flight, a reduced spin rate with respect to expectations was observed. The inclination of these winglets with respect to vertical was therefore increased from 2.2° to 3°, without modifying their design.
The instruments and telecommunication system of the Huygens probe were replaced by a specific data recovery module (triple redundancy through one downlink antenna to the ground, one uplink antenna to the still flying balloon with gondola and one solid state (1) Stagiaire from February 1 to April 29; student at Liège University, Belgium.
recorder on the probe) and attitude monitoring instruments exclusively. Those included video recordings during the (main and stabilizer) parachute deployments and during the front shield separation phase, 3-axes accelerometer measurements and 3-axes gyroscope measurements, temperature and pressure sounding and GPS tracking; the Huygens probe in contrast featured only two engineering accelerometers – a set of two Radial Acceleration Sensor Units (RASU), used to compute an approximate spin rate to be provided to the instruments during the descent and a set of three Central Acceleration Sensor Units (CASU), used for entry deceleration monitoring.
The time resolution achieved on SM2 (thanks to the shorter flight and the much easier data recovery) is quite impressive, even reaching the domain of vibration modes with the 200 Hz accelerometer sampling rate. The measurements of Huygens’ engineering sensors are available at maximally 4 Hz.
Some sensors from scientific instruments on Huygens also help reconstructing the probe’s attitude; they include all DISR capabilities (sun sensor, spectrometer and the camera images), a 2-axes tilt sensor on SSP and an accurate accelerometer set (vertical servo-accelerometer and 3-axes piezo-servo-accelerometer) on HASI. However, all those data are constrained to the same low sampling rates as the engineering sensors during the descent (we will see that those frequencies are indeed not too high with respect to the motions of the probe). Those data from scientific instruments were not considered for the present study.
INSTRUMENTS FOR ATTITUDE &
AZIMUTH RECONSTRUCTION
Measurement
Resolution Resolution Time Huygens Flight Data
CASU (vertical acc.) ± 0.2 m/s2 1 Hz
RASU (radial acc.) ± 0.0024 m/s2 4 Hz
On HASI, SSP, DISR Ref :[3], [4], [5]
SM2 Drop Test Data
X-accelerometer (vertical) ± 0.2 m/s2 200 Hz
Y- & Z-acc. (horizontal) ± 0.15 m/s2 200 Hz
X-gyroscope (spin) ± 0.1 °/s 40 Hz
Y- & Z-gyro (horizontal)
[High / Low range] ± 2.4 / ± 0.24 °/s 40 Hz
Video Recordings Up & Down (separation phases)
TABLE 1: Summary of the main sensors used for attitude reconstruction in Huygens mission and SM2 drop test. 2. The SM2 flight sequence
As the two planetary bodies – the Earth for the SM2 test flight and Titan for the Huygens mission – are different, possible test conditions had to be studied for their relevance; another difference was imposed by the much lower 34 km altitude reached by the balloon above Kiruna, compared to the 155 km at which the Huygens descent sequence started at Titan. The
following table lists some properties of both celestial bodies. The scale height of Titan’s atmosphere is so large that significant temperature variations occur over a single scale height step; as a consequence, its definition – based on one average temperature – has very local validity.
PLANET
PROPERTIES (Huygens) TITAN EARTH (SM2)
Gravity 1.354 m/s2 9.81 m/s2
Atmosphere
Temperatures 70 – 200 K ~ 270 K Surface pressure 1.5 bar 1 bar
Typical vsound 200 m/s 330 m/s
Typical scale height 20 km 8 – 9 km TABLE 2: Comparison of planet properties for Earth and
Titan.
The most important parameters to match for a representative Descent Control SubSystem test were the Mach number and the dynamic pressure; their values were considered for two critical phases, namely at the initiation of the descent sequence and at the release of the front shield.
For the Huygens mission, the initiation of the descent sequence was expected to take place at about Mach 1.4 and a dynamic pressure of about 300 Pa, while the front shield was released after probe stabilisation in the early subsonic regime at Mach 0.4 and a very low dynamic pressure of about 35 Pa.
Since both parameters depend on the velocity of the probe and external properties imposed by the environment, it was not possible to match those four values for the SM2 test flight. In particular,
1. supersonic velocities could not be reached above
Earth without unreasonable launch complications 2. given the stronger gravity of the Earth, the very
low dynamic pressure at front shield release was not achievable using flight standard mass and parachutes.
The accepted trade-off consisted in matching the two other values, i.e. the dynamic pressure at descent initiation and the Mach number at front shield release, while allowing significant differences in Mach number at descent initiation and in dynamic pressure at front shield release (see Table 3).
To minimize damage on the probe during the landing – considering the facts that Earth’s gravity is 7 times higher than Titan’s, and that the atmospheric density close to the surface is about 4-5 times lower – a third, large parachute called the “recovery parachute” was added at the end of the SM2 descent sequence. It would have allowed distinguishing damages caused during the flight. It was deployed in two steps at an
altitude of about 4 km and featured no swivel on the raiser.
The following table summarizes the characteristics of the different phases during the Huygens and SM2 descents. Both descent phases were much shorter for the SM2 test flight than during the actual mission, specially under the stabilizer chute. The typical Reynolds numbers (Re = length x velocity / kinematic viscosity coefficient) indicate a highly turbulent regime for both flights.
FLIGHT
PROPERTIES Huygens Mission Flight
SM2 Drop Test
duration 15 mn 6 mn
Main chute phase
altitudes 155 – 111 km 34 – 14.6 km
duration 2 h 13 mn 3 mn 30 s
Stab. chute phase
altitudes 111 – 0 km 14.6 – 4.8 km
Typical Re ~ 107 ~ 106
Descent initiation 316 Pa 300 Pa
Qdyn
Front shield release 34 Pa 90 Pa
Descent initiation 1.465 0.9
Mach
Front shield release 0.4 0.4
TABLE 3: Huygens mission and SM2 descent sequence descent phases, and associated aerodynamic parameters. 3. The spin rate and spin direction
As indicated by several observations (DISR panoramic view reconstructions, apparent spin rate annihilation according to RASU) and confirmed using the AGC signal in [6], the Huygens probe went through a spin inversion during its descent.
The probe was ejected from the Cassini orbiter with a ~7.5 rpm spin rate (figure 2) in CounterClockWise direction as seen in the speed direction, which was kept during the whole entry phase (i.e. until descent initiation at ~ 09h10 SCET UTC). The probe was expected to slow down due to atmospheric friction. The spin vanes were mounted on the fore dome to maintain the spin motion once the front shield was released. However the probe spin rate decreased much quicker than expected and finally reversed. A discontinuity in the slope can be seen when the stabilizer chute replaces the main chute and the descent velocity increases; during the rest of the descent, the spin profile is not too far from the expected behaviour, except its direction which was now ClockWise.
A question which naturally came up right after the discovery of the spin inversion was what could have caused this anomaly. Various effects were proposed, among which a modified flow regime under flight conditions, aerodynamic effects of other probe appendixes (HASI booms, SEPS,...), swivel failure, and even the fact that the spin vanes might have been mounted in the wrong direction; whatever effect may actually turn out to be the right one, checking what happened to SM2 was the first thing to be investigated.
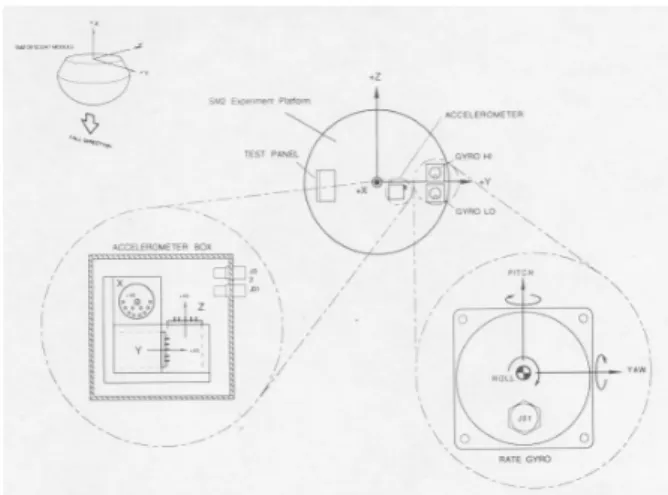
During the SM2 test flight, the spin rate was directly monitored by the X-axis gyroscope. As can be seen on figure 1, the definition of the axes system was such that positive values correspond to a ClockWise spin as seen from above.
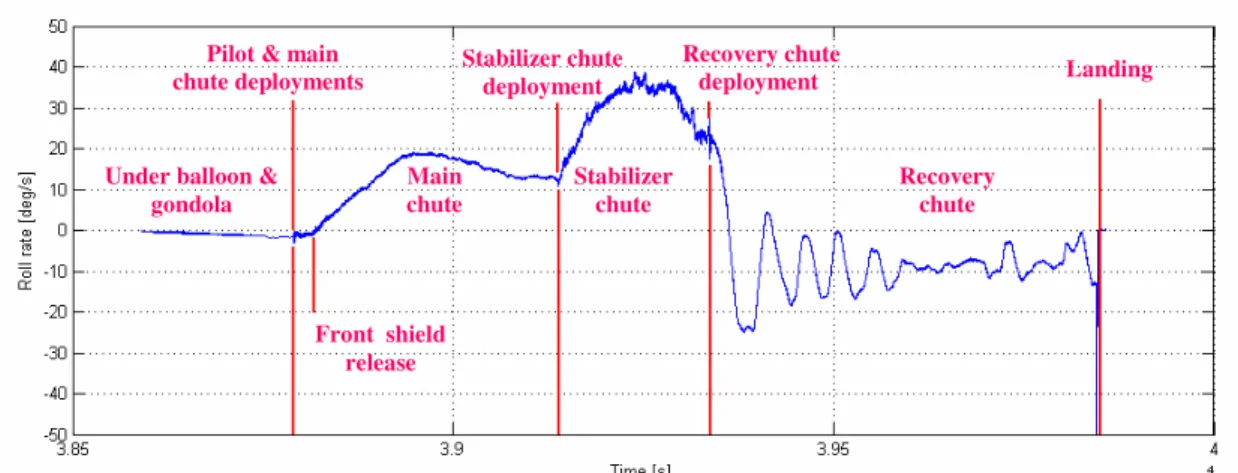
The SM2 X-gyroscope measurement is represented as a function of time on figure 3. It shows that the probe started with a zero spin rate – it was simply released from the gondola without any initial spin. As soon as the front shield was removed, the probe started spinning.
A discontinuity can again be seen when passing to stabilizer chute, but the direction of the spin movement was always the same under main and stabilizer chutes; this is consistent with the fact that, being released without any initial spin, the probe readily started spinning in its preferred direction, whichever it may be. However, this direction was of major importance to investigate the spin direction anomaly of the Huygens probe; according to the gyroscope, it should be ClockWise as seen from above, which would be opposite to predictions. This fact was never noticed before.
Just note that the spin oscillations under the recovery chute are due to the fact that no swivel was mounted on its raiser; as a consequence, the rope acted as a torsional spring attached to the inertial parachute. By carefully looking at the spin profile, one can see that the average spin under recovery chute is not zero but a slightly negative value of about 1.4 rpm. This could correspond to a spin motion of the parachute in CounterClockWise direction as seen from above, probably associated to a synchronized gliding. This shows the behaviour of the probe in case of a swivel failure, which was one of the investigation issues to explain the Huygens spin direction anomaly; this explanation thus turns out to be inconsistent.
FIGURE 1: Gyros position and axes definition in the SM2 body frame (from [5]).
Stabilizer chute Main chute Front shield release Pilot & main
chute deployments Stabilizer chute deployment Recovery chute deployment Landing
Under balloon &
gondola Main chute Stabilizer chute Recovery chute
FIGURE 2: Huygens in-flight spin profile derived from engineering sensors (in [2]).
FIGURE 3: SM2 drop test spin rate derived from X-axis gyroscope.
FIGURE 7: SM2 drop test Z-axis accelerometer spectrogram. FIGURE 6: Huygens inflight RASU (Radial Accelerometer) spectrogram.
Main chute Stabilizer chute
Main chute Stab.chute Recovery chute
Looking for further evidence to confirm the spin direction of SM2 – which up to now relied on a single figure in the documentation – we turned to the video sequences ([7]). Indeed, though the probe was still not spinning during the two first recorded events (main chute deployment and front shield release), the spin movement was well established at the release of the main chute and deployment of the stabilizer chute, which was the third recorded sequence (just about 5 seconds long; see figure 4).
An up-looking camera was used to monitor the events, so it was somewhat subtle to find adequate reference points in order to study the probe motions. A tiny white dot in the sky, which might have been the jettisoned pilot chute, was argued to hypothetically be fixed enough, until we realised that a clearly visible ray of the sun provided an excellent reference direction. Since additionally, the movements of those two objects agreed, we could conclude that the reference frame was moving ClockWise with respect to the probe (up-looking), meaning that actually the probe was moving CounterClockWise up-looking, which corresponds to ClockWise as seen from above.
This confirmed the result from the gyroscopes: the spin direction anomaly was already present during the SM2 test flight. Unfortunately, no mention of the spin direction is made in the SM2 flight data analysis so that this effect was missed. However, an unexplained “reduced efficiency of the spin vanes under flight conditions” was observed and
documented; this lead to an increase of the spin vanes inclination from 2.2° on SM2 to 3° on the Huygens flight model.
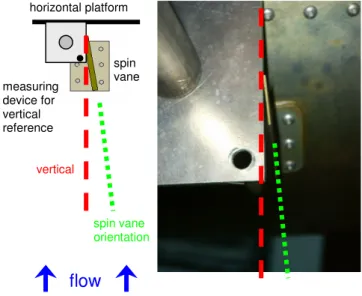
Searching for the reason of this anomaly, we checked the orientation of the spin vanes on the SM2 probe, stored in Katwijk near the ESA/ESTEC site. As depicted in figure 5, the spin vane orientation was found to be as designed. The anomaly thus remains unexplained up to now.
4. Observations in the frequency domain
To investigate the attitude of the Huygens probe in the absence of specific sensors, we compared the spectra of horizontal accelerometers on both Huygens (RASU) and SM2 (Z-axis). Indeed, the vertical accelerometers were designed for capturing large probe motion events, such as parachute deployments etc., so their resolution is not optimised for the more subtle attitude changes. In addition, the recovered Huygens CASU accelerometer data provides less information because it has a very low sampling rate of 1 Hz; this specially causes problems in the frequency domain, where aliasing effects appear because the input filter was designed for a 4 Hz sampling rate. The spectrograms throughout the respective descents are illustrated in figure 6 and figure 7.
• On the Huygens RASU spectrum, the main chute
phase is the initial short (900sec), calm phase on the left. The stabilizer chute phase, on the contrary, shows larger perturbations (extended dark noise area), progressively damped until the probe lands.
• On the SM2 spectrum, the probe is still attached to
the gondola at the beginning, during the ascent. The FIGURE 4: Some shots of the SM2 uplooking camera video
sequence during the main – stabilizer chute exchange [3].
The analysis of this sequence allows to inferring that the SM2 probe was moving clockwise as seen from above.
FIGURE 5: SM2 spin vane qualitative inclination check. It was found that the vanes were mounted as expected.
horizontal platform
.
vertical flow spin vane orientation spin vane measuring device for vertical referencefirst vertical dotted line marks the jettison and the beginning of a calm main chute phase. The stabilizer chute phase is characterized by a noisier (more perturbed) descent, as in the Huygens mission. The last part, until the landing at the extreme right of the diagram, is under recovery chute. Note that some very clear and narrow frequency lines are present on the SM2 spectrum, unperturbedly extending throughout the whole descent. They are even present during ascent, so these cannot reflect probe motions. It is not known whether they are due to electromagnetic disturbances like in data acquisition electronics, or to physical vibration due to nearby instruments, but in any case they will not be considered.
When comparing the two spectra, a first qualitative similarity can be observed: calm descent under main chute, disturbed descent under stabilizer. The instability under stabilizer was already noticed during the SM2 test flight data analysis: to counteract this effect, the flight model parachute was increased from single to double gap, although after some further investigation, it was attributed to specific wind gusts in the lower atmosphere on the day of the test, which should not be present on Titan.
However, this conclusion has to be revised as a “rough ride” was also obtained during the Huygens mission; in fact, the oscillations were damped at the end of the stabilizer chute phase for Huygens, but this might simply be due to the much longer duration of this flight phase for the actual mission.
The duration of the flight phases may also explain why the separation of the broad frequency line into two narrower ones is only observed under stabilizer chute during the Huygens mission. This might indicate a decoupling of two movement components, as pendulum and coning by example, as time goes on.
The “decreasing frequency” line, starting around 1 Hz and ending about 0.6 Hz at the landing, was also observed on the AGC signal (see [8]); its nature still has to be defined.
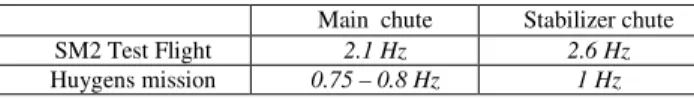
Finally, the most interesting, more quantitative conclusions come from the horizontal (constant frequency) lines during both main chute and stabilizer chute phases. The following table lists the values of the observed fundamental frequencies.
Main chute Stabilizer chute
SM2 Test Flight 2.1 Hz 2.6 Hz
Huygens mission 0.75 – 0.8 Hz 1 Hz
TABLE 4: Fundamental frequencies observed on the accelerometers during the Huygens mission and the SM2
drop test.
The frequency modes observed during the SM2 test flight are also present on the gyro measurements,
where they are confirmed to characterize actual attitude motions of the probe (in fact, a rapid double-pendulum - like movement where the top of the parachute and the probe’s centre of mass remain fixed in the descending reference frame). Now, when taking the ratios fSM2/fHuygens for the main chute and stabilizer chute
phases, we obtain 2.77 and 2.6 respectively. These values are not only very close, they are also very similar to the square root of the ratio of the respective gravitational accelerations,
The significance of this comparison may be best understood by remembering the formula for the frequency of a small amplitude simple pendulum motion,
where l is the length of the pendulum. In fact, the frequency of almost any complex periodic movement triggered by the gravity is proportional in a first approximation to the square root of g.
Following the same formula, the (square root of the) ratio of the parachutes sizes was compared to the ratio of observed frequencies; although the observed frequencies were higher under the smaller stabilizer chute, the exact relation
was not met.
As a conclusion, it is very likely that a dominant movement governed the behaviour of the probe under both parachutes and for both flights. The exact role of the parachutes will have to be considered when a dynamic model of the probe’s behaviour is established, in order to explain the different frequencies observed under the different parachutes.
5. Trying to constrain the Huygens attitude modes The Huygens engineering sensors were not designed for providing an exact orientation of the probe, but to command its descent. To further investigate the attitude using these data, some hypotheses had to be made about the probe motions.
An attempt to simulate the effect of different probe motions on the RASU and CASU measurements of the Huygens probe under mission flight conditions has been performed. Two types of movements were considered: a pendulum-like and a coning-like motion of the probe. The frequencies of the movements were taken from the RASU spectrum as previously discussed (0.77 Hz under main chute, 1 Hz under stabilizer). The
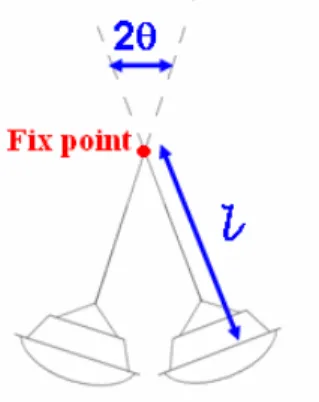
angular amplitude θθθθ was varied, as well as the height of the rotation centre above the accelerometer platform – denoted (see figure 8 for a precise definition of those elements).
A direct comparison of the simulated accelerometer patterns and the in-flight measurements was not possible due to the very low sampling rate of the CASU and RASU data. Instead, the minimum and maximum values of each simulated accelerometer – RASU and CASU – were compared to the mission measurements for various values of the two parameters
θθθθ and .
The results for both pendulum and coning simulations were similar, showing that the conclusions do not depend too much on the particular movement which is considered. However, no exact agreement – same maximum and minimum values on both accelerometers for a specific amplitude and fix point height – was obtained by this simplified model.
Nevertheless, the simulations tend to converge to
• a fix point position of ~ 10 cm above the
accelerometers (inside the probe)
• tilt angles θθθθ around
0° to 4° under main chute
4° to 9° at the beginning of the stabilizer
chute phase
1° to 5° at the end of the stabilizer chute
phase.
6. Conclusion
This paper presents a comparison between the Huygens mission and the SM2 test flight. The results have notably contributed to the understanding and the reconstruction of the orientation of the Huygens probe during its descent by:
providing a detailed spin analysis of SM2 which
should help to study the Huygens spin direction anomaly;
observing similarities in the frequency domain and
identifying a relation between the frequency ratios and dynamical parameters;
constraining the possible amplitudes and fix point
position for the Huygens probe oscillations.
This should help to draw a dynamical background explaining the probe’s behaviour.
The present work is one of the first studies of the attitude reconstruction using the brand new Huygens mission data; the results are mainly of qualitative nature. The unexpectedly strong similarities observed between the SM2 and Huygens flight behaviours – despite the limited similarity of the flight conditions – indicate that the SM2 data set should be used in an extensive way to investigate the behaviour of the probe during the Huygens mission.
7. Acknowledgements
The first author wants to thank all the sponsors who supported the IPPW #3 in Anavyssos and more specially ARA (EADS) who provided his travel funding, as well as the whole IPPW #3 Organizing Committee and his co-authors and supervisors at ESA/ESTEC who gave him the opportunity to attend this workshop.
8. References
[1] K. C. Clausen et al., The Huygens probe system design, Space Science Reviews, 104:155–189, 2002. [2] Fokker Space, Huygens SM2 flight data report, HUY.FOKK.532.RE.0029, 1995.
[3] M. Fulchignoni et al., The Characterization of Titan's Atmospheric Physical Properties by the Huygens Atmospheric Structure Instrument (HASI), Space Science Reviews, 104:397-434, 2002.
[4] Zarnecki et al., Huygens' Surface Science Package, Space Science Reviews, 104:593-611, 2002.
[5] Tomasko et al., The Descent Imager/Spectral Radiometer (DISR) Experiment on the Huygens Entry Probe of Titan, Space Science Reviews, 104:469-551, 2002
[6] M. Pérez-Ayúcar et al., Huygens attitude reconstruction based on engineering parameters, IPPW#3, 2005.
[7] Aerospatiale, Huygens SM2 flight video, 1995. [8] A. Sarlette et al., Characterization of the spin and attitude of the ESA Huygens probe during its descent onto Titan using the engineering dataset, ESA report, 2005.