Application of 3D Printing in Medical Devices New Product Development
byMichael David Sandford
B.S., Mechanical Engineering, Lehigh University, 2010 M. Engineering, Energy Systems, Lehigh University, 2011
Submitted to the MIT Sloan School of Management and the Department of Mechanical Engineering in Partial Fulfillment of the Requirements for the Degrees of
Master of Business Administration and Master of Science in Mechanical Engineering
in conjunction with the Leaders for Global Operations Program at the Massachusetts Institute of Technology
June 2017
C 2017 Michael Sandford. All rights reserved.
The author hereby grants to MIT permission to reproduce and to distribute publicly paper and electronic copies of this thesis document in whole or in part in any me~kig now kn.ior hereft created.
ignature
of the AuthorSignature
redacted
MIT Sloan School of Managemen epart ofMechanic ngineering ay12, 2017
'ertifedb
Signature
redacted
Ctiied by
Steve sis Supervisor rLecturer, cho of Management
ertified
by
Signature redacted
Accepted by
Accepted by
MASSACHUSETTS INSTITUTE OF TECHNOLOGY
JUN 20 2017
\fffrian Antho *, Thesis Supervisor
Principal Research Scientist, MIT Departmelt of Mechanical Engineering
Signature redacted_
Maur4 Herson, Director of MIT Sl nirBA Program MIT Sloan School of Management
Signature redacted
Rohan Abeyaratne, Chairman, Coih4ittee on Graduate Students Department of Mechanical Engineering (0
LL
(
C S
MITLibraries
77 Massachusetts Avenue
Cambridge, MA 02139 http://Iibraries.mit.edu/ask
DISCLAIMER NOTICE
Due to the condition of the original material, there are unavoidable
flaws in this reproduction. We have made every effort possible to
provide you with the best copy available.
Thank you.
The images contained in this document are of the
best quality available.
Application of 3D Printing in Medical Devices New Product Development by
Michael David Sandford
Submitted to the MIT Sloan School of Management and the Department of Mechanical Engineering on May 12, 2017
in Partial Fulfillment of the Requirements for the Degrees of Master of Business Administration
and
Master of Science in Mechanical Engineering
Abstract
For Johnson & Johnson (J&J), a healthcare industry leader, speed to market is a valuable component of any New Product Development (NPD). This is especially so in its Medical Devices (MD) franchise-increased saleable lifetime, first mover advantage, customer loyalty, and company reputation for innovation are just some of the reasons that accelerating the pace of development is a priority at J&J. Despite the incentives to speed up the development process, a typical MD product introduction takes three years from initial prototyping to full launch. Over this period, the product is repeatedly refined, prototyped, and tested for reliability and safety prior to production at high volume to meet expected demand. Throughout this process, J&J has historically favored proven manufacturing techniques such as machining and injection molding, which are well understood by the company's designers and manufacturing engineers but lead to long development cycles and high costs when used iteratively, as in
NPD. Because new products can improve patient care-which is at the core of J&J's Credo-the
company is currently investigating methods to accelerate the NPD process. One way to accelerate development that is being explored is enabled by the burgeoning field of additive manufacturing, or 3D Printing. Traditionally used only for early prototyping and development, innovation in 3D Printing over the past decade and recent FDA guidance on the subject opens the opportunity for its use in late-stage development, tooling, and even end production healthcare products. The scope of this effort was to investigate how MD can use 3D Printing to shorten NPD time from early prototyping through launch, with a target of two months acceleration.
Through literature review, expert interviews, and close work with three project teams at J&J over the six-month duration of this effort, a portfolio of technical and organizational improvements were identified to improve New Product Development speed in Medical Devices. The use of 3D Printing was found to have a positive impact on all phases of development, ranging from initial design through high-volume manufacturing, with a cumulative effect of over 8 weeks of project-dependent improvement. An organizational structure was proposed to speed adoption of any new technology by using a twofold approach, which focuses on improving both organizational knowledge and internal processes to optimize
company value. Additional proposals for using 3D Printing to reduce time to market include: using Direct Metal Laser Sintering (DMLS) for improved injection molding tooling; increasing developer access to local 3D Printing technologies; establishing decision rules to determine appropriate investment in new technology; using polymer 3D Printed injection molds for improved prototyping; increasing minor design iterations to minimize major reliability tests; improving availability of cutting-edge high-volume additive manufacturing technologies; and developing Design for Additive Manufacturing (DFAM) guidelines to decrease the learning curve for engineers. In compilation, these proposals show significant potential to increase the rate of organizational learning around 3D Printing and accelerate the pace of NPD in MD. 3D Printing therefore has the ability to benefit not only J&J's financial position, but also the patients it serves through new products and improved clinical outcomes.
Thesis Supervisor: Steven Spear
Title: Senior Lecturer, MIT School of Management Thesis Supervisor: Brian Anthony
Title: Principal Research Scientist, MIT Department of Mechanical Engineering
Acknowledgements
This work would not have been possible without the help and support of many individuals along the way. First and foremost, I would like to thank my lovely fiancee, Samantha, for your love and support over the past two years. You have made my time in the Leaders for Global Operations (LGO) program possible with never-ending encouragement, boundless optimism, and daily selflessness. I especially thank you for your support over our time apart during the bulk this project-I would not have been able to do it without
you.
Next, I'd like to thank my family: Steve, Scott, Mom, Dad, Grandma, and Grandpa (and Donnie). You've been so supportive throughout my life, and have inspired me to take chances and do great things. I feel so blessed to have such an amazing family to come home to.
I'd also like to thank my MIT advisors, Dr. Brian Anthony and Dr. Steven Spear, for their insights, encouragement, and recommendations throughout this project. I appreciate the opportunity to work under both of you, and this project would not have been a success without your help.
Further, I'd like to thank Caleb Dailey, for his invaluable help over the six months I spent at J&J. You provided me direction, treated me as a peer, and offered me time out of your busy schedule from the first day I arrived, and for this, I am grateful. I will miss our thought-provoking daily conversations about not just 3D Printing, but also life in general. Through my time working for you, I learned so much about how to manage a team effectively while navigating a complex business environment. My time at J&J would not have been as educational, fun, and impactful without your guidance.
Next, I'd like to thank Sudhir Patel and Peter Ostiguy for their technical guidance and expert insights. I enjoyed the chance to work together, and I really appreciate the work you both put in to help me find direction. I would not have been as effective without your support, and this project certainly would not have been the same without you.
Lastly, I'd like to thank the countless engineers, project managers, and scientists at J&J who have contributed to this work. Specifically, I'd like to thank Mark Cosimi, Manny Gillio, and Sam Onukuri who helped find excellent projects where I could test my hypotheses. Furthermore, Scott Nield, Dan Luna, and Simon Cohn were great resources who not only connected me with their project teams, but also offered me the opportunity to work among them. I'd also like to thank the Launch Management team, including Anthony Sostre and Rashmeet Sangari, for being so supportive and helping me get my feet on the ground.
Finally, I'd like to thank Filip de Keersmaecher for sponsoring this project-the LGO program would not exist without support like yours. I truly enjoyed working as part of the VCM team.
Table of Contents
1
INTRODUCTION ... 151.1 PURPOSE OF PROJECT... 15
1.2 PROBLEM STATEMENT ... 15
1.3 PROJECT GOALS ... 16
1.4 PROJECT HISTORY AND APPROACH ... 16
1.4.1 Understand organization and technology... 18
1.4.2 Work within projects to prove value... 19
1.4.3 Design structure for implementation strategy ... 19
1.4.4 Test and refine implementation strategy through simulation...19
1.4.5 Transition process to sustaining organization... 19
1.5 THESIS OVERVIEW... 20
2 BACKGROUND ... 21
2.1 INDUSTRY OVERVIEW ... 21
2.1.1 Typical Product Profile ... 22
2.1.2 Benefits of Speed to Market in Medical Devices...24
2.2 JOHNSON & JOHNSON... 24
2.2.1 New Product Development at J&J Medical Devices ... 25
3 ADDITIVE MANUFACTURING TECHNOLOGIES AND CAPABILITIES ... 29
3.1 ADDITIVE MANUFACTURING OVERVIEW ... 29
3.1.1 Classes of available 3D Printing Technology ... 30
3.1.2 Available Post-Processing Options to Improve Printed Parts... 33
3.1.3 Advantages of Additive Manufacturing...34
3.1.4 Drawbacks and limitations of current technologies ... 36
3.1.5 Emerging Technologies ... 37
3.2 USE OF ADDITIVE MANUFACTURING IN MEDICAL DEVICES...39
3.2.1 Industry trends ... 39
3.2.2 Key competitor behavior... 40
3.2.3 Key industry focus area: scan-to-print ... 41
3.2.4 FD A G uidance ... 42
3.3 USE OF ADDITIVE MANUFACTURING AT J&J ... 42
3.3.1 3D Printing Expertise... 43
3.3.2 Organizational learning around 3D Printing at J&J... 43
3.3.3 Internal C apabilities ... 44
3.3.4 External Capabilities ... 46
3.3.5 Current Process for producing 3D Printed parts ... 46
3.3.6 Business Commitment to 3D Printing ... 47
3.3.7 Value Generation from AM ... 47
4 DEVELOPING AN IMPROVED STRATEGY FOR USING 3D PRINTING IN NPD ... 49
4.1 IN TR O D U C TIO N ... 49
4.2 OPPORTUNITY IDENTIFICATION AND ANALYSIS... 49
4.3 IMPROVING ORGANIZATIONAL 3D PRINTING KNOWLEDGE TO SPEED NEW PRODUCT DEVELOPMENT ... 53
4.3.1 Designing an organization to facilitate 3D Printing learning... 53
4.3.2 Practical implementation of the new organizational structure at J&J... 57
4.3.3 Refining Organization Structure through Optimization Model ... 63
4.3.4 Discussion of Results and Recommendations from Simulation Data...72
4.4 IMPROVING ORGANIZATIONAL 3D PRINTING CAPABILITIES TO SPEED NEW PRODUCT DEVELOPMENT ... 76
4.4.1 3D Printing Technologies, Techniques, or Process Improvements to Enable NPD A cceleration ... 76
4.4.2 D iscussion of Results... 98
4.5 CULTURAL IMPACTS... 102
4.6 APPLICATIONS OF RESEARCH TO OTHER AREAS OF J&J... 102
4.6.1 Applications of 3D Printing research... 102
4.6.2 Applications of organizational structure research... 103
5 RECOMMENDATIONS AND CONCLUSIONS...105
6 APPENDIX...106
6.1 3D PRINTING UTILIZATION ASSESSMENT FRAMEWORK ... 106
6.2 BEST FIT PARAMETERS FOR 3D PRINTED RAPID TOOLING ... 107
6.3 SIPOC ANALYSIS FOR 3D PRINTING BLITZES ... 108
6.3.1 H igh-level diagram ... 108
6.3.2 Detailed explanation of SIPOC analysis ... 109
6.4 SIMULATION DETAILS ... 113
6.4.2 Non @ Risk M odel Inputs ... 114
6.4.3 Calculation Details... 117
6.4.4 Simulation results... 124
7 REFEREN CES...132
List of Figures
Figure 1: Project approach for research and implementation ... 18
Figure 2: High-level framework for determining 3D Printing capabilities... 18
Figure 3: DePuy Synthes Corail Hip System [19]... 22
Figure 4: Ethicon Enseal for cutting and sealing tissue [20] ... 23
Figure 5: Ethicon Securestrap Open, for implanting a hernia mesh [21]...23
Figure 6: New Product Development "Triad" [23]...26
Figure 7: Development group involvement over the NPD cycle (not necessarily to scale) [23]...26
Figure 8: Typical Medical Devices NPD critical path (-36 months total) ... 28
Figure 9: 2015 share of total 3D Printing industry demand by end-use industry [27]...29
Figure 10: Breakdown of 3D Printing demand by end-use application [27]...30
Figure 11: Production component printed in Ultem [30]...31
Figure 12: Complex part produced using Stereolithography [34] ... 32
Figure 13: Overview of 3D Printing categories for metals technologies [28]...33
Figure 14: Overview of 3D Printing categories for polymer technologies [28] ... 33
Figure 15: Deloitte framework for understanding AM paths and potential value [40]...35
Figure 16: Basic process of Continuous Liquid Interface Production (CLIP) [48]...38
Figure 17: Quantity of 3D Printed medical devices with FDA approval [53]...40
Figure 18: Process of producing physical models from medical imaging [58] ... 41
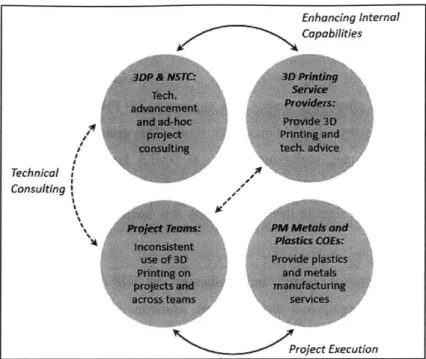
Figure 19: Current relationships of groups influential in use of 3D Printing ... 44
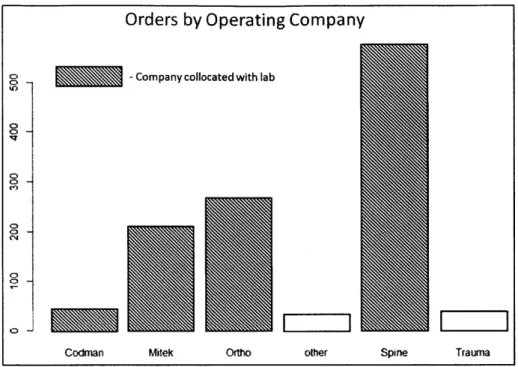
Figure 20: Orders by operating company for one J&J lab... 45
Figure 21: Pathway for internally producing parts at J&J ... 47
Figure 22: Quotes from various employees at J&J... 52
Figure 23: Proposed organizational structure to maximize value from 3D Printing technologies ... 55
Figure 24: Ascending volume of resources from Pioneers to Developers...56
Figure 25: Cascade of industry knowledge between 3D Printing functional groups...57
Figure 26: Pathway for internal production of 3D Printed parts under proposed structure ... 59
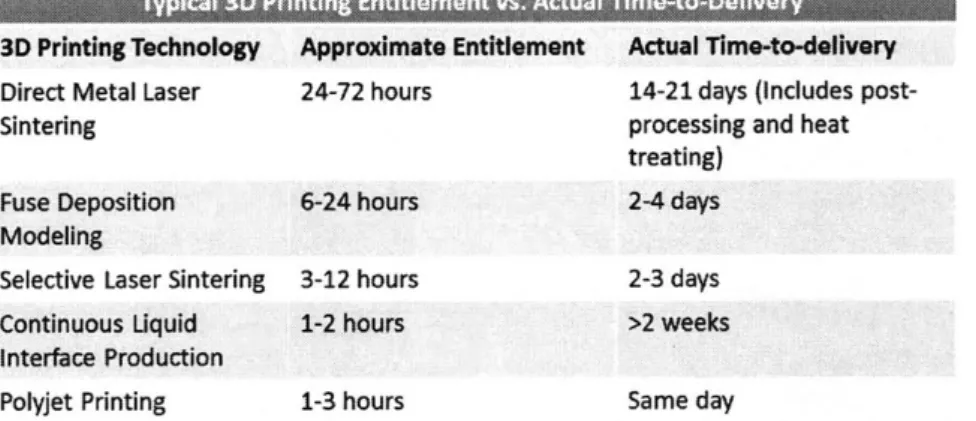
Figure 27: Entitlement vs. actual Time-to-Delivery for various 3D Printing technologies in MD ... 59
Figure 28: Key proposed interactions between Service Providers and Developers during NPD cycle (Contrast to Figure 8 on page 28) ... 61
Figure 29: Example plots of model outputs from one iteration ... 64
Figure 30: Impact of Initial Knowledge on Aggregate Benefit of proposed strategy...73
Figure 31: Importance of tB with respect to initial knowledge gap... 74
Figure 32: Extreme case illustrating the importance of the Pioneer Learning Rate over time ... 75
Figure 33: Cavity, sprue, gate, and runner design for sample part ... 78
Figure 34: Sample part shown with traditionally machined cooling channels ... 78
Figure 35: Sample part shown with conformal cooling channels ... 79
Figure 36: Cooling analysis for conventionally cooled mold (total cooling time 29.4 seconds)...80
Figure 37: Cooling analysis for conformally cooled mold (total cooling time 23.6 seconds)...80
Figure 38: Warpage analysis for conventionally cooled mold (max deflection 1.87mm)...81
Figure 39: Warpage analysis for conformally cooled mold (max deflection 1.45mm)...82
Figure 41: Useful life (in units produced) of PolyJet-printed injection molds vs. other molds for various
m aterials [3 1]...89
Figure 42: Attempt to create 3D Printed injection mold inserts using Carbon's cyanate ester ... 91
Figure 43: Experimental setup with metal-polymer blend injection-mold inserts...91
Figure 44: Control setup with PolyJet injection-mold inserts...92
Figure 45: Experimental prototype parts for both setups...93
Figure 46: Example part produced using the experimental mold (left) and PolyJet (right)...94
Figure 47: Failure modes of metal-polymer blend mold (left) and PolyJet mold (right)... 95
Figure 48: Typical market adoption curve showing potential for 3D Printed limited launch...101
Figure 49: Framework for determining 3D Printing capabilities...106
Figure 50: Best fit parameters for using 3D Printed (PolyJet) Rapid Tooling [83]...107
Figure 51: SIPOC diagram for 3D Printing Blitzes ... 108
Figure 52: Impact of Initial Knowledge on Aggregate Benefit of proposed strategy...124
Figure 53: Probability distribution of Aggregate Benefit for Simulation 1 ... 125
Figure 54: Sensitivity of Aggregate Benefit to various input ranges for Simulation 1...125
Figure 55: Ranking of input variable impact on program value over specified range for Simulation L.. 126
Figure 56: Probability distribution of Aggregate Benefit for Simulation 2...126
Figure 57: Sensitivity of Aggregate Benefit to various input ranges for Simulation 2...127
Figure 58: Ranking of input variable impact on program value over specified range for Simulation 2... 128
Figure 59: Probability distribution of Aggregate Benefit for Simulation 3 ... 128
Figure 60: Sensitivity of Aggregate Benefit to various input ranges for Simulation 3...129
Figure 61: Ranking of input variable impact on program value over specified range for Simulation 3... 129
Figure 62: Probability distribution of Aggregate Benefit for Simulation 4...130
Figure 63: Sensitivity of Aggregate Benefit to various input ranges for Simulation 4...130
List of Tables
Table 1: Potential benefits of 3D Printing in the healthcare industry ... 16
Table 2: Top five medical devices companies by 2015 revenue ... 21
Table 3: Experimental values for Initial Knowledge Levels ... 71
Table 4: @Risk decision variables...113
Table 5: Non-decision variables utilizing @Risk distributions ... 113
Table 6: Fixed non-@Risk model inputs ... 116
Table 7: Experimental values for Initial Knowledge Levels ... 117
Table 8: Abridged calculations page from optimization workbook... 117
1
Introduction
1.1 Purpose of Project
Speed to market is a critical component for any New Product Development (NPD), but especially so in medical devices-improved product designs delivered with speed can significantly benefit patient outcomes, which is a top priority for Johnson & Johnson (J&J) [1]. Additionally, increased saleable lifetime, first mover advantage, customer loyalty, and company reputation for innovation are some of the other reasons that accelerating the pace of development is important to the company. One possible way to accelerate development is the field of additive manufacturing, or 3D Printing. Initially used only for early prototyping and development, innovation in 3D Printing over the past decade and recent FDA guidance on the subject opens the opportunity for its expanded use in product development [2]. 3D Printing has potential advantages not only for the products themselves, but also for the tooling and fixtures that produce them [3]. This project aims to improve J&J's strategy for using 3D Printing throughout the development cycle, which minimizes time-to-market. The strategy includes identifying a portfolio of
potential technologies and techniques to use in development; recommendations for process improvements
enabling teams to better use 3D technologies; an assessment of current internal and external capabilities and potential improvement areas; and recommendations on organizational changes that will facilitate quicker adoption of new technology.
1.2 Problem Statement
Despite J&J's depth of knowledge and advanced capabilities in the space, there remain widely different ranges of 3D Printing implementation across teams and projects, with potentially millions of dollars in uncaptured value [4]. Interviews show that some pockets within R&D groups have used advanced 3D Printing methods to successfully speed project developments, while others consistently resort to less
efficient and more costly traditional methods of prototyping [5]. Additionally, investigative work as part
of several project teams has shown sub-optimal utilization of both internal equipment and expertise between J&J franchise companies; where some teams have access to extensive resources, others do not. Uneven distribution of knowledge and capabilities is not unique to 3D Printing among rapidly evolving technologies at J&J-management interviews revealed this to be a widespread challenge when
implementing new technology. While the company has had success developing advanced technical
expertise in confined "Centers of Excellence", diffusion of this expertise to the practitioner level is too
slow, according to management.
In order to accelerate the time-to-launch of new products, J&J could benefit from a strategy where both technological and organizational changes capture the benefits of 3D Printing. Due to the nature of its
products, which are seen to provide a fertile testbed for additive manufacturing in healthcare, the Medical Devices (MD) segment of J&J was selected to pilot and test an enhanced strategy.
1.3 Project Goals
3D Printing has been studied for a wide variety of applications, and shows promise in many industries.
The technology has the potential to drive tremendous value in the healthcare industry, through several mechanisms as outlined in Table 1.
Customization
Ability to
easily
produce
patient-specific
products such
as orthopedic
implants.
Improved
Design
Reduced cost
of iterations
allows for
increased
design
refinement
and higher
quality end
products.
Reduction in
Supply Chain
RiskNon-specialized
tooling allows
for supplier
diversification
and
decentralized
manufacturing.
Improved Part
Characteristics
Layer-by-layer
production
allows
designers
almost infinite
geometric
freedom, with
fewer
manufacturing
constraints.
Speed to Market
Enhanced
prototyping
speed and
potential to
improve capital
equipment can
accelerate
product
launches.
Table
1:
Potential benefits of 3D Printing in the healthcare industryThe goal of this project was to improve J&J's processes involving 3D Printing and generate at least two months of time savings in typical 36-month MD NPD cycles. The intended outcome of this project is to maximize the return on investment from any proposed solution-therefore the value of time or project costs saved needs to outweigh the cost of any process improvements or capital expenses.
This project was based on experiences with three different project teams within J&J's Medical Devices franchise; two with Ethicon Endo-surgery in Cincinnati, OH, and one with Ethicon, Inc., in Somerville,
NJ. The success of the effort was based on a comparison between project schedules before and after the
improvement process took place.
14 Project History and Approach
The original hypothesis that motivated this project was that if NPD teams had access to the latest 3D Printing technologies, they could launch products faster and provide value to J&J. After working within
several project teams, this hypothesis evolved to include not just the access to the technology, but also to the organizational learning required to use it effectively. This was the result of observations showing that despite J&J having an excellent ability to develop knowledge and capabilities in high-level research, these investments are slow to diffuse to the project level where value is captured. For example, if one of the company's corporate-level research labs works with a 3D Printing company to pilot a new material, it may be several years before an engineer in Medical Devices is made aware of the advancement.
It became clear over the course of this project that organizational structure is equally, if not more important, than access to equipment when predicting the implementation success of a rapidly evolving technology. Using the Value-Capabilities-Assets-Processes (VCAP) operations strategy framework, this idea is expressed in the following equation:
Value = Capabilities * (Assets + Processes) (1)
In this equation, value is expressed as a function of three organizational characteristics: Capabilities, which are an organization's ability to manage effectively and accomplish tasks; Assets, which are its physical equipment and human capital; and Processes, which are paths formed by a network of activities that transform inputs to outputs [6]. Applying this methodology to the introduction of a new technology, like 3D Printing, it is clear that value captured depends on more than just capital investment. Developing processes and learning to manage organizational impacts are also critical to an effective implementation strategy. In the past, J&J has had difficulty capturing value from new technology at the project level, despite pockets of advanced internal capabilities-perhaps a lack of focus on process development is the explanation.
Ultimately, the project objective evolved to the following: "Develop a 3D Printing implementation strategy, which provides project teams with enhanced technical knowledge, improved access to 3D Printing capabilities, and streamlined 3D Printing manufacturing processes that significantly accelerates
NPD cycles and provides value for J&J." To meet this objective, an approach was developed that
involved five phases, as outlined in Figure 1. Because NPD projects within J&J Medical Devices
typically occur over a period of several years, and this project's duration was roughly six months, this approach was needed to accelerate the learning process. Figure 1 outlines the project phases.
Figure I. Project approach/fbr research and inplenentation
.1.4.1 Linderstand organizationand technology
The first phase was broken down into two components: technology understanding and organization understanding. Technology research identified new types of 3D Printing and new techniques enabled by it that had not seen widespread use at J&J. This project was conducted by attending a 3D Printing focused convention, interviewing technology experts, benchmarking industry leaders, and completing an extensive literature review. Additionally, trips to several J&J sites provided data on both technologies available to engineers and their current applications in development projects.
improved
market
D 3D Printing
KnowledgeI01
improved
Optimal quality and
utilization of design
3D Prining
-apabilities
Development
Figure 2: H igh-levelframework./or determnining 3D Printing capabilities
Throughout this process, data on J&J's organizational structure was collected-this included learning
about the functions of various groups and the relationships between them. To synthesize both the
technology and organizational data, the framework shown in Figure 2 and expanded upon in Appendix Section 6.1 was developed to help understand the current and potentially improved states of a 3D Printing
strategy. Collecting data on available technologies and the organization's structure formed an
understanding of 3D Printing's current role in the organization, and helped to identify opportunities where that role may change in the future.
1.4.2 Nvork within projects to prove value
The second phase shown in Figure 1 was meant to implement many of the immediate opportunities identified in the first phase and test their efficacy. Three projects, which were at various stages but still relatively early in development, were chosen to pilot many of these techniques for practicality. Each New Product Development project team included six to ten members consisting of a product manager, several engineers or designers, and manufacturing experts. Project scope depended largely on how far along it was in the development process; for example, the least developed project had greater input from R&D than the most mature project. Conversely, the most mature project had more input from supply chain than the least developed project. This dynamic is discussed in detail in Section 2.2.1.1. The goal of working with these teams was to identify organizational or technological improvements that could significantly reduce NPD cycle time.
1.4.3 Design structure for implementation strategy
Based on experience with the three pilot projects, the next step shown in Figure 1 was to develop an implementation strategy for use across J&J Medical Devices. This step included refining the techniques used in Phase 2 and designing an organizational structure to ensure an effective rollout of the process. Developing a strategy that would capture benefits from the new technologies required careful consideration of the existing organizational structure of the franchise; details of the developed proposal are outlined in the following sections.
1.4.4 TVest and refine implementation strategy through simulation
Because the duration of this project was significantly shorter than the duration of the NPD projects on which were focused, it was impossible to experimentally evaluate the impact of the improvements proposed. For this reason, the next phase involved modelling the proposed structure to determine critical
variables and provide recommendations for implementation. This simulation resulted in general
recommendations for the implementation strategy and provides a framework for further refinement once the value of 3D Printing in New Product Development is more thoroughly evaluated.
1-4.5 Transition process to sustaining organization
The final step in this project's approach sought to transition the process to an organization within J&J that
will be responsible for implementation of the recommendations developed. This involved not only
identifying appropriate roles and responsibilities for the organization, but also securing leadership support for the initiative. To capture the potential opportunities identified in this effort, it is important for J&J to transition and sustain the process improvements. Given the value proposition identified in the previous phases, doing so will benefit future NPD projects.
1.5
Thesis Overview
Chapter 2, "Background", provides context for the project and discusses the relevant industry environment. It discusses the general process of medical device development and the specific process used by J&J.
Chapter 3, "Additive Manufacturing Technologies and Capabilities", discusses the current state of the 3D Printing industry and its applications within medical devices. This section also highlights the inherent advantages and disadvantages of each technology. It provides a brief description of their use at J&J. Finally, this section discusses emerging technologies that may be useful for product development in the near future.
Chapter 4, "Developing an Improved Strategy for using 3D Printing in NPD", details the process taken in this project to develop recommendations to improve J&J's strategy of using the technology. This section also provides frameworks for change based on this project, and discusses a model that can be modified to estimate the value of similar programs in J&J's Consumer Products and Pharmaceutical franchises.
Chapter 5, "Recommendations and Conclusions", provides a summary of the findings from this project,
and discusses the overall value of an improved 3D Printing strategy.
2
Background
The following chapter provides an overview of the medical devices industry, including some typical products and the several advantages of speed in this market. J&J's Medical Devices franchise and its New Product Development organizational structure are discussed, which provide specific context for this project within the company.
2.1 Industry Overview
The medical devices industry is competitive, fast moving, and strictly regulated. New products are developed every year based on feedback from surgeons and patients that are meant to give an advantage over the competition. The medical devices industry encompasses thousands of products and treatment areas. The products created by medical devices companies also have a wide range of complexity-some are as simple as a contact lens, where others are as complex as a multi-axis surgical robot. Regardless of their form, medical devices are designed to improve patient quality of life, procedural outcomes, or
cost-effectiveness.
The estimated global revenue from sales of medical devices was $330B in 2016, with orthopedics composing the largest share, at 14% of the total. This market is geographically concentrated; roughly 80% of revenues come from just ten countries, with the United States alone accounting for 39% of the total. Despite increasing revenues, new cost and pricing pressures come from a push for value-based care [7]. Table 2 shows the top companies in the medical devices industry, ranked according to their 2015 revenue from devices.
Company 2015 Sales from Medical Devices
J&J $25.14B [8]
Medtronic $20.26B* [9]
GE Healthcare $17.64B [10]
Siemens $12.93B [11]
Philips $11.60B** [12]
*In 2016, Medtronic merged with Covidien for combined revenues of $28.8B **Converted from Euros to Dollars using exchange rate of 16:$1.06
Table 2: Top five medical devices companies by 2015 revenue
In the United States, the US Food and Drug Administration (FDA) regulates medical devices companies under Code of Federal Regulation (CFR) 21 Part 807 [13]. This code dictates the process for registering new devices prior to sale. An important characteristic of this code is that it classifies medical devices as
Class I, II, or III based on the level of control deemed necessary to ensure the safety and efficacy of the product. Class I devices, such as a wheelchair or orthodontic bracket, pose the lowest risk to patients and have the least strict filing requirements. Class II products, such as special surgical tools, pose a greater risk to the patient. Class III products, such as replacement heart valves, involve the most risk to the patient and require premarket approval [14]. The products analyzed in this project largely fall under Class II regulations.
The medical devices industry, and more broadly the healthcare industry, is subject to pressure from both payers and legislators to reduce the cost of treatment. Increased attention from these institutions and several highly publicized cases of price increases, such as drug maker Mylan's 2016 price hike of EpiPen, have resulted in a more difficult environment for healthcare companies [15]. Increased pressure on top-line revenue drives a focus on cost cutting, innovation, and new product differentiation to preserve profits.
L. . Typical Piroduct Profike
As discussed previously, medical devices come in a wide range of sizes and functions-in fact, the FDA has classified approximately 1,700 different types of medical devices [16]. Despite this, the vast majority of unit sales in the industry share many characteristics. For example, a device that is implanted or used in surgery needs to undergo a sterilization process. The materials used, therefore, need validation that they can withstand the degrading side effects of gamma radiation, steam, or ethylene oxide. Additionally, there are a limited number of biocompatible materials that can be used in medical devices [17]. Because of these constraints, manufacturers are limited to a certain set of materials that provide both the quality and the durability needed. Common plastics used in the industry include polyethylene, polypropylene, and polycarbonate; common metals include stainless steel and titanium [18]. An example of a medical device that uses several of these materials is shown in Figure 3 below, which uses titanium, stainless
steel, and several polymers [19].
With this breadth of products in mind, this project focused on narrowing scope to a manageable subset of devices that are representative of a large part of the total industry. The subset chosen was hand-held
surgical tools. These products were chosen because they presented significant engineering and
scheduling challenges through complex components, high quality requirements, material variety, and manufacturing method diversity. The devices in focus are made of materials such as stainless steel, polycarbonate, or bio-absorbable polymers that are typical in the devices industry.
Examples shown below are J&J products that fall under the description above. Surgeons or patients use these products regularly, with volumes of at least 500,000 per year and ranging up to several million per year. These products are used by hospitals around the world and represent the leading edge of surgical technology. Despite only analyzing a narrow subsection of medical devices, the techniques learned through this project apply to many more products across the industry and J&J's portfolio of businesses.
Figure 4: Ethicon Enseal
for
cutting and sealing tissue [20]2.1.2 Benefits of Speed to Market in Medical Devices
Speed to market is critical to the success any company. The ability to market a product sooner can enable
increased sales life, surgeon or patient loyalty, and new-treatment pricing power. Additionally,
developing and producing products faster gives the manufacturing organization valuable production experience, potentially resulting in reduced costs compared to competitors. When analyzing the opportunity cost of lost revenue alone, one month of development time can easily reach several million dollars for a new medical device based on J&J analysis.
Product development overruns, and conversely development accelerations, can be broken down into three categories: The first case arises when demand for a product is inelastic, and a company's lost value is simply the time value of money over the delay. The second and more severe case involves products with some substitutes, where later market entry results in lower peak sales. The third and worst case, which addresses products that become part of other systems, occurs when a development delay causes severe and continuing reduction in sales over a product's lifetime. Because of extensive training needed for use, surgeon loyalty, and switching costs, medical devices typically fall into the third and most severely affected category [22].
Because it is difficult to quantify the effect of speed on expected sales over time, competitor behavior, and customer loyalty, J&J's finance team recommended excluding these factors from this project's analysis. Doing so led to the conservative approach that values an accelerated project schedule as only the net present value of earlier revenue. In other words, despite medical devices falling into the worst-case scenario described above, any analysis performed in this project treats demand as inelastic, with the value of speed determined only by the time value of revenue of the expected schedule truncation. This choice was based on the relatively small change expected resulting from this work-the finance team determined that truncating a 36-month timeline by two months is not likely to have a significant effect on the shape or amplitude of a sales curve.
2.2
Johnson
&
Johnson
Johnson & Johnson (J&J) first incorporated in 1887, and today is one of the largest and most diverse healthcare companies in the world with over $70B annual revenue and 127,000 employees. The company has three different segments grouped by type of product produced: Pharmaceuticals, Medical Devices, and Consumer Products [8].
This project focuses specifically on the Medical Devices (MD) segment, which is further broken down into a portfolio of operating companies that provide orthopedic, surgery, cardiovascular, diabetes, and vision care products. The Medical Devices segment saw revenues decrease by 8.7% from 2014 to 2015,
with sales reduction across each business resulting largely from currency impacts. Spend on R&D within the MD segment remains steady at an average of 6.2% of sales over the past three years [8].
Within the MD segment, this thesis is largely based on work completed with Cincinnati, Ohio based Ethicon Endo-Surgery, Inc. (EES) and Somerville, New Jersey based Ethicon Inc. EES produces a variety of surgical tools, which include advanced harmonic cutters, laparoscopic staplers, and trocars. Ethicon, Inc. focuses largely on wound closure solutions, which include sutures, hemostat patches, topical skin adhesives, and hernia meshes.
2.2.1 New Product Development at J&J Medical Devices
J&J Medical Devices develops new products each year through its surgery, orthopedic, cardiovascular,
and specialty businesses. At any time, there are several dozen new products under development across these segments. The following section discusses the structure of J&J's New Product Development (NPD) organization, and follows with a description of the typical process used to bring a product to market.
2.2. 1. 1 Ne Product Development organizational structure
The structure of J&J's Medical Devices development organization is a "Triad", with Global Strategic Marketing (GSM), Research and Development (R&D), and Product Management (PM) making up the
three main groups. GSM is tasked with developing the commercialization strategy, which involves
capturing voice of customer, pricing data, expected sales volumes, and regional sales specifics. R&D is responsible for developing a product design which can meet customer requirements, applicable regulations, and cost targets. Finally, PM is tasked with developing a supply chain strategy to ensure adequate customer service, while optimizing costs [23].
Figure 6: New Product Development "Triad" [23]
Figure 6 also illustrates how the interactions between these groups are critical to a successful new product launch. GSM feeds customer data to R&D, which develops an initial concept. PM and R&D then work closely to develop a final product that optimizes cost and value through Design for Manufacturing (DFM), Design for Assembly (DFA), and Design to Cost (DTC). As PM works to finalize the supply chain for launch, it is working closely with GSM to refine sales volumes and ensure adequate capacity. This process is generically outlined in Figure 7, for a typical Medical Device New Product Development.
Hitghly Involved Group Involvement Not Involved Con Gene cept ration -4... '4 '4 '4 '4 '4 '4 '4 '44. Concept Development ..-... ... I I /
Concept Production Line Finalization Finalization
Product Development Time
Figure 7: Development group involvement over the NPD cycle (not necessarily to scale) [23]
PM . ... GSM - - - --R&D -,_ _ Product Launch
1 3
Housed within the Medical Devices PM group, J&J maintains both Metals and Plastics Centers of Excellence, which are centralized groups of manufacturing experts who provide component-level recommendations to project teams. These groups specialize in traditional high-volume manufacturing techniques, such as injection molding and extruding plastics, or stamping, Metal Injection Molding (MIM), or machining metals. Both groups are routinely involved throughout the NPD process, and have built a strong reputation among the R&D teams and Product Managers for meeting both quality and cost constraints.
2.2.1.2 Typical New Product Development Process
J&J Medical Devices uses a Stage Gate process for New Product Development. Both R&D and GSM are
heavily involved in the first several stages, where a market need is developed into a tangible prototype. During these early stages, several iterations of product concepts are revised based on customer feedback. When the team has reached a viable concept prototype, the business commits to producing it and a manufacturing site is selected. The next several stages involve further refining the product, ensuring supply chain readiness, and regulatory submission. Once a product is ready for sale, it can be marketed in one of two different ways: it can be rolled out via a limited launch or a full launch. A limited launch occurs if there is question to the strategic commercial value of a product. Finally, a product reaches the final stage once all New Product Development activities conclude [24].
A typical product development in the MD segment involves several common tasks that define the
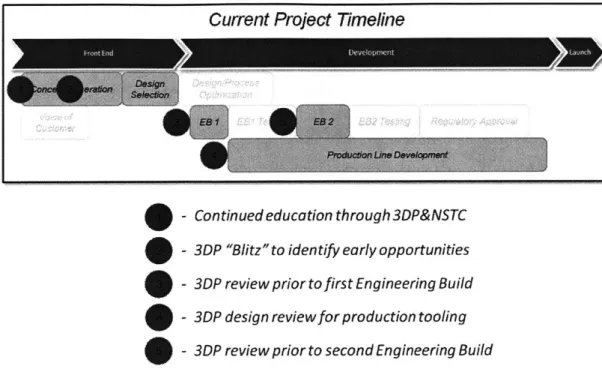
project's critical path. The "Front End" of NPD involves Concept Generation and Design Selection; these steps are highly iterative and often use 3D Printing to build both touch-and-feel and functional prototypes. After Design Selection, there are several rounds of "Engineering Builds"; these low-volume production runs build units for reliability testing. The number of Engineering Builds depends on the complexity of the product and the ability of the team to reach a point where it is comfortable with the design's form and function.
Production Line Development, which is the process of preparing the manufacturing line to deliver the expected volume of units, occurs in parallel to the Engineering Builds. Despite not having a finalized design upon starting this process, developing the production line in parallel with product design allows for a significantly shorter critical path, and is common practice at J&J MD. Typically, Production Line Development is completed soon after Regulatory Approval, as shown in Figure 8 below. It is important to note that most Class II NPD projects schedules are structured such that Regulatory Approval does not fall on the critical path. After the team meets these prerequisites, the product is then ready to market.
Figure 8 shows an overview of this process; any given project can vary slightly from this template, but in general, this model is consistent for the focus areas of this thesis.
Current Project Time/ine
Design Design/Process
Concept Generation S.Lcigon Optimization
ES 1 E f1 Testing E8 2 EB2 Testing Regulatory Approval Production Line Deveicpmant
*EB is an abbreviation for "Engineering Build"
3 Additive Manufacturing Technologies and Capabilities
The 3D Printing industry is experiencing exponential growth in both size and available technologies. From the first commercial stereolithography machines pioneered by 3D Systems in 1987, the industry has expanded to many dozens of manufacturers producing a variety of machines with capabilities ranging from desktop prototyping to stainless steel production line work [25]. According to PwC, two out of three companies surveyed in 2014 were using 3D Printing in some capacity [26]. Of those that are using 3D Printing, over 60% reported they were experimenting with using the technology beyond strictly prototyping. Between 2003 and 2015, the industry's Compound Annual Growth Rate of revenue was 21%
[10]. Additionally, new technologies include novel capabilities such as printing in carbon fiber composite
and ceramic materials. 3D Printing has proven to be a valuable technology that can provide both time and cost savings during development and beyond.
This chapter provides a brief summary of current available technologies and discusses applications to the medical devices industry.
3.1 Additive Manufacturing Overiew
Additive manufacturing has applications to many different industries for its ability to produce rapid, low-cost parts. Figure 9 shows the current distribution of total 3D Printing revenue based on industry, with medical and dental applications providing an important part of the total.
Share of 3D Printing Industry Demand by
Sector Consumer products/electronics -~ 13% Industrial/business_ -machines 20% Medical/dental 12% Aerospace _ Acdemic institutions 10% N-Government/niltary Motor vehicles 1 Other LArchitectural 6%
14% 5% 3%
Within the companies that use 3D Printing, there is a wide range of end uses for the technology. The diversity of application shows that 3D Printing is no longer confined to touch-and-feel prototyping-in fact fully one-third of all 3D Printing currently produces functional parts, as shown in Figure 10.
Figure 10: Breakdown of 3D Printing demand by end-use application [27]
3.1.1 Classes of available 3D Printing Technology
The wide range of end-use applications is a result of the ddiversity of technology options from which to choose. Depending on desired characteristics such as cost, speed, material, strength, and surface finish, part production can be optimized for the specific application. To categorize the various technologies, ISO and ASTM developed several classes through ISO/ASTM 52900, which are used to group by general process [28]. Each class is discussed briefly in the sections below [27].
3.1.. Material Extrusion
Printers in this group of technologies selectively dispense material through a nozzle. Material Extrusion is commonly used because it is inexpensive, relatively easy to operate, and compatible with a wide range of materials. This class of technologies is the most commonly used type of 3D Printing. A specific example technology is Fused Deposition Modeling (FDM) [27]. Because these printers can print in engineering materials such as acrylonitrile butadiene styrene (ABS) or Ultem, as opposed to UV-unstable resins only suitable for prototyping, they can be used to make end-use parts, though there are some
3D Printing Industry Demand by Application
Tooling components 7% Patterns for metal
castings 8% Functional Parts 33% Patterns for prototype tooling-7%
Fit and assembly
16%
Education/research
10%
Presentation models d Other
limitations on surface finish [29]. Figure
11
shows a production component that produced using FDM Material Extrusion technology.Figure 11: Production component printed in Ultem [30]
3.1.1.2 MAfaferial Jetting
This growing segment of printers uses ink-jet nozzles to dispense droplets of photopolymers, which are cured by UV light [27]. These systems can print at high rates of speed and with very high quality surface finishes. Due to UV sensitivity of the parts they create, Material Jetting is often not suitable for long-term end-use parts. An example technology is PolyJet, by Stratasys [31].
3.1.1.3 Binder Jetting
Originally developed at MIT [32], this class of technologies uses alternating layers of powder and liquid bonding agent. This is a versatile technology that can use any powdered material for builds, though post-print sintering may be required. HP's Multi Jet Fusion technology, which promises high quality and very high print speeds, is an example of Binder Jetting and is currently in to process of commercialization.
3.1.1.4 Sheet Lamination
This group of technologies uses sheets of paper or other thin material, cuts each layer to shape, and adheres them together to create a 3D model. This class is not commonly used in the medical devices industry, but has among the lowest material costs of any 3D Printers.
3.1.1.5 [lat Phtopolymerization
This class of printers uses light to sequentially cure layers from a vat of liquid photopolymer resin. First commercialized in 1988 as Stereolithography (SLA), Vat Photopolymerization remains a popular choice for engineers because of its large variety of available materials and good surface finish [27]. New technologies in this class, such as Continuous Liquid Interface Production (CLIP), improve on the original concept by delaying the chemical reaction to create fully homogeneous parts [33].
Figure 12: Complex part produced using Stereolithography
[34]
3.1.1.6 Powder Bed Fusion
This versatile class of technologies has wide prototyping and production applications, with available materials such as Nylon and stainless steel. In this process, directed thermal energy is used to fuse select regions of a powder bed. Industrial giants such as GE have already used Powder Bed Fusion to reduce weight and increase reliability in several critical jet engine parts [35]. Two popular example technologies
in this class are Electron Beam Melting (EBM) and Direct Metal Laser Sintering (DMLS) [27].
3. 1.1. Directed Energy Depos ithi
This class of technologies is limited to very large machines that use a laser or an electron beam to melt a continuous stream of powder [36]. These machines are used for industrial-focused applications such as pipe cladding, and typically have multi-material and five-axis capabilities [27].
3.13 1.8 Considerations when choosing a specific technology
Figure 13 and Figure 14 provide a breakdown of each technology based on critical characteristics for metallic and polymer materials, respectively [28]. A basic understanding of available technologies is critical to selecting the best one for a specific application. For example, parts made with a powder bed technique will have significantly different mechanical properties than those made with an extrusion technique, even while using same material. The process steps used by different technologies controls the suitability of parts produced for a particular application, and project teams can use the figures below as a starting point to isolate potential candidate techniques.
mateialMetallic
fusion stamlted Solidstate
g S ta te o f M e lte d s ta te
so
r a et d ste h o l i e es[ 2t
aterni F-ament /Mretd Powder "W Sheet
feestock material rmaterial
si eSheet
dls stack
Basic AM SRtac deposition of Selectve sion of Fus of
principle mel a subste material in a powder bed stacked sheets Souce Of Electro" Lawe Eleto LAWe Ultrasound
beo me
Mec Sheet
C~c~e En Posinfwder Bed Fusion Lamination
Figure 13: Overview of_3D Printing categoriesfiJor metals technologies [28/
mat ulk atra mteil mtil
Process Material Material Powder Binder Matedal mat maera
category Extrusion Jettjg Fusion Jetting Jetting r v mination
Figure 14: Overview of 3D Printing categories for polymer technologies [28]
3.1.2 Available Post-Processing Options to Improve Printed Parts
In addition to the available 3D Printing technologies, there are a large number of post-processing options that can alter and improve the final properties of a printed part. Despite adding time, complexity, and cost to builds, these processes can greatly enhance the range of practical uses for 3D Printing while still remaining faster and cheaper than alternative manufacturing methods. While this thesis will not discuss
all available post-processing options, several characteristics these processes seek to improve are discussed below [27]:
Surface finish: A limitation of 3D Printers is often that they cannot achieve a comparable surface finish to injection molding, stamping, or other methods. This can be overcome by finish machining, grinding, polishing, coating, micro-machining, or sanding. These processes often involve adding material to the initial model, such that the finishing step brings the part to the specified dimension [27].
Color: Some 3D Printing technologies have limited color options. This drawback can be overcome through computational hydrographic printing, coating, or painting [37].
Material: Innovative techniques have been developed to coat plastic parts with a metal coating, such as Nanovate, which provides for a compelling alternative to Metal Injection Molding (MIM)
[38]. Additionally, 3D Printing can be used to make injection molds, as discussed in Section
4.4.1.5.
Strength: The strength of binder-jetted parts can be improved through a process called
infiltration, which also makes the parts impermeable to liquids [39]. Metal parts can easily be heat-treated to improve their properties, through a three-step process involving stress relieving, hot isostatic pressing, and precipitation hardening [27].
Understanding the advantages and limitations of each technology is critical to capturing value from it-despite a wide variety of available technologies and post-processing techniques, 3D Printing is not suitable for every application. 3D Printing is a rapidly evolving class of technologies, and it necessitates continuous learning. It is critical that product developers have access to adequate training materials and expertise; this concept is explored in detail in Chapter 4.
3.1.3 Advantages of Additive Manufacturing
3D Printing technologies are fundamentally different that traditional manufacturing technologies, and
these differences result in significant opportunities to capture value. Deloitte published a framework for understanding paths to value through 3D Printing, which identifies four key segments where companies can benefit [40]. This framework is shown in Figure 15.
High product change Path I: Product evolution
" Strategic imperative: B2'lanc r f growth. mnova& n, and
porformn
- Value driver. Balan o prof:t, sk,
d timno
" Key enabling AM capabilities:
-CO Custrmilion to.customer
requirremeits
"ircrease rproduc unctia 2ty
M'rket responven m
Zero Cast of wr, e )sed wo-tp~ext.
Path 1: Stasis
* Strategic imperative: rformance * Value driver: rot with cost
focus
* Key enabling AM capabilities:
-DesigI mnd rpid pr totping
- Production ard I m too5n
- SuppirtT ry 01 or "nsurance
ca pa ily
-Low Tate u tio/n cha-ngeo er
Path IV. Business model
evolution
- Strategic imperative: Growth and
nnovadOn
Value driver: Profit with revenue
Io'ur, and ns
- Key enabling AM capabilities:
- M1 i oturiivation
-Manufac turirng at point ofuse Supply chain disin or mediation ; Customn~er epowverme nt
Path II: Supply chain
evIolution
Strategic imperative: Perormnanc.
Value driver: P th costAt
No product change
Graphic: Deloitte University Press I DUPress.com
Figure 15: Deloitteframeworkfor understanding AM paths and potential value [40]
The capabilities described in Figure 15 are the result of 3D Printing's flexibility-the fact that a part is built layer by layer gives a designer geometric freedom to include complex features not possible using subtractive methods [41]. Additionally, 3D Printing requires no tool changes, no part-specific setups, and only a small footprint. Different technologies offer a wide variety of working materials, and post-processing can help to meet even the most strict dimensional specifications.
Several current processes at J&J fall into Paths I and III, which shows that the company has started to see the benefits that 3D Printing can bring to products. In the "Path I" quadrant shown in Figure 15, developers routinely use AM for prototyping, and teams have begun to use it to improve the quality of production tooling. In the "Path III" quadrant, J&J now offers low-volume customized cutting guides for knee replacement surgery through its TruMatch platform; despite requiring manual input to design each guide, this system adds value through time savings in the operating room and more successful surgical
CL

![Figure 9: 2015 share of total 3D Printing industry demand by end-use industry [27]](https://thumb-eu.123doks.com/thumbv2/123doknet/14029217.457971/30.917.247.709.637.971/figure-share-total-printing-industry-demand-end-industry.webp)
![Figure 10: Breakdown of 3D Printing demand by end-use application [27]](https://thumb-eu.123doks.com/thumbv2/123doknet/14029217.457971/31.917.213.692.243.594/figure-breakdown-d-printing-demand-end-use-application.webp)

![Figure 16: Basic process of Continuous Liquid Interface Production (CLIP) [48]](https://thumb-eu.123doks.com/thumbv2/123doknet/14029217.457971/39.917.249.649.470.822/figure-basic-process-continuous-liquid-interface-production-clip.webp)