Design and Characterization of a Compliant-Joint Robotic
Jumping Leg
by
Albert Duan Wang
Submitted to the Department of Mechanical Engineering
in partial fulfillment of the requirements for the degree of
Bachelor of Science in Mechanical Engineering
at the
MASSACHUSETTS INSTITUTE OF TECHNOLOGY
June 2010
ARCHNES
OF TECHNOLOGY
JUN 3
0
2010
LIBRARIES
@
Massachusetts Institute of Technology 2010. All rights reserved.
A u th or ... vY ... ... .. ...
Department of Mech nical Engineering
May 21, 2010
C ertified by ...
. ...... . .. . . ... . . - - ..angb e Kim
Assistant rofessor
Thesis Supervisor
Accepted by ...
...
.. ..
...
John H. Lienhard V
e Collins Professor of Mechanical Engineering
Chairman, Undergraduate Thesis Committee
Design and Characterization of a Compliant-Joint Robotic Jumping Leg
by
Albert Duan Wang
Submitted to the Department of Mechanical Engineering on May 21, 2010, in partial fulfillment of the
requirements for the degree of
Bachelor of Science in Mechanical Engineering
Abstract
Biological systems employ compliant joints to allow robust contact with the surroundings and to increase locomotive efficiency. In this experiment, we designed a three-link robotic leg with a compliant calf tendon that was acutated by a DC motor at the hip and measured the effect of compliance on the force profile and energy consumption for a single jump. The lengths of the femur, tibia, and foot were 150 mm, 210 mm, and 60 mm respectively. Overall vertical leg stiffness was varied from 472 N/m to 3980 N/m. Using a 40 degree angle ramp for the motor acutation profile, adding compliance tended to distribute force over time at a smaller magnitude which resulted in longer contact time with the ground. Total impulse was found to vary and peaked at a value of 3.42 Ns for a overall leg stiffness of 1180 N/m. The findings suggest that these systems can be optimized for performance by tuning the stiffness of compliant joints.
Thesis Supervisor: Sangbae Kim Title: Assistant Professor
Acknowledgements
I would like to thank Professor Sangbae Kim for guidance, insights and material support for this thesis;
Professor John Lienhard for supporting me throughout my undergraduate career as my academic advisor; and
Hyunglae Lee, Sang Ok Seok, and Andres Valenzuela for their work on the stiff jointed two-link robot leg that provided the basis for this project.
I would like to especially acknowledge Sang Ok Seok for extensive assistance with LabVIEW and with numerous other aspects of this project.
Contents
1 Introduction
2 Jumping Leg Design
2.1 Previous Work ... 2.2 Compliant Leg Design ...
2.2.1 Structure ... ... .. .. . .. ... ..
2.2.2 Actuation . . . .
2.2.3 Compliant features . . . .
3 Effect of Compliance on Jumping Performance 3.1 Experimental Design . . . .
3.1.1 Experimental Apparatus . . . .
3.1.2 Motor Controller and Instrumentation
3.1.3 Experimental Methods . . . .
3.2 Simulation using Simplified Model . . . .
3.3 Results and Discussion . . . .
4 Conclusion
4.1 Variations in Jumping Performance with Compliant Foot
4.2 Future W ork . . . . . . . . 15 ... . . . . .. . 15 . . . 15 . . . 15 . . . 16 . . . 17 19 19 19 20 20 22 23 Mechanism...
List of Figures
2-1 Design of previous jumping leg. These pictures were obtained from Sang Ok
Seok... ... 16
2-2 A CAD model of noncompliant and compliant the foot design. . . . . ... 17
2-3 Physical model of new leg design showing the extension springs used for the compliant calf tendon and the leaf springs in the foot. . . . 18
3-1 Physical Layout of Apparatus . . . 20
3-2 Instrumentation diagram. . . . 21
3-3 Simplified second order model of the jumping leg. . . . 22
3-4 Motor angle input and equivalent displacement for the prismatic actuator used in the m odel. . . . 23
3-5 Force profiles using the leg model with various foot stiffnesses. The values of k are for the equivalent stiffness of the leg when measured at the toe. . . . 23
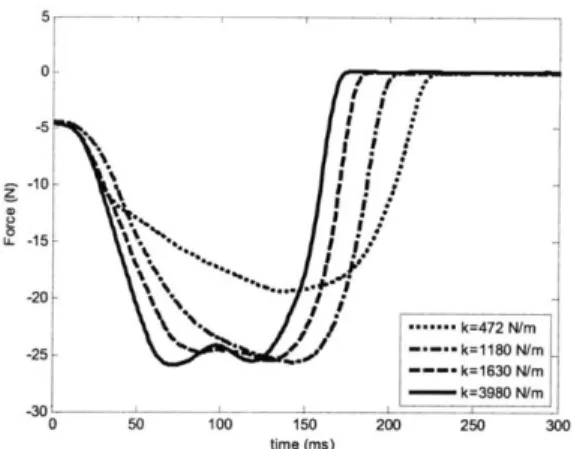
3-6 Typical force profiles during jumping. Note: force data after 300 ms is in steady state and thus not shown. . . . 25
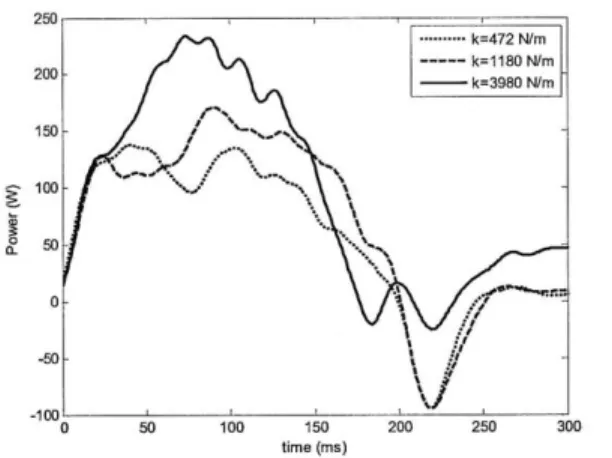
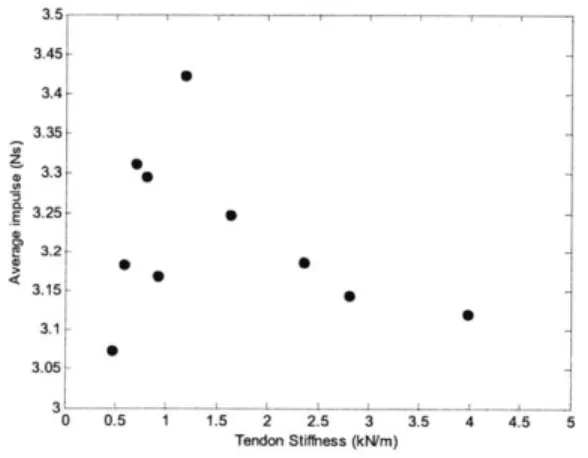
3-7 Typical power consumption profiles during jumping for various leg stiffnesses. Note: power consumption data after 300 ms is in steady state and is not shown. 26 3-8 Average Total Impulse during jumping for various leg stiffnesses. . . . 27
3-9 Average Energy Consumption during jumping for various leg stiffnesses. . . . 28
List of Tables
3.1 Mass properties of experimental apparatus. . . . 20
3.2 Values of average jump time, average impulse and average energy
Chapter 1
Introduction
Traditional robot design employs stiff connections between actuators to end effectors in order to maximize bandwidth and transmission forces with accuracy in manufacturing ap-plications. However, in legged robots operating in unstructured environments, stiff joints have many drawbacks. Joint compliance plays an important role in biological locomotion systems by allowing robust contact with surroundings. In addition, physical spring elements act as energy storage devices to efficiently transmit force to the end effector.
In the experiments presented in this paper, we study the effect of compliance on a three-link robotic leg driven by a single DC motor at the hip. In order for the leg to jump, the leg needs to produce a impulse which is provided by the rotation of the femur from the motor. In the stiff-jointed configuration, the DC motor needs to operate in a larger torque range where the efficiency of motor are lowered. Using a compliant leg with springs will allow energy storage during the jumping motion that, if properly tuned, can increase the total impulse transferred from the actuator against the ground without imposing high torque on the motor. This will potentially affect a overall dynamics of the legged robots and reduce the torque requirement of the actuators.
Chapter 2
Jumping Leg Design
The basic design of the leg is based on three-link animal legs with a femur, tibia and foot connected by revolute joints.
2.1
Previous Work
The design of the compliant leg is based on work done by Hyunglae Lee, Sang Ok Seok, and Andres Valenzuela in the Fall of 2009 for the MIT class 2.151 Advanced System Dynamics and Control. This design was a stiff-jointed two-link leg driven by a single DC motor at the hip that rotated the femur. A timing belt between hip and knee joints coupled the motion of the femur and tibia so that the angles from the ground to the femur and to the tibia are equal. A CAD model and physical model constructed from 3D printed ABS are shown in Figure 2-1.
2.2
Compliant Leg Design
Because the leg was to be constructed via extruded ABS deposition 3D printing, the leg was designed to combine features and reduce part count.
2.2.1
Structure
The robot geometry was designed such that the toe would move nearly vertically with respect to the hip which would minimize torques on the system. The femur, tibia, and foot lengths were 150 mm, 210 mm, and 60 mm, respectively. The femur was constrained to the motor
(b) Physical model of leg.
Figure 2-1: Design of previous jumping leg. These pictures were obtained from Sang Ok Seok.
axis by the motor axle and a large ball bearing around the motor casing. The knee and ankle joints were constructed with needle bearings and precision ground steel shafts. All leg links and timing belt pulleys were manufactured from extruded ABS with the Dimension uPrint 3D Printer.
2.2.2 Actuation
The leg is driven by a single DC motor at the hip joint. A FAULHABER DC Servo Motor Series 3863H 024C with a 43:1 reduction gearbox is coupled to the femur by a spur gear. In order for the foot to travel relatively vertically, the angles of the femur and tibia links with respect to the ground were constrained to be equal. This was achieved by a timing belt between the motor housing at the hip joint and the tibia at the knee with a 2:1 gear ratio between the two pulleys. In order to reduce slippage, an adjustable belt tensioner was constructed using an idler pulley that pressed against the outer surface of the belt to increase tension and the wrapping angle around the pulleys. The distance that the pulley pressed against the belt was adjusted by a M5 screw. The mechanism is shown in Figure
2-3.
-A
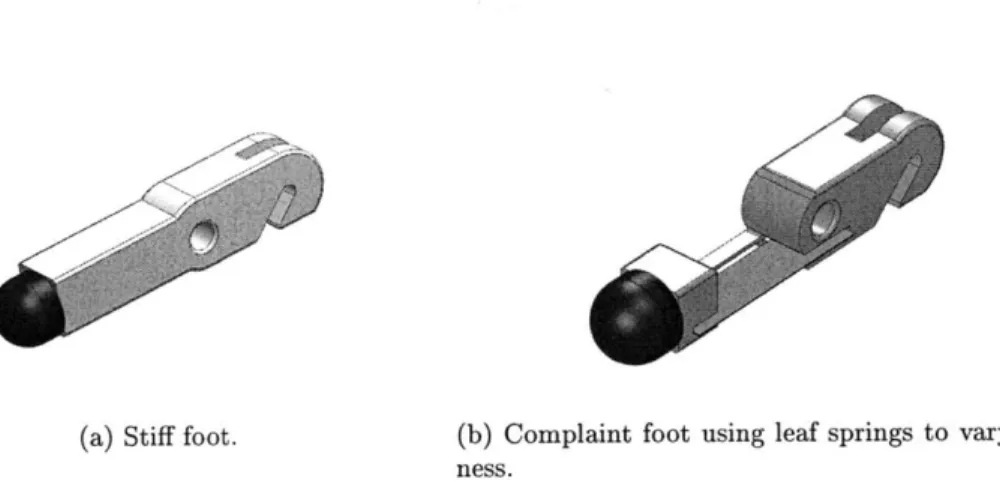
(a) Stiff foot. (b) Complaint foot using leaf springs to vary stiff-ness.
Figure 2-2: A CAD model of noncompliant and compliant the foot design.
2.2.3
Compliant features
The compliant foot was designed so that the toe and heel were connected by thin flexible leaf springs. The springs were 30 mm long, 13 mm wide and constructed from 0.25 mm thick
C1095 Blue-Tempered Spring Steel. Using the equations of beam deflection, the effective
spring constant at the toe is given by
k = + ltoe 2 (2.1)
3EI 2EI
Using the spring geometry and Young's modulus E=200 GPa, each spring had a nominal spring constant of 190 N/m. In order to achieve variable spring force at the toe, up to six springs could be stacked to vary the spring constant. A similar stiff foot was constructed with the same critical geometry. The CAD models of the feet are shown in figure 2-2.
A second mode of compliance was the calf tendon connecting the heel of the foot a
point on the femur. The purpose was to add compliance between the foot rotation and the knee rotation. Extension springs were connected in parallel to provide variable stiffness. Attachment points for the springs were 30 mm and 30 mm away from the ankle and knee joints respectively. In this configuration, when the hip is rotated such that the angle between
the femur and the ground is 45 degrees and the tibia forms a right angle with the foot, the vertical stiffness at the toe due to the calf tendon is half of the value of the stiffness of the springs. Figure 2-3 shows the physical model with compliant calf tendon springs and leaf springs on the foot.
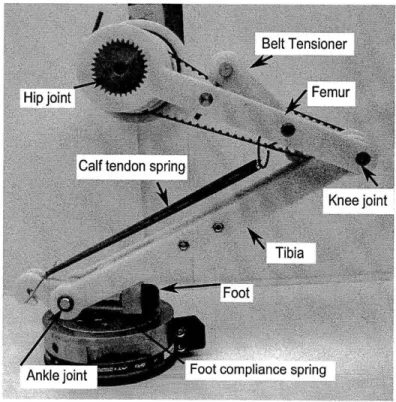
Figure 2-3: Physical model of new leg design showing the extension springs used for the compliant calf tendon and the leaf springs in the foot.
Chapter 3
Effect of Compliance on Jumping
Performance
3.1
Experimental Design
3.1.1
Experimental Apparatus
The experimental apparatus was designed to measure the effects of compliance on the jump-ing performance of the robot leg described in Chapter 2. A boom was used to constrain the motion of the leg to the vertical plane as well as to reduce the effective gravitational force on the robot. The boom was constructed from a 1.83 m length of extruded aluminum 6061-T6 tubing with 44 mm diameter and 1.6 mm wall thickness. The pivot point was placed 1.5 m away from the robot and the counter balance was attached 0.33 m from the pivot on the opposite side. The robot was connected to the boom by a cutout profile of the tube on the robot and secured with adhesive tape. Counterweights were added until the force of the robot against the ground was reduced to 4.5 N. Figure 3-1 shows the physical layout of the experimental setup. Table 3.1 contains mass parameters of the apparatus.
Robot Leg Boom
Counterweight Pivot
Q Force Sensor
Figure 3-1: Physical Layout of Apparatus.
Table 3.1: Mass properties of experimental apparatus.
Robot leg mass 1 kg
Boom mass 2.2 kg
Boom length 1.83 m
Robot distance from pivot 1.5 m
Counterweight mass 6.5 kg
Equivalent inertial mass of robot 1.9 kg
3.1.2
Motor Controller and Instrumentation
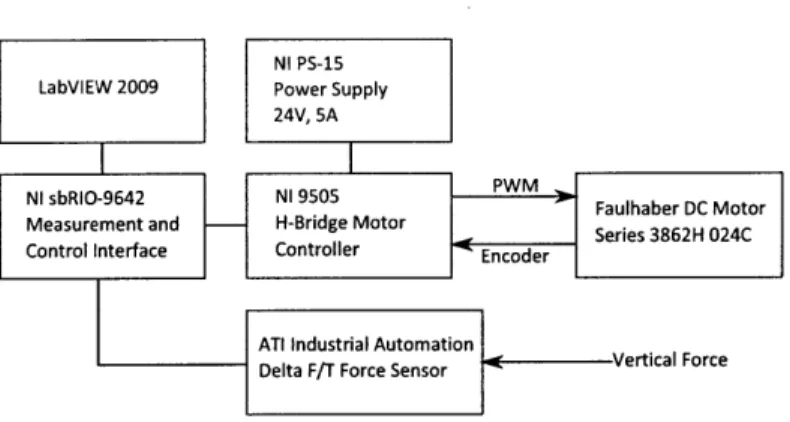
Motor control and data acquisition were managed by a computer running LabVIEWTM2009 software. This was connected to the NI sbRIO-9642 Measurement and Control Interface. A
NI 9505 Full H-bridge Motor Driver was connected to the sbRIO-9642 and was used to drive
the DC motor and measure the output of the optical encoder. The motor driver board was powered from a separate power supply NI PS-15 with 24 V output and a current limit of
5 A. Force measurement was obtained through the ATI Industrial Automation Delta F/T DAQ Transducer that measured vertical force up to 1980 N with resolution 0.25 N. The
outputs of the force sensor were interfaced with the sbRIO-9642. A full system diagram is shown below in Figure 3-2.
3.1.3
Experimental Methods
A LabVIEW interface was used to control the motor motion profile with an adjustable PID
controller. The interface also collected force, motor position, and motor current data with a sampling rate of 1000Hz from the start of actuation for 600 ms. At rest, the angle of the
Figure 3-2: Instrumentation diagram.
femur with the ground was 45 degrees. Since the shape of the motor actuation profile was found to have a large effect on jumping performance, all experiments used a ramp profile. Jumps were actuated from rest by a 40 degree angle ramp of the motor over 200 ms using a proportional gain of 8. This was equivalent to changing the the angle between the femur and the ground from 45 to 85 degrees. Since the motor and associated drive electronics could not provide the necessary power to allow the robot to jump at full weight, counterweights were added to the boom until the effective weight of the robot on the force transducer was 4.5 N.
The experiment was performed using a stiff foot and compliant calf tendon. Overall leg stiffness was given by the vertical deflection of the toe at the starting position of 45 degrees for the angle between the femur and the ground. In this geometry, the vertical stiffness of the leg is half of the value of the spring stiffness used for the tendon. For each overall stiffness value, the experiment was performed 3 times.
Both the force data and the motor current were filtered by a 1Hz FIR low pass filter with
31 taps in LabVIEW to remove noise. The force profile was normalized by compensating
for the initial offset, which was found by averaging the last 200 ms of data during which the leg was airborne. Total impulse was obtained by numerical integration with step size of
1 ms of the force measurement from the beginning of actuation to the point at which the
compensated force measurement first reached 0 N. Instantaneous motor power consumption was obtained by the motor current measurement and the nominal voltage of the power supply. Total energy consumption was obtained by numerical integration with a 1 ms step size of the power measurement until it first reached zero after the start of actuation.
3.2
Simulation using Simplified Model
The jumping leg can be reduced to simple second order mass, spring, actuator model. Since most of the mass on the robot is located at the hip joint and motor, we can model the mass of the robot and the inertia of the boom and counterweight as a point mass at the hip joint. The equivalent mass of the robot is 1.9 kg from Table 3.1. The actuation of the hip and femur by the motor can be simplified to a vertical prismatic actuator. The foot with compliance from the tendon springs can be modeled as a single spring. The model described is illustrated in Figure 3-3a. Assuming that the spring and prismatic actuator are massless, we can rearrange elements as shown in Figure 3-3b. From the simplified model, we can determine the following transfer function relating the force on the ground to the extension of the actuator. F(s) mks2 Xa(s) ms 2 + k
m
m
_LXPrismatic
k
Actuator
-
Xa
k
*Prismatic
Actuator
(a) Mass, spring, actuator model(b) Rearranged mass, spring,
ac-of the jumping leg. tuator model of the jumping leg.
Figure 3-3: Simplified second order model of the jumping leg.
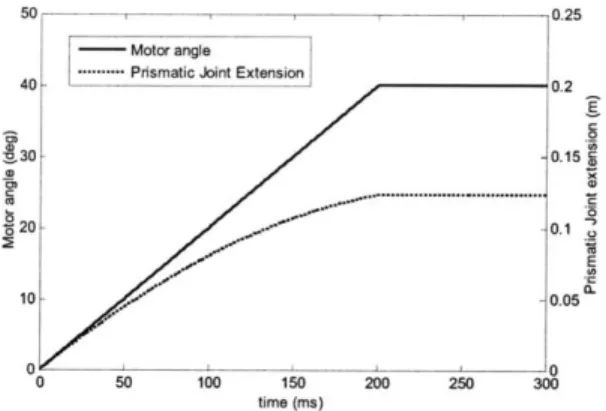
Given the 40 degree angle ramp input of the motor from a 45 degree starting angle, the equivalent profile for the prismatic actuator as shown is given by
Xa(t) = Lsin(45deg + 0m) - Lsin(45deg) (3.2)
the motor. Figure 3-4 shows the motor drive profile and the corresponding extension by the equivalent prismatic actuator. Using the lsim function in MATLAB R2009a, we obtain the force profiles shown in Figure 3-5. For a given actuator profile, the force profile becomes shorter in time and greater in magnitude as the stiffness of the calf tendon is increased.
50 0.25
- Motor angle
40..-..---...Prismatic Joint Extension0.
E
10 -0.05
CT 0
00 50 100 150 200 250 300
time (ins)
Figure 3-4: Motor angle input and equivalent displacement for the prismatic actuator used in the model. ...--- = 0 / 0 -20- 01 a3~a. 10-0 N0.rn 0 50 100 150 200 250 300 time (ms)
Figure 3-5: Force profiles using the leg model with various foot stiffnesses. The values of k are for the equivalent stiffness of the leg when measured at the toe.
3.3
Results and Discussion
The force profiles in Figure 3-6 show a similar tendency as the force profiles generated from the simplified dynamic model in 3-5 above. As the stiffness of the leg increases due to increased stiffness of the calf tendon, the force profile shows reduction in length of time and an increase in magnitude of force. Thus adding compliance by using a softer calf tendon tends to distribute the force evenly over time.
force profile at relatively low stiffness values, increasing stiffness produces a large effect on the shape of the force profile. For the variations at higher stiffness in Figure 3-6c, force profiles still exhibit some change in shape but tend to converge. This does not follow the theoretical model which predicts a higher magnitude of force at higher stiffnesses. Also, at these higher stiffness values of k=1630 N/m and above, the force profiles show a double dip at the maximum magnitude of force. This artifact is consistent among the high stiffness configurations and is most likely due to the ability of the stiff tendon in transferring the vibration from the motor or the counterweight to the toe of the robot. We noticed that the counterweight attachment was not completely stiff and had a natural frequency of about 3 Hz and thus contributed to the force profile artifact.
150
time (ms)
(a) Force profiles for selected leg stiffnesses 472 N/m, 1180 N/m, 1630 N/m and 3980 N/m.
50 100 150 time (ms)
200 250 300
(b) Force profiles for leg stiffnesses from 472 N/m to 3980 N/m.
150 time (ms)
(c) Force profiles for leg stiffnesses from 1630 N/m to 3980 N/m.
Figure 3-6: Typical force profiles during jumping. Note: force data after 300 ms is in steady state and thus not shown.
CL
50--10 -/
0 50 100 150 200 250 300
time (ms)
(a) Power consumption profiles during jumping for leg stiffnesses 472 N/m, 1180 N/m and 3980 N/m. 250 ---.k=472 N/m 200- --- k=578 N/m --- k=696 N/m 15- k=802 N/m 150 - /k=920 N/m 100 - -o 50-0- 1 -50-0 50 100 150 200 250 300 time (ms)
(b) Power consumption profiles for leg stiffnesses from 472 N/m to 920 N/m. 100 + 0 50 0- -50--100 0 50 100 150 time (ms)
(c) Power consumption profiles 1180 N/m to 3980 N/m.
300
for leg stiffnesses from
Figure 3-7: Typical power consumption profiles during jumping for various leg stiffnesses. Note: power consumption data after 300 ms is in steady state and is not shown.
The power consumption profiles shown in Figure 3-6 show an increase in magnitude of motor input power for increased stiffness. Peak power consumption ranges from 140 W for a leg stiffness of 472 N/m to 230 W for a leg stiffness of 3980 N/m. Like the force profiles, the power consumption profiles at high stiffness tend to converge as shown in Figure 3-7c.
Due to the configuration of the calf tendon, the springs were in tension at full extension of the leg. Thus the nonzero steady state power consumption after 250 ms of the measurement was due to maintaining this position while the leg was airborne and was unrelated to the power consumed while producing the impulse required for jumping. At about 200 ms the power dips below zero on all of the power profiles. This is due to the controller applying reverse current to the motor in order stop actuation at the end of the angle ramp.
By integrating the force profile over time, the total impulses for each stiffness
configu-ration were obtained. The average values of total impulse for each leg stiffness are shown below in Figure 3-8. Over the range of stiffnesses used, the average impulse data suggests that there is an optimal value for the particular leg and motor input used for the experiment. Average impulse peaks at the stiffness value k=1180 N/m. The data point at k=920 N/m
and impulse 3.17 Ns shows an unexpected dip and is likely an outlier.
3.5 3.45- 3.4- 3.35-Z 3.25- 3.2-3.15 - 3.1- 3.05-3 0 0.5 1 1.5 2 2.5 3 3.5 4 4.5 5 Tendon Stiffness (kN/m)
Figure 3-8: Average Total Impulse during jumping for various leg stiffnesses.
By integrating the power profile over time, the values of total energy consumption by the
motor during jumping were obtained. The average values of energy consumption are plotted for different leg stiffnesses in Figure 3-9. These show a sharp increase with leg stiffness around
the compliant calf tendon causes slower force transfer from the motor to the toe, the motor does not require as much initial current to generate the torques necessary to follow the input angle ramp. 28 27 -S26 E 25- 24-0 23 -12 0
~22-S 21-201 0 0.5 1 1.5 2 2.5 3 3.5 4 4.5 5 Tendon Stiffness (kN/m)
Figure 3-9: Average Energy Consumption during jumping for various leg stiffnesses.
The time of liftoff for various leg stiffnesses is shown in Figure 3-10. As predicted in the simple dynamic model and shown in the force profile plots, higher leg stiffness tends to decrease the total length of time that the leg applies force to the ground. Since higher stiffness legs tend to transfer more force at the beginning of actuation, the time needed to produce the necessary conditions for liftoff is shorter. With compliant legs, the force transfer is a smaller magnitude drawn over a longer time so the time need to build up vertical velocity
is longer and hence the leg achieves liftoff later.
230 220-210 2 00 - * 12 190 e 15e 180-S 17%0 5L 0 0.5 1 1.5 2 2.5 3 3.5 4 4.5 5 Tendon Stiflness (kN/m)
Figure 3-10: Average time to liftoff for various leg stiffnesses.
liftoff time are given in Table 3.2.
Table 3.2: Values of average jump time, average impulse and average energy consumption for the leg stiffnesses used in the experiment.
Leg Stiffness Average Jump Average Impulse Average Energy
(N/m) Time (ms) (Ns) Consumption (J) 472 222 3.07 21.6 578 207 3.18 22.5 696 199 3.31 24.4 802 192 3.30 25.5 920 183 3.17 23.3 1180 199 3.42 25.2 1630 184 3.25 25.3 2350 182 3.19 27.0 2800 177 3.14 25.3 3980 172 3.12 25.9
Chapter 4
Conclusion
4.1
Variations in Jumping Performance with Compliant Foot
Mechanism
It is clear from the experiments that for a given actuation profile, jumping performance of a robotic leg can change drastically by varying the compliance at the foot using a compliant calf tendon. By varying the stiffness of the calf tendon spring so that overall leg stiffness in the vertical direction was between 472 N/m and 3980 N/m, force profile, energy usage and total impulse showed large differences. For the given leg geometry and an actuation profile that ramped the angle of the femur with resect to the ground from 45 to 85 degrees over 200 ms, we found that compliance tended to distribute the force over a longer time which resulted in longer jump times in which the foot was in contact with the ground. The power profile tended to be smaller in magnitude for compliant legs due to the deflection of the foot and the resulting reduction in torque on the motor and thus the current required to maintain the acuator profile.
For a given motor output profile, the total energy required and impulse produced could also be varied by changing compliance. Stiffer leg configurations required more energy but did not necessarily produce the greatest impulse. Energy consumption rose sharply with increased stiffness from 21.6 J at a stiffness of 472 N/m until about a stiffness of 1180 N/m when it remained relatively constant between 25 and 26 J. Total impulse produced with a leg stiffness of 472 N/m was 3.07 Ns and rapidly increased with tendon stiffness until it peaked at a stiffness of 1180 N/m with a value of 3.42 Ns. For further increases in stiffness, the
impulse dropped until it reached 3.12 Ns at a stiffness of 3980 N/m. These results suggest that stiffness can be tuned to optimize jumping performance.
In the dynamic model presented in Section 3.2, in which we assumed no actuator cons-triants, adding compliance does not help the leg acheive greater impulses. However, in the experimental results, we found that total impulse had a clear peak at a leg stiffness of 1180 N/m. The added compliance distributed the force over time and which allowed the motor to operate in a lower torque range. This effect is favorable for DC motors which have reduced performance in the high torque range due to the force-speed profile, heat dissipation and higher friction in transmission.
4.2
Future Work
This project was a preliminary study of the effect of joint compliance on jumping perfor-mance. Since the main purpose of compliance in legs is to store energy, a future experiment could be to store energy in the springs before jumping. Future work could also characterize the nonlinear effects of the tendon spring on overall leg stiffness and jumping performance. In this experiment overall leg stiffness was linearized about the starting position. Although compliance in the leg was acheived by adding a compliant tendon, a spring foot could be used to study the effect of different compliance types.
It was found through experimentation that the motor input profile had a large effect on the jumping performance. Although this experiment used a constant angle ramp to produce actuation for all trials, the effect of input shaping could be used to optimize jump performance. The power electronics and motor used in this experiment could not produce the necessary power output to jump without the boom and counterweight. Future goals would be to design for jumping in normal gravity which would be more applicable to robot designs. This experiment characterized single jump performance from rest. For locomotion and multiple loading, the energy storage effects of the compliant mechanisms would allow energy retention from previous jumps and possibly increase performance at the limit cycle.