EUROPEAN ORGANISATION FOR NUCLEAR RESEARCH (CERN)
Submitted to: JHEP CERN-EP-2017-046
2nd August 2017
Studies of Zγ production in association with a high-mass dijet
system in pp collisions at
√
s
= 8 TeV with the ATLAS detector
The ATLAS Collaboration
Abstract
The production of a Z boson and a photon in association with a high-mass dijet system is studied using 20.2 fb−1 of proton–proton collision data at a centre-of-mass energy of √
s = 8 TeV recorded with the ATLAS detector in 2012 at the Large Hadron Collider. Final states with a photon and a Z boson decaying into a pair of either electrons, muons, or neutrinos are analysed. Electroweak and total pp → Zγ j j cross-sections are extracted in two fiducial regions with different sensitivities to electroweak production processes. Quartic couplings of vector bosons are studied in regions of phase space with an en-hanced contribution from pure electroweak production, sensitive to vector-boson scatter-ing processes VV → Zγ. No deviations from Standard Model predictions are observed and constraints are placed on anomalous couplings parameterized by higher-dimensional operators using effective field theory.
1 Introduction
The scattering of two vector bosons, VV → VV with V = W/Z/γ, is a key process for probing the SU(2)L× U(1)Ygauge symmetry of the electroweak theory that determines the self-couplings of the vector bosons. In particular, it is important to independently test the triple and quartic gauge-boson coupling strengths (TGCs and QGCs), since new phenomena could generate additional contributions to QGCs with respect to the Standard Model (SM) predictions [1–4], while not significantly affecting the TGCs [5].
Experimental information about QGCs is still limited. At the Large Hadron Collider (LHC), it can be deduced from studies of processes with either three bosons in the final state [6–10] or involving pure electroweak production of heavy dibosons [11–14]. In particular, the CMS experiment recently studied Zγ [15] and Wγ [16] electroweak production and used these results to set limits on anomalous QGCs. Final states involving photons have higher rates than those involving only W and Z bosons identified via their leptonic decay modes.
The Zγ j j electroweak (EWK) production (qq → qqZγ) — where j represents a jet and q a quark — contains processes with fourth-order electroweak coupling O(α4em). These include vector-boson scattering (VBS) as well as non-VBS diagrams, e.g. when the Z boson and the photon are radiated off the initial- or final- state quarks (Figure 1, left). The VBS processes do not respect the electroweak gauge symmetry when taken in isolation and cannot be studied separately from other electroweak processes, due to large interference effects.
q q Z γ q q q q Z γ q q q q q q γ Z q q Z γ g g
Figure 1: Feynman diagrams of electroweak Zγ j j production involving VBS subprocesses (bottom left) or non-VBS subprocesses (top left) and of QCD Zγ j j production with gluon exchange (top right) or radiation (bottom right).
ling O(α2emα2s) (Figure1, right). Such processes can involve radiated gluons in the initial and/or final state as well as quark scattering processes mediated by gluons. According to the SM, a small con-structive interference occurs between production of QCD and EWK quark scattering.
Experimentally, Zγ j j EWK processes are characterized by the production of two energetic hadronic jets with wide rapidity separation and large dijet invariant mass [17]. The vector-boson pair is typically produced more centrally than in non-EWK processes. These kinematic properties are exploited to select a phase-space region where the electroweak production is enhanced with respect to the QCD-mediated processes.
Previous measurements of inclusive and differential cross-sections of Zγ production in proton–proton collisions at the centre-of-mass energy of 8 TeV performed by the ATLAS experiment [9] show good agreement (within 6%) between data and next-to-next-to-leading-order (NNLO) predictions.
A study of Zγ j j EWK production is made in a search region defined to maximize its expected sig-nificance. This corresponds to a phase-space region with a high-mass dijet system, a high-energy photon, and a Z boson decaying into a pair of electrons or muons — in the following referred to as the "charged-lepton channel". The contribution from QCD production is constrained with data from a background-enriched control region, corresponding to events with lower dijet invariant mass. A fiducial cross-section is extracted and compared to SM predictions. The total Zγ j j (EWK+QCD) production cross-section in both the search and control fiducial regions is also measured.
The Zγ j j EWK production is also studied in events with high-transverse-energy (ET) photons, where an enhancement of the VBS cross-section is typically predicted by theories beyond the Standard Model. In this phase space region, a search for anomalies in the quartic WWZγ coupling along with the presence of ZZZγ, ZZγγ and Zγγγ couplings — forbidden in the SM at tree level — is performed. Extensions of the SM Lagrangian are parameterized by higher-order operators in an effective field the-ory that modifies the boson couplings. The sensitivity of the search is improved by also considering events with the Z boson decaying into neutrinos. The phase-space region optimized for anomalous QGC (aQGC) sensitivity is defined differently for the charged-lepton and neutrino channels. For the latter, since the Z boson is experimentally invisible, extra requirements are included to suppress the relatively large backgrounds present in this channel.
The paper is organized as follows. A brief description of the ATLAS detector and the data set used in this analysis is given in Section2. The simulation of the contributing processes is summarized in Section3, while event reconstruction and selection is detailed in Section4. The determination of the backgrounds and event yields are discussed in Section5. The extraction of the cross-sections are described in Section6. Finally, a search for aQGCs using events with high-ET photons is presented in Section7. Conclusions are drawn in Section8.
2 ATLAS detector and data
The ATLAS experiment [18] at the LHC is a multipurpose particle detector with a forward–backward symmetric cylindrical geometry and an almost 4π coverage in solid angle.1 It consists of a tracking
system called the inner detector (ID) surrounded by a thin superconducting solenoid providing a 2 T axial magnetic field, electromagnetic and hadronic calorimeters, and a muon spectrometer (MS). The ID covers the pseudorapidity range |η| < 2.5. It consists of silicon pixel, silicon microstrip, and trans-ition radiation tracking detectors. Within the region of |η| < 3.2, electromagnetic (EM) calorimetry is provided by high-granularity lead/liquid-argon (LAr) sampling calorimeters, with an additional thin LAr presampler covering |η| < 1.8 to correct for energy loss in material upstream of the calorimet-ers. A hadronic (steel/scintillator-tile) calorimeter covers the central pseudorapidity range (|η| < 1.7). The endcap and forward regions are instrumented with LAr calorimeters for both the EM and had-ronic energy measurements up to |η|= 4.9. The MS surrounds the calorimeters and is based on three large air-core toroidal superconducting magnets with eight coils each. It includes a system of preci-sion tracking chambers and fast detectors for triggering. A three-level trigger system is used to select events. The first-level trigger is implemented in hardware and uses a subset of the detector information to reduce the accepted rate to at most 75 kHz. This is followed by two software-based systems, called the high-level triggers, that together reduce the accepted event rate to 400 Hz on average, depending on the data-taking conditions.
The data set used in this analysis was obtained from proton–proton collisions recorded in 2012 by the ATLAS detector, when the LHC operated at √s = 8 TeV. The integrated luminosity of the data set used in this measurement is 20.2 fb−1with an uncertainty of 1.9% [19].
In the charged-lepton channel analysis, events are selected online by requiring the presence of either an isolated electron or muon candidate with a minimum transverse momentum (pT) of 24 GeV, or a pair of isolated electron candidates with pT > 12 GeV, or a pair of isolated muon candidates satis-fying pT > 18 GeV and pT > 8 GeV for the leading and subleading muons. Trigger efficiencies are included in the overall reconstruction efficiency, and the uncertainties in the efficiency of these trigger selections were estimated using control samples in data and amount to 0.2% and 0.5% in the e+e−γ j j and µ+µ−γ j j channels, respectively.
In the neutrino channel, the events are selected online by requiring a photon candidate with ET > 40 GeV and missing transverse momentum greater than 60 GeV. Trigger efficiencies are included in the over-all reconstruction efficiency, and the uncertainties in the efficiency of these trigger selections were estimated using control samples in data and amount to 2.0%.
3 Simulated samples and theory predictions
Monte Carlo (MC) event samples, using a full simulation [20] of the ATLAS detector by Geant 4 [21], are used to model the data, including contributions from the SM signal and expected backgrounds. The individual Zγ j j EWK and the Zγ QCD (with up to three additional final-state partons) processes are modelled at leading order (LO) with the Sherpa event generator v1.4.5 [22]. The EWK–QCD interference contribution is predicted from MadGraph [23] to be less than 10% of the EWK cross-section in the search region — invariant mass of the two leading jets, mj j, greater than 500 GeV—
rapidity (y) is defined as y= 1/2 × ln[(E + pz)/(E − pz)] where E (pz) is the energy (the z-component of the momentum) = − ln(tan(θ/2)) where θ is the polar angle. The distance between
with a decreasing trend as a function of mj j. This interference is treated as an uncertainty in the measurements, as discussed in Section 6.1. Major background processes, such as Z+jets, γ+jets,
W+jets, WW+jets, and WZ+jets are also modelled by the Sherpa event generator. These include up to five additional final-state partons at LO for the V+jets processes and up to three additional partons at LO for the VV+jets processes. All the Sherpa samples include parton showering (with the CKKW matching scheme [24,25] scale set to 20 GeV), and fragmentation processes along with simulation of the underlying event. They are generated using the CT10 [26] parton distribution function (PDF) set.
Uncertainties in the Sherpa modelling of the Zγ j j processes are estimated using 68% confidence-level PDF uncertainties, independent variations of renormalization and factorization scales by a factor of two and variations of the choice of CKKW scale (from 15 to 30 GeV).
Production of t¯t pairs is modelled by MC@NLO v4.06 [27,28], interfaced to Herwig v6.520.2 for parton showering and fragmentation, and to Jimmy v4.31.3 [29] for underlying-event simulation. The t¯tγ production is modelled with MadGraph5_aMC@NLO v5.2.1.2 [23] and the CTEQ6L1 [30] PDF set, with parton showering, hadronization, and the underlying event modelled by Pythia v8.183 [31]. The cross-section is computed at next-to-leading-order (NLO) according to Ref. [32].
Some of the systematic uncertainties of the Z+jets background estimate, which is extracted from data, are estimated using Z+jets NLO Powheg-Box v1.0 and LO Alpgen v2.1.4 (with up to five additional final-state partons) generated events. These samples are interfaced with Pythia v8.175 and Herwig v6.520.2 + Jimmy v4.31.3 respectively for the modelling of the parton shower, hadronization and underlying event.
Multiple proton–proton collisions (pile-up), corresponding to the conditions observed during the 2012 run, are added to each MC sample. This pile-up is simulated using Pythia v8.165 [31] with parameter values set according to the A2 tune [33] and the MSTW2008LO PDF set [34]. MC events are then reweighted so that the pile-up conditions in the simulation match those observed in the data.
The SM cross-section predictions for both the Zγ j j EWK and QCD processes with exactly two ad-ditional final-state partons are calculated at NLO precision in αs using the Vbfnlo event generator v2.7.1 [35–37]. All spin correlations and finite-width effects are included in the matrix-element
cal-culation, and for EWK production all resonant and non-resonant t-channel exchange contributions giving rise to a specific leptonic final state are considered. The CT10 PDF set is used for both EWK and QCD production as well as for the underlying-event generation and tune. These samples are generated separately (i.e. the interference between EWK and QCD is not taken into account in the modelling). A photon isolation requirement to remove the contributions from partons collinear to the photon is also included in the calculation. The uncertainty in these predictions due to the PDF and the choice of renormalization/factorization scale ranges from 4% to 10% depending on the processes and phase-space regions.
p2Tof the associated tracks is chosen as the hard-interaction vertex.
Electron candidates, reconstructed by matching an energy deposit in the calorimeter to a track in the ID, are required to have ET > 25 GeV and |η| < 2.47. In addition, they must satisfy a set of “Loose” [38] identification criteria based on a combination of shower shape information from the EM calorimeter and tracking information from the ID, corresponding to an average selection efficiency of about 93%. The electron tracks are required to have longitudinal impact parameter smaller than 0.5 mm with respect to the hard-interaction vertex, and the absolute value of the transverse impact parameter with respect to the primary vertex less than six times its measured uncertainty, to reduce semi-leptonic heavy flavor decay backgrounds. Electron candidates are also required to be isolated. This is achieved by requiring the sum of the transverse momenta of ID tracks associated with the primary vertex in a cone of size∆R = 0.3 around the electron direction, excluding the electron track, to be less than 10% of the transverse energy of the electron candidate itself. Uncertainties in the electron selection arise from: identification [38] and impact parameter selection variations; changes in the isolation definition; and uncertainties in the electron energy scale and resolution [39].
Muon candidates are reconstructed by combining tracks in the ID with tracks in the MS and are required to have pT > 25 GeV and |η| < 2.5. The ID tracks associated with these muons must satisfy several quality selection criteria [40]. The same requirement on the longitudinal impact parameter as for the electron track is also imposed on the combined muon track. The overall selection efficiency of the muon identification is about 97%. Muon candidates are required to be isolated using the same criteria as for electrons, but using a cone of size ∆R = 0.2. Uncertainties in the muon selection are derived from uncertainties in the muon momentum scale and resolution [40], and by varying the selection criteria on the muon track quality, impact parameter or isolation.
Photon reconstruction and identification criteria are based on the expected shapes of showers develop-ing in the electromagnetic calorimeter, as described in Ref. [41]. Photons must be within the fiducial volume of the central calorimeter (|η| < 2.37) and outside the transition region between the barrel and endcap calorimeters (1.37 < |η| < 1.52). The sum of the transverse energies of topological clusters reconstructed in the electromagnetic and hadronic calorimeters in a cone of size ∆R = 0.4 around the photon candidate, from which the energy of the photon cluster together with the median energy density of the event times the cone area are subtracted [42, 43], is required to be less than 6 GeV. Photon candidates are rejected if they are not well separated from the previously selected leptons, i.e. if ∆R(γ, `) < 0.4. The overall efficiency of this photon selection on Zγ j j EWK events is about 37% (96%) for photons with EγT >15 (150) GeV. Uncertainties in the photon selection come from: variations in the reconstruction and identification criteria [41]; changes in the isolation requirements; and uncertainties in the photon energy scale and resolution [39].
Jets are reconstructed from clusters of energy in the calorimeter using the anti-ktalgorithm [44] with radius parameter R= 0.4. Jet energies are calibrated using energy- and η-dependent correction factors derived using MC simulation and validated by studying collision data [45]. Jets are considered if they have pT > 30 GeV and |η| < 4.5. To remove jets originating from additional collisions in the same bunch crossing, at least 50% of the summed scalar pT of the tracks within a cone of size∆R = 0.4 around the jet axis must originate from the hard-interaction vertex. This criterion is applied only to jets with pT < 50 GeV and |η| < 2.4 [46]. Jet candidates are rejected if they are not well separated from the previously selected leptons and photons, i.e if∆R( j, `) < 0.3 or ∆R( j, γ) < 0.4. Systematic
The determination of the two-dimensional missing transverse-momentum vector, ~pTmiss, is based on the measurement of all topological clusters in the calorimeter and muon tracks reconstructed in the ID and MS [47]. Calorimeter cells associated with reconstructed objects, such as electrons, photons, τ → hadrons+ν decays, and jets, are calibrated at their own energy scale, whereas calorimeter cells not associated with any object are calibrated at the electromagnetic energy scale. The magnitude of this vector is denoted by ETmiss. Uncertainties in the measurement of ETmissare derived from uncertainties in measurements of the contributing objects.
4.2 Selection of`+`−γ j j events
In the charged-lepton channel, `+`−γ j j events are required to have one photon candidate with EγT > 15 GeV, a pair of opposite-sign (OS), same-flavour leptons (electrons or muons) and at least two reconstructed jets.
The invariant mass of the two leptons, m``, must be at least 40 GeV. The sum of the dilepton mass and the three-body ``γ invariant mass is required to be larger than 182 GeV, which is approximately twice the Z boson mass. This requirement ensures that the three-body invariant mass is larger than the Zboson mass, thus suppressing the cases where the Z boson decay products radiate a photon. The event topology of Zγ j j EWK production is characterized by the presence of two bosons in the central region and two jets with large rapidity difference and large dijet mass. Different phase-space regions are considered based on mj j. The inclusive region is defined by events with no requirement on the dijet invariant mass, the control region (CR) is defined by events with 150 < mj j < 500 GeV, and the search region (SR) is defined by requiring mj j > 500 GeV. The requirement of mj j > 150 GeV suppresses the background process of Zγ+ W(→ j j) triboson to negligible levels. The search region definition is optimized for the best expected significance for the Zγ j j EWK process, given amount of data.
Finally, the fiducial phase-space region optimized for sensitivity to anomalous quartic couplings (the “aQGC region”), is defined by requiring events in the search region to have a photon with ETγ > 250 GeV. The expected numbers of Zγ j j EWK events in the search and aQGC regions are 22.8 ± 1.5 and 0.41 ± 0.04, respectively.
A centrality observable ζ is defined to quantify the relative position in pseudorapidity of a particle or system of particles with respect to the two leading jets ( j1and j2):
ζ ≡ η − ¯ηj j ∆ηj j with ¯ηj j= ηj1 + ηj2 2 , ∆ηj j= ηj1 −ηj2, (1)
where η is the pseudorapidity of the physics object. The centrality of the Zγ system, ζZγ, allows discrimination between Zγ j j EWK and QCD production, with the former contributing more at low values of ζZγ. However, to maximize the statistical power of the sample, no explicit ζZγrequirement is implemented, but rather the full ζZγ distribution is used to extract the Zγ j j cross-sections, as detailed in Section6.
4.3 Selection ofν¯νγ j j events
In the neutrino channel analysis, the Z boson signature is high missing transverse momemtum from the undetected neutrino pair. Therefore, the ν¯νγ j j candidate events are required to have ETmiss> 100 GeV, which corresponds to a relative Zγ j j EWK efficiency of 85%, along with the presence of a candidate photon with EγT >150 GeV and at least two jets.
A lepton veto requirement (on the presence of electrons or muons as defined above) is applied to reduce the large contribution from W(`ν)γ+jets events. This requirement is almost 100% efficient for Zγ j j events.
Requirements on event topology are introduced to suppress the large background from γ+jets (where ~pmiss
T is usually collinear with jets) and W(eν)+jets events. This is achieved by applying a set of angular selection criteria: the azimuthal difference between ~pTmissand the total transverse momentum of the photon and the two jets should be larger than 3π/4, (∆φ(~pTmiss, γ j j) > 3π/4); the azimuthal difference between ~pmiss
T and the photon should be larger than π/2, (∆φ(~p miss
T , γ) > π/2); and the azimuthal difference between ~pTmissand each of the two jets should be larger than 1, (∆φ(~pTmiss, j) > 1). Overall, these angular separation requirements suppress the background by a factor of 40, with a relative Zγ j j EWK efficiency of 33%.
To enhance the Zγ j j EWK production and maximize the sensitivity to aQGC, further event topology selections are applied: the absolute rapidity difference between the two jets is required to be greater than 2.5 (|∆yj j| > 2.5), the photon centrality must be smaller than 0.3 (ζγ < 0.3), the pbalanceT of the ν¯νγ j j object, defined as pbalanceT ≡ |~p miss T + ~p γ T+ ~p j1 T + ~p j2 T| ETmiss+ |~pγT|+ |~pj1 T|+ |~p j2 T| , (2)
must be smaller than 0.1, and the dijet invariant mass must be greater than 600 GeV. These event topology requirements further reduce the background by a factor of 80, with a relative Zγ j j EWK efficiency of 20%. The expected number of Zγ j j EWK events after all the selection requirements is 0.65 ± 0.05.
5 Background estimate and event yields
5.1 Backgrounds in the charged-lepton channelsThe main background to the Zγ j j production processes comes from the misidentification of hadronic jets as photons (jets faking photons) in Z+jets events. This background is not well modelled by the MC simulation. It is estimated with data using the same two-dimensional sideband method [43] used in the inclusive Zγ cross-section measurement [9]. The method is based on control regions populated by events satisfying all selection criteria but with the candidate photon failing to satisfy some of the identification criteria and/or the isolation requirement.
requirement to mj j > 100 GeV. This is the most stringent requirement on mj j where the uncer-tainty on the background estimated is still dominated by systematic errors. The extrapolation of the background estimate to the search and control regions relies on the observation that the shape of the mj j distribution of Z+jets background events (i.e. with one jet faking a photon) in both the Powheg and Alpgen MC samples is similar to the mj j distribution of Zγ events in Sherpa MC samples, for mj j > 100 GeV. Therefore, the ratio of Z+jets to Zγ contribution can be considered the same in the enlarged phase-space region as in the search and control regions.
In the enlarged phase-space region (mj j > 100 GeV), the contribution from Z+jets events is estimated with data to be (23 ± 6)% of Zγ events. The uncertainty is dominated by the systematic uncertainty due to the correlation between photon identification and isolation requirements. This correlation is calculated from MC simulation and the large systematic uncertainty reflects the different responses from Sherpa , Pythia and Alpgen modelling. Other systematic uncertainties related to control region definition, signal contamination in control regions, and mj j shape difference between Z+jets and Zγ are found to be negligible compared to the normalization uncertainty and are neglected.
Besides the Z+jets process, other background contributions are from WZ+jets events, with a misiden-tification of an electron as a photon, and t¯tγ events, with the photon emitted from initial-state partons or final-state leptons. The yields of these two processes are estimated from MC simulation with an uncertainty determined by the measured cross-sections uncertainty.
5.2 Backgrounds in the neutrino channel
For the neutrino channel, background events mainly arise from processes having final states similar to the signal, from events with jets or electrons misidentified as photons, and from events with high fake ETmiss(i.e. due to mismeasurement of hadronic energy deposits rather than the presence of neutrinos in the events). The main background processes are W(`ν)γ+jets, Z(ν¯ν)+jets, γ+jets and W(eν)+jets accounting for approximately 59%, 15%, 7%, and 5% of the total background, respectively.
The dominant background is W(`ν)γ+jets production, where the lepton is either not reconstructed or not identified, making the lepton veto requirement ineffective. In particular, W(τν)γ+jets events, with τ → hadrons+ ν decays, provide a considerable contribution to this background. The Wγ+jets background, which includes both the QCD and EWK components, is estimated using the Sherpa MC samples. The normalization is determined with data. The MC yield of W(`ν)γ+jets events is corrected by constructing a data sample from events passing the ν¯νγ j j inclusive selection and requiring exactly one charged lepton in the event (instead of vetoing them). The fraction of Wγ events in this sample is about 80%, and these data events (after subtracting non-Wγ contributions from MC estimates) are used to determine a correction factor for the MC yield of the Wγ+jets sample, which is found to be 1.06. The difference between the background estimates extracted from Sherpa and Alpgen MC samples is the dominant systematic uncertainty in the Wγ+jets background prediction, corresponding to a relative uncertainty of 41%.
The second largest source of background comes from Z(ν¯ν)+jets, where a jet is misidentified as an energetic photon. The contribution of this background is estimated with the same two-dimensional sideband method used to determine the Z+jets contribution in the charged-lepton channel. In this case,
Another important source of background is the production of γ+jets events with fake ETmiss. This back-ground is estimated with data, again using a two-dimensional sideband method. The control regions are composed of events with low ETmissand/or with low values of ∆φ(~pTmiss, j). Due to the limited size of the data sample, the background estimate is performed with a relaxed energy requirement on the photon (EγT>45 GeV) and then extrapolated to the phase-space region of interest using MC samples. The difference between the extrapolation results obtained with Sherpa and Alpgen samples (∼40%) is the dominant uncertainty for this background.
The sizeable production of W(eν)+jets is also a source of background when the electron is misidenti-fied as a high-energy photon. To estimate this background, first the fake rate of e → γ misidentification is extracted from data using electrons from Z → ee events. Then the W(eν)+jets background contri-bution is estimated by applying this fake rate to events passing the full event selection but choosing a high-energy electron instead of a photon. The main uncertainty comes from the limited size of the control sample and equals 43%.
The background contribution from Z(ττ)γ is also estimated with MC samples and found to be less than 1%.
5.3 Expected and observed event yields
Table1summarizes the event yield for the charged-lepton channel, including details from the various signal and background processes. Three different phase-space regions are presented: inclusive Zγ + ≥ 2 jets selection, CR and SR. A breakdown of the sources of systematic uncertainty in the CR and SR is given in Table 2. Table3 summarizes the event yield for both the charged-lepton and neutrino channels in the aQGC region with systematic uncertainties summarized in Table 4. In the aQGC region, relative uncertainties in the yield in the charged-lepton channel are the same as those in the SR except for that arising from photon selection. This component is larger due to the higher value required for the photon transverse energy in the aQGC region.
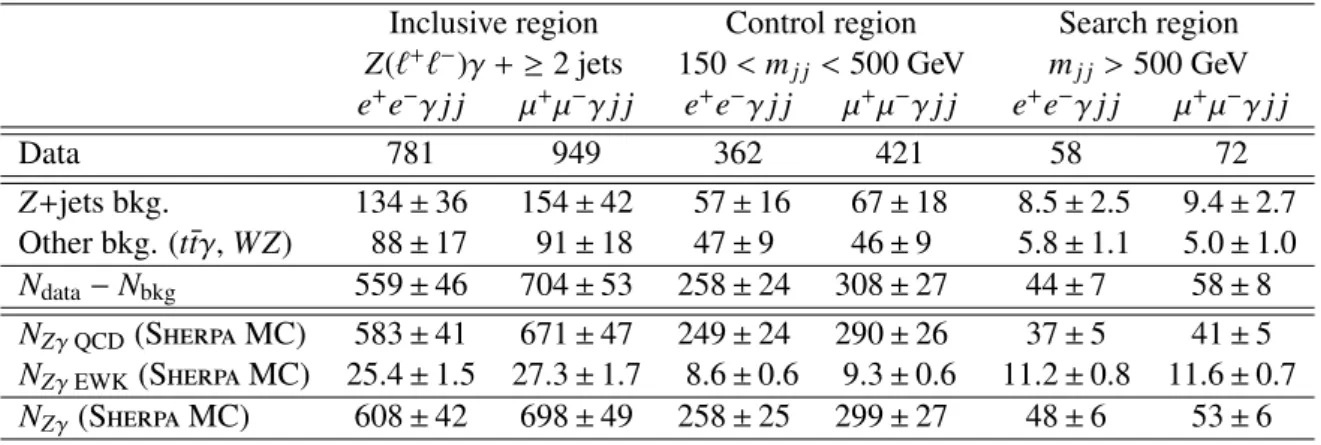
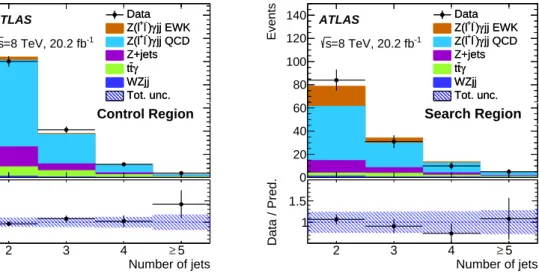
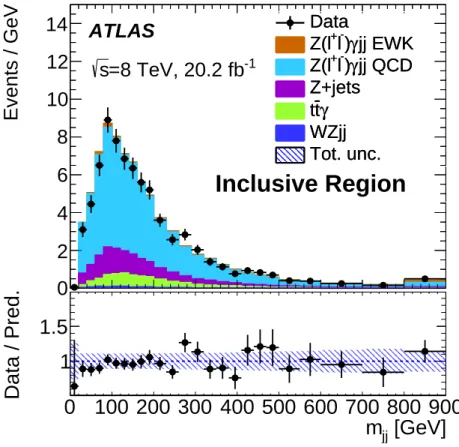
Figure2displays the transverse energy of the photon after various selection requirements (inclusive selection, control and search regions); Figure3shows the numbers of selected jets in the control and search regions; Figure4shows the distribution of the dijet mass for the inclusive selection; and finally Figure5displays the distributions of ζZγ in the inclusive, control and search regions. Corresponding kinematic distributions for the neutrino channel are shown in Figure6. The Sherpa MC prediction is found to describe the data well for all these variables and in all phase-space regions.
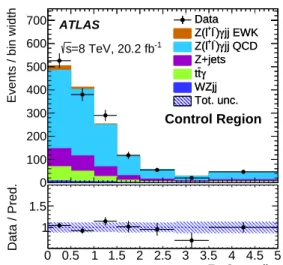
Table 1: Summary of events observed in data and estimated composition for the Z(e+e−)γ j j and Z(µ+µ−)γ j j production processes. The Z+jets contribution in this table is taken as a fixed fraction, (23±6)%, of NZγ QCD. The last line corresponds to the sum of the two previous lines (NZγ QCD+ NZγ EWK). The uncertainties correspond to the statistical and systematic uncertainties added in quadrature.
Inclusive region Control region Search region
Z(`+`−)γ+ ≥ 2 jets 150 < mj j < 500 GeV mj j > 500 GeV e+e−γ j j µ+µ−γ j j e+e−γ j j µ+µ−γ j j e+e−γ j j µ+µ−γ j j Data 781 949 362 421 58 72 Z+jets bkg. 134 ± 36 154 ± 42 57 ± 16 67 ± 18 8.5 ± 2.5 9.4 ± 2.7 Other bkg. (t¯tγ, WZ) 88 ± 17 91 ± 18 47 ± 9 46 ± 9 5.8 ± 1.1 5.0 ± 1.0 Ndata− Nbkg 559 ± 46 704 ± 53 258 ± 24 308 ± 27 44 ± 7 58 ± 8 NZγ QCD(Sherpa MC) 583 ± 41 671 ± 47 249 ± 24 290 ± 26 37 ± 5 41 ± 5 NZγ EWK(Sherpa MC) 25.4 ± 1.5 27.3 ± 1.7 8.6 ± 0.6 9.3 ± 0.6 11.2 ± 0.8 11.6 ± 0.7 NZγ(Sherpa MC) 608 ± 42 698 ± 49 258 ± 25 299 ± 27 48 ± 6 53 ± 6
Table 2: Summary of the dominant experimental systematic uncertainties in the event yield in the CR and SR, for the electron (muon when different) channel and for the signal and main background components.
Source of EWK yield [%] QCD yield [%] Bkg. yield [%]
uncertainty CR SR CR SR CR SR Trigger 0.2 (0.4) Pile-up 0.6 Lepton selection 3.8 (2.3) Photon selection 1.6 Jet reconstruction 1.1 2.5 5.0 12 4.9 12 Bkg. 2D sideband - - - - 26 26 Total experimental 4.3 (3.1) 4.9 (3.8) 6.5 (5.8) 13 (12) 27 (27) 29 (29) Theory 5.2 8.7 5.6 3.8 5.6 3.8
Table 3: Summary of events observed in data and estimated composition of the background for the Z(``)γ j j and Z(ν¯ν)γ j j production processes in the aQGC region. The last line corresponds to the sum of the two previous lines (NZγ QCD+ NZγ EWK). The quoted uncertainty corresponds to the total statistical plus systematic uncertainty added in quadrature. aQGC region mj j > 500 GeV mj j> 600 GeV EγT> 250 GeV EγT> 150 GeV `+`−γ j j ν¯νγ j j Data 2 4 Z+jets background 0.28 ± 0.08 0.3 ± 0.2 W(`ν)γ+jets background - 1.1 ± 0.5 γ+jets background - 0.13 ± 0.08
W(eν)+jets background - 0.09 ± 0.04
t¯tγ, WZ background 0.02 ± 0.01
-Ndata− Nbkg 1.7 ± 1.4 2.4 ± 2.0
NZγ QCD(Sherpa MC) 1.2 ± 0.4 0.29 ± 0.07
NZγ EWK(Sherpa MC) 0.41 ± 0.04 0.65 ± 0.05
NZγ(Sherpa MC) 1.6 ± 0.4 0.9 ± 0.1
Table 4: Summary of the main relative uncertainties in the MC-based EWK and QCD yields for the electron (muon when different) and neutrino channels in the aQGC region. The uncertainties in the Z+jets, W(`ν)γ+jets, γ+jets, and W(eν)+jets yields, estimated with data, are detailed in the text.
Source of EWK yield [%] QCD yield [%]
uncertainty `+`−channel ν¯ν channel `+`−channel ν¯ν channel
Trigger 0.2 (0.4) 2 0.2 (0.4) 2 Pile-up 0.6 Lepton selection 3.8 (2.3) - 3.8 (2.3) -ETmissreconstruction - 0.4 - 0.4 Photon selection 6.5 3.3 6.5 3.3 Jet reconstruction 2.5 3.2 12 3.2 Total experimental 8.0 (7.4) 5.1 13 5.1 Theory 8.7 4.1 3.8 4.1
Events / GeV 0 10 20 30 40 50 60 70 Inclusive Region Data jj EWK γ ) -l + Z(l jj QCD γ ) -l + Z(l Z+jets γ t t WZjj Tot. unc. -1 =8 TeV, 20.2 fb s ATLAS Data jj EWK γ ) -l + Z(l jj QCD γ ) -l + Z(l Z+jets γ t t WZjj Tot. unc. [GeV] γ T E 50 100 150 200 250 300 Data / Pred. 1 1.5 Events / GeV 0 5 10 15 20 25 30 35 Control Region Data jj EWK γ ) -l + Z(l jj QCD γ ) -l + Z(l Z+jets γ t t WZjj Tot. unc. -1 =8 TeV, 20.2 fb s ATLAS Data jj EWK γ ) -l + Z(l jj QCD γ ) -l + Z(l Z+jets γ t t WZjj Tot. unc. [GeV] γ T E 50 100 150 200 250 300 Data / Pred. 1 1.5 Events / GeV 0 0.5 1 1.5 2 2.5 3 3.5 4 4.5 5 Search Region Data jj EWK γ ) -l + Z(l jj QCD γ ) -l + Z(l Z+jets γ t t WZjj Tot. unc. -1 =8 TeV, 20.2 fb s ATLAS Data jj EWK γ ) -l + Z(l jj QCD γ ) -l + Z(l Z+jets γ t t WZjj Tot. unc. [GeV] γ T E 50 100 150 200 250 300 Data / Pred. 1 1.5
Figure 2: Distributions of the photon transverse energy for the electron and muon channels added together in the inclusive region (top left), in the control region (top right) and in the search region (bottom), for the data (black points), and for the signal process and various background components (coloured templates) before any fit is done. The ratio of the data to the sum of all pre-fit expected contributions (“Pred.”) is shown below each histogram. The hatched blue band shows the systematic and statistical uncertainty added in quadrature (“Tot. unc.”) in the signal and background prediction, while the error bars on the data points represent the statistical uncertainty of the data set. The number of events in each bin is divided by the bin width. The last bin also includes events beyond the range shown.
Events 0 100 200 300 400 500 600 700 Control Region Data jj EWK γ ) -l + Z(l jj QCD γ ) -l + Z(l Z+jets γ t t WZjj Tot. unc. -1 =8 TeV, 20.2 fb s ATLAS Data jj EWK γ ) -l + Z(l jj QCD γ ) -l + Z(l Z+jets γ t t WZjj Tot. unc. Number of jets 2 3 4 5 Data / Pred. 1 1.5 ≥ Events 0 20 40 60 80 100 120 140 Search Region Data jj EWK γ ) -l + Z(l jj QCD γ ) -l + Z(l Z+jets γ t t WZjj Tot. unc. -1 =8 TeV, 20.2 fb s ATLAS Data jj EWK γ ) -l + Z(l jj QCD γ ) -l + Z(l Z+jets γ t t WZjj Tot. unc. Number of jets 2 3 4 5 Data / Pred. 1 1.5 ≥
Figure 3: Distributions of the number of jets passing the selection for the electron and muon channels added together in the control region (left) and in the search region (right), for the data (black points), and for the signal process and various background components (coloured templates) before any fit is done. The ratio of the data to the sum of all pre-fit expected contributions (“Pred.”) is shown below each histogram. The hatched blue band shows the systematic and statistical uncertainty added in quadrature (“Tot. unc.”) in the signal and background prediction, while the error bars on the data points represent the statistical uncertainty of the data set. The last bin also includes events beyond the range shown.
Events / GeV
0
2
4
6
8
10
12
14
Inclusive Region
Data
jj EWK
γ
)
-l
+Z(l
jj QCD
γ
)
-l
+Z(l
Z+jets
γ
t
t
WZjj
Tot. unc.
-1=8 TeV, 20.2 fb
s
ATLAS
Data
jj EWK
γ
)
-l
+Z(l
jj QCD
γ
)
-l
+Z(l
Z+jets
γ
t
t
WZjj
Tot. unc.
[GeV]
jjm
0 100 200 300 400 500 600 700 800 900
Data / Pred.
1
1.5
Figure 4: Distributions of the dijet invariant mass of the two leading jets for the electron and muon channels added together in the inclusive region, for the data (black points), and for the signal process and various back-ground components (coloured templates) before any fit is done. The ratio of the data to the sum of all pre-fit expected contributions (“Pred.”) is shown below the histogram. The hatched blue band shows the systematic and statistical uncertainty added in quadrature (“Tot. unc.”) in the signal and background prediction, while the error bars on the data points represent the statistical uncertainty of the data set. The number of events in each bin is divided by the bin width. The last bin also includes events beyond the range shown.
Events / bin width 0 200 400 600 800 1000 1200 1400 Inclusive Region Data jj EWK γ ) -l + Z(l jj QCD γ ) -l + Z(l Z+jets γ t t WZjj Tot. unc. -1 =8 TeV, 20.2 fb s ATLAS Data jj EWK γ ) -l + Z(l jj QCD γ ) -l + Z(l Z+jets γ t t WZjj Tot. unc. Centrality γ Z 0 0.5 1 1.5 2 2.5 3 3.5 4 4.5 5 Data / Pred. 1 1.5
Events / bin width
0 100 200 300 400 500 600 700 Control Region Data jj EWK γ ) -l + Z(l jj QCD γ ) -l + Z(l Z+jets γ t t WZjj Tot. unc. -1 =8 TeV, 20.2 fb s ATLAS Data jj EWK γ ) -l + Z(l jj QCD γ ) -l + Z(l Z+jets γ t t WZjj Tot. unc. Centrality γ Z 0 0.5 1 1.5 2 2.5 3 3.5 4 4.5 5 Data / Pred. 1 1.5
Events / bin width
0 50 100 150 200 250 Search Region Data jj EWK γ ) -l + Z(l jj QCD γ ) -l + Z(l Z+jets γ t t WZjj Tot. unc. -1 =8 TeV, 20.2 fb s ATLAS Data jj EWK γ ) -l + Z(l jj QCD γ ) -l + Z(l Z+jets γ t t WZjj Tot. unc. Centrality γ Z 0 0.5 1 1.5 2 2.5 3 3.5 4 4.5 5 Data / Pred. 1 1.5
Figure 5: Distributions of centrality of the Zγ system, ζZγ, for the electron and muon channels added together in the inclusive region (top left), in the control region (top right) and in the search region (bottom), for the data (black points), and for the signal process and various background components (coloured templates) before any fit is done. The ratio of the data to the sum of all pre-fit expected contribution (“Pred.”) is shown below each histogram. The hatched blue band shows the systematic and statistical uncertainty added in quadrature (“Tot. unc.”) in the signal and background prediction, while the error bars on the data points represent the statistical uncertainty of the data set. The number of events in each bin is divided by the bin width. The last bin also includes events beyond the range shown.
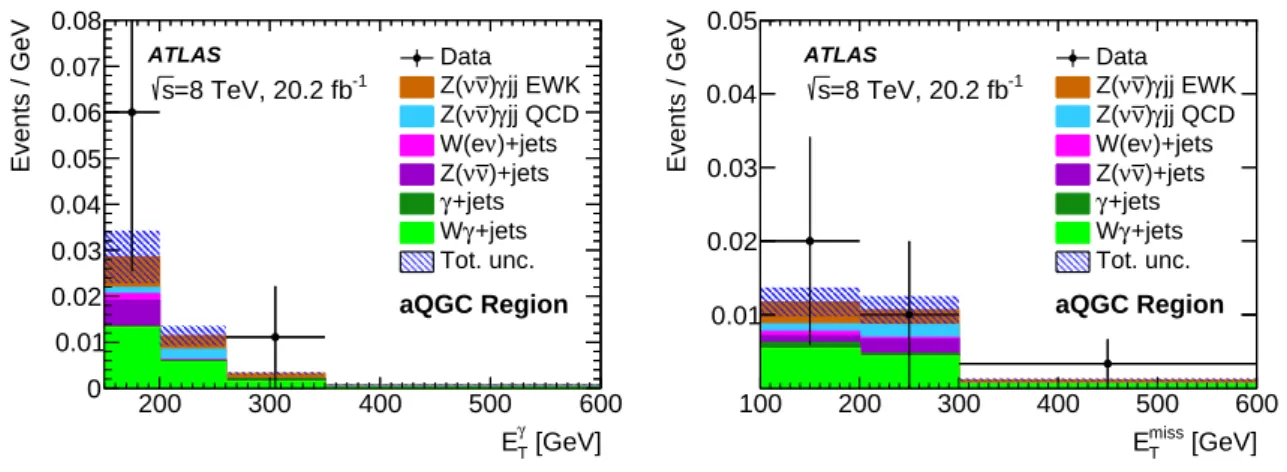
[GeV] γ T E 200 300 400 500 600 Events / GeV 0 0.01 0.02 0.03 0.04 0.05 0.06 0.07 0.08 Data jj EWK γ ) ν ν Z( jj QCD γ ) ν ν Z( )+jets ν W(e )+jets ν ν Z( +jets γ +jets γ W Tot. unc. aQGC Region -1 =8 TeV, 20.2 fb s ATLAS [GeV] miss T E 100 200 300 400 500 600 Events / GeV 0.01 0.02 0.03 0.04 0.05 Data jj EWK γ ) ν ν Z( jj QCD γ ) ν ν Z( )+jets ν W(e )+jets ν ν Z( +jets γ +jets γ W Tot. unc. aQGC Region -1 =8 TeV, 20.2 fb s ATLAS
Figure 6: Distributions of the photon transverse energy ETγ(left) and Emiss
T (right) for the neutrino channel in the aQGC region with ETγ ≥ 150 GeV for the data (black points), and for the signal process and various background components (coloured templates). The hatched blue band shows the systematic and statistical uncertainty added in quadrature (“Tot. unc.”) in the signal and background prediction, while the error bars on the data points represent the statistical uncertainty of the data set. The number of events in each bin is divided by the bin width. The last bin also includes events beyond the range shown.
6 Fiducial Zγ j j cross-section measurements in the charged-lepton
channel
In this section, the extraction of the Zγ j j EWK production cross-section in the SR of the charged-lepton channel along with the Zγ j j total (EWK+QCD) production cross-section in both the search and control regions of the charged-lepton channel is reported. Given the very limited number of signal events expected after the ν¯νγ j j selection, that topology is only used in the search for anomalous quartic couplings described in Section7.
Fiducial regions are defined at the particle level, using stable particles — those with proper lifetime longer than 10 ps — before their interaction with the detector. Prompt lepton four-momenta — not from hadron or τ decays — are obtained through a four-vector sum of leptons with radiated photons within a cone of radius∆R = 0.1 around the leptons (“dressed leptons”). Jets are reconstructed with the anti-ktjet reconstruction algorithm with radius parameter R= 0.4 using stable particles, excluding muons and neutrinos. The photon isolation energy is taken as the energy of the jet matching the photon (∆R( j, γ) < 0.3), with the photon energy subtracted. These fiducial phase-space regions where the measurements are performed are defined to be as close as possible to the experimental phase-space regions, corresponding to the reconstructed-event selection described in Section4. This minimizes the extrapolation to the particle-level phase space by the MC simulation. Table5summarizes the selection that are applied to obtain the various fiducial regions. The fraction of events in the SR fiducial region passing the reconstructed event selection is about 94% for the charged-lepton channel.
The parton-level selection, used to calculate the predicted cross-section with the Vbfnlo MC event generator, is basically identical to the particle-level selection described above, with jet selection re-quirements directly applied to the outgoing partons.
In order to compare the measured fiducial cross-section (at particle level) with the NLO theory predic-tions by Vbfnlo (at parton level) [48], a correction factor Apartonis derived. Such a correction accounts for differences between the parton- and particle-level phase-space regions. It is defined as the ratio of the number of generated events in the parton-level phase-space region to the number of events in the particle-level phase-space region, and it depends on fragmentation and hadronization models imple-mented in MC event generators. Using the Zγ j j EWK Sherpa MC simulation, Apartonis found to be 1.02 and 0.86 for the CR and SR respectively (with negligible statistical uncertainty).
6.1 Fiducial electroweak production cross-section determination
The determination of the fiducial cross-section is carried out using the signal strength parameter µ µ = N signal data NMCsignal = σdata σMC , (3)
where Ndatasignalis the signal yield in the data and NMCsignalis the number of signal events predicted by the Sherpa MC simulation, with selection efficiencies extracted from data. The measured cross-section σdatais derived from the signal strength by multiplying it by the Sherpa MC cross-section prediction
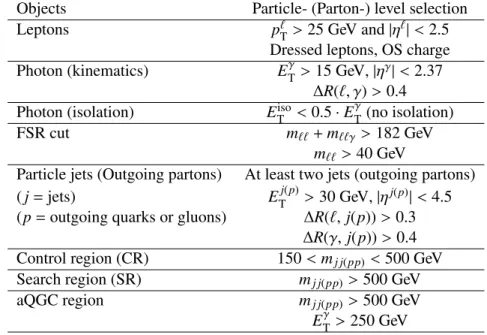
Table 5: Charged-lepton channel phase-space region definitions at particle level (parton level when different) for both pp → Zγ j j EWK and QCD production. If there are more than two jets/final-state partons, the two highest transverse momentum ones are considered.
Objects Particle- (Parton-) level selection
Leptons p`T > 25 GeV and |η`|< 2.5
Dressed leptons, OS charge Photon (kinematics) EγT > 15 GeV, |ηγ|< 2.37
∆R(`, γ) > 0.4 Photon (isolation) ETiso< 0.5 · ETγ (no isolation)
FSR cut m``+ m``γ> 182 GeV
m`` > 40 GeV
Particle jets (Outgoing partons) At least two jets (outgoing partons) ( j= jets) ETj(p)> 30 GeV, |ηj(p)|< 4.5 (p= outgoing quarks or gluons) ∆R(`, j(p)) > 0.3
∆R(γ, j(p)) > 0.4 Control region (CR) 150 < mj j(pp)< 500 GeV
Search region (SR) mj j(pp)> 500 GeV
aQGC region mj j(pp)> 500 GeV
EγT > 250 GeV
The signal strength is extracted using a likelihood fit over the centrality of the Zγ two-body system, ζZγ(see Equation (1) and Figure5), which provides good discrimination between the EWK and QCD production processes. Probability density functions are built [49] from binned histograms of ζZγ dis-tributions (referred to as templates) using MC events for signal and each of the backgrounds described in Section5. The interference between the EWK and QCD induced processes is not included in the probability density functions but rather taken as an uncertainty (∼ 7% of the signal yield, determined with Sherpa MC samples).
An extended likelihood is built from the product of four likelihoods corresponding to ζZγdistributions in the SR and CR for the electron channel and the SR and CR for the muon channel. The inclusion of the CR likelihoods in the fit (where the EWK signal process is suppressed) provides a strong constraint on the QCD process normalization in the SR. The QCD normalization is introduced in the likelihood as a single parameter for both the CR and the SR. It is treated as an unconstrained nuisance parameter and mainly determined by the data in the CR, where events from the QCD process dominate. The normalizations and shapes of the other backgrounds are taken from MC predictions and can vary within the uncertainties reported in Section5.
The signal strength for the EWK production, µEWK, and its uncertainty are determined with a profile-likelihood-ratio test statistic [50]. Systematic uncertainties in the input templates are handled using nuisance parameters corresponding to each systematic effect, which are assumed to have Gaussian dis-tributions with standard deviation σ equal to the systematic uncertainty in the parameter in question. The profile of the negative log-likelihood ratio of the signal strength µEWKis shown in Figure7. From the best-fit value of µ , the observed Zγ j j EWK production fiducial cross-section in the SR
EWK µ 0 0.5 1 1.5 2 2.5 3 3.5 4 λ - log 0 0.5 1 1.5 2 2.5 3 3.5 ATLAS -1 =8 TeV, 20.2 fb s
With syst. unc.
Without syst. unc.
Figure 7: The profile of the negative log-likelihood ratio λ(µEWK) of the signal strength µEWKof the ζZγtemplate. The observed result is shown by the solid curve, while the dashed curve shows the results with only the statistical uncertainty included. The observed significance of the measurement is given by p−2 log λ(0) and equals 2.0σ in this case.
Table 6: Summary of the main relative uncertainties in cross-section measurements presented in this paper.
Source of EWK [%] Total (EWK+QCD) [%]
uncertainty SR CR
Statistical 40 9 4
Jet energy scale 36 9 4
Theory 10 5 4
All other 8 5 6
Total systematic 38 11 8
while the SM NLO prediction [48] from Vbfnlo, after applying the Apartoncorrection described above, and with uncertainties calculated as described in Section3, is
σVbfnlo,EWK
Zγ j j = 0.94 ± 0.09 fb.
The significance of the observed EWK production signal is 2.0σ (1.8σ expected), not large enough to claim an observation of this process. The measured 95% confidence level (CL) cross-section upper limit obtained with the CLS technique [50] is 2.2 fb. A breakdown of the uncertainties of the σEWKZγ j j cross-section measurement, as well as the total (EWK+QCD) cross-sections discussed in the next section, is given in Table6.
The statistical uncertainty of the measurement of σEWKZγ j j is 40%. The 38% systematic uncertainty is dominated by the 36% jet energy scale (JES) uncertainty contribution. In particular, the contribution of the uncertainty in the η-intercalibration method of the JES is quite large, since events at low ζZγ tend to have jets with high rapidity. This uncertainty strongly affects both the normalization and the
uncertainties by different amounts. As a consequence, the constraint from CR data is not as effective in reducing the JES uncertainty as it is for other systematic uncertainties. Nonetheless, the use of the CR data reduces the total systematic uncertainty of the EWK cross-section measurement in the SR from about 60% to 38%.
The second largest contribution to the systematic uncertainty is from the theory uncertainty (Sherpa modelling of the Zγ j j production processes and interference between the QCD and EWK processes) and amounts to 10%, while all other contributions combined (photon and lepton identification, recon-struction, isolation and energy scale, and uncertainty from the Z+jet background estimate) are around 8%.
The post-fit QCD production normalization is found to be in agreement with the Sherpa predictions within one standard deviation. Cross-sections extracted separately in the electron and muon channels are also compatible within their statistical uncertainty.
6.2 Total Zγ j j fiducial cross-section measurements
The total Zγ j j production (QCD+EWK) cross-section in the SR and CR is extracted from data with a slight modification of the template fit method described in Section6.1. In this case both the EWK and QCD Zγ j j production are considered as signal. As a consequence a unique signal strength µZγ j j for the total QCD and EWK production is used, and hence the relative ratio of QCD and EWK contri-butions are fixed to the Sherpa MC predicted value. The SR and CR phase-space regions are treated independently and µZγ j j is not assumed to be the same in the two regions. As before, ζZγ templates are taken from the separate Sherpa MC samples of the EWK and QCD production.
EWK–QCD interference is negligible with respect to the total production and is not considered. From the best-fit value of µZγ j j, the measured total Zγ j j production cross-section in the SR and CR is found to be:
σSR
Zγ j j= 3.4 ± 0.3 (stat) ± 0.4 (syst) fb = 3.4 ± 0.5 fb, σCR
Zγ j j= 21.9 ± 0.9 (stat) ± 1.8 (syst) fb = 21.9 ± 2.0 fb.
The cross-sections measured separately in the electron and muon channels are compatible within their statistical uncertainty.
In both measurements, the systematic uncertainty (11% and 8% in the SR and CR respectively) dom-inates over the statistical uncertainty (9% and 4% in the SR and CR respectively). A summary of the main sources of systematic uncertainty is given in Table6.
The total Zγ j j cross-section predictions at QCD NLO [48] are derived adding the individual Vbfnlo QCD and EWK production predictions with uncertainties calculated as described in Section3. They are found to be:
σVbfnlo,SR
These predictions include Aparton corrections derived from Sherpa MC samples reported before for EWK production as well as Apartoncorrections for QCD production, which are 0.76 and 0.82 in the CR and SR respectively, with negligible statistical uncertainty.
A summary of the Zγ j j production cross-section measurements in the charged-lepton channel is given in Table7. In both the SR and CR, and for both electroweak Zγ j j and total Zγ j j production, the Vbfnlo MC predictions describe the data well.
Table 7: Summary of Zγ j j production cross-section measurements in the search and control regions for the charged-lepton channel.
Channel Phase-space Process Measured Predicted
region type cross-section [fb] cross-section [fb]
Z(`+`−)γ j j Search region EWK 1.1 ± 0.5 (stat) ± 0.4 (syst) 0.94 ± 0.09 Z(`+`−)γ j j Search region EWK+QCD 3.4 ± 0.3 (stat) ± 0.4 (syst) 4.0 ± 0.4 Z(`+`−)γ j j Control region EWK+QCD 21.9 ± 0.9 (stat) ± 1.8 (syst) 22.9 ± 1.9
7 Limits on quartic gauge-boson couplings
Since QGCs contribute to VBS processes in the SM, the Zγ j j EWK production, which contains VBS processes, can be used to probe new physics via anomalies in the extracted coupling values. Zγ j j EWK production in the SM has no contributions at the tree level from the neutral QGCs of ZZZγ, ZZγγ and Zγγγ which consist of only the vector bosons with zero electric charges, but does con-tain the charged QGC WWZγ vertex with the presence of charged vector bosons in the couplings. New physics beyond the SM could induce charged and neutral anomalous QGCs, enhancing the Zγ j j electroweak production cross-section and modifying the kinematic distributions of the final-state bo-sons.
In this section, events selected in the neutrino channel and in the “aQGC region” for the charged-lepton channel are used to probe aQGC contributions to the Zγ j j EWK production, whose relative size is expected to increase with the photon transverse energy. Optimization studies performed on MC samples show that the selection of events with ETγ > 250 GeV (ETγ > 150 GeV) for the charged-lepton (neutrino) channel maximizes the sensitivity to aQGC contributions for the available amount of data. Figures8and 9 show the photon transverse energy distribution in the charged-lepton and neutrino channel, respectively, for the data as well as the expected signal and backgrounds, along with one possible aQGC contribution.
7.1 Fiducial EWK production cross-section limits in high-Eγ
Tregions
In this section, limits on the fiducial cross-section of Zγ j j EWK production in the charged-lepton and neutrino channels in the high-EγT energy region dedicated to aQGC studies are reported. The fiducial phase-space region definition for the neutrino (charged-lepton) channel is provided in Table8
Events / GeV 2 − 10 1 − 10 1 10 2 10 Search Region Data jj EWK γ ) -l + Z(l jj QCD γ ) -l + Z(l Z+jets γ t t WZjj Tot. unc. ∞ = FF Λ , -4 = -352 TeV 4 Λ / M0 f -1 =8 TeV, 20.2 fb s ATLAS Data jj EWK γ ) -l + Z(l jj QCD γ ) -l + Z(l Z+jets γ t t WZjj Tot. unc. [GeV] γ T E 50 100 150 200 250 300 350 400 450 500 Data / Pred. 1 1.5
Figure 8: Distributions of the photon transverse energy for the electron and muon channels added together in the search region, for the data (black points), and for the signal process and various background components (coloured templates) before any fit is done. The sum of the signal prediction with one non-zero aQGC parameter and the various backgrounds discussed in the text is also shown (blue dashed line). The ratio between data and the sum of all pre-fit expected contributions (“Pred.”) is shown below the histogram. The hatched blue band shows the systematic and statistical uncertainty added in quadrature (“Tot. unc.”) in the signal and background prediction, while the error bars on the data points represent the statistical uncertainty of the data set. The number of events in each bin is divided by the bin width. The last bin also includes events beyond the range shown.
For both channels, cross-sections are extracted from data using a log-likelihood fit method, where the likelihood function is constructed from a Poisson distribution for the expected number of signal and background events in the aQGC region and Gaussian constraints for nuisance parameters associated with systematic uncertainties. These systematic uncertainties are summarized in Table4.
The Zγ j j EWK cross-sections predicted by the SM in these high-ETγ fiducial regions are very small: (71 ± 7) ab and (17 ± 2) ab for the neutrino and charged-lepton channels, respectively. Therefore, with 20.2 fb−1of data only cross-section upper limits are extracted.
Using the Sherpa MC simulation, reconstruction efficiencies, defined as the number of reconstructed MC events passing the event selection divided by the number of generated events at particle level within the fiducial region, are found to be Cν¯νγ j jEWK = 0.54±0.03 and C`+`
−γ j j
EWK = 0.56±0.03. These factors account for photon and lepton reconstruction, identification, isolation, trigger and jet identification efficiencies and related systematic uncertainties.
[GeV] γ T E 200 300 400 500 600 Events / GeV 3 − 10 2 − 10 1 − 10 1 Data jj EWK γ ) ν ν Z( jj QCD γ ) ν ν Z( )+jets ν W(e )+jets ν ν Z( +jets γ +jets γ W Tot. unc. aQGC Region , -4 =117 TeV 4 Λ / M0 f ∞ = FF Λ -1 =8 TeV, 20.2 fb s ATLAS
Figure 9: Distributions of the photon transverse energy for the neutrino channel in the aQGC region, for the data (black points), and for the signal process and various background components (coloured templates). The sum of the signal prediction with one non-zero aQGC parameter and the various backgrounds discussed in the text is also shown (blue dashed line). The hatched blue band shows the systematic and statistical uncertainty added in quadrature (“Tot. unc.”) in the signal and background prediction, while the error bars on the data points represent the statistical uncertainty of the data set. The number of events in each bin is divided by the bin width. The last bin also includes events beyond the range shown.
Table 8: Neutrino channel aQGC region definition at particle (parton) level. If there are more than two jets at particle level, the two highest transverse momentum ones are considered.
Objects Particle- (Parton-) level selection
Neutrinos ETν¯ν> 100 GeV
Photon (kinematics) ETγ > 150 GeV, |ηγ|< 2.37 ∆R(`, γ) > 0.4
Photon (isolation) ETiso< 0.5 · EγT
Generator-level jets (Outgoing quarks) At least two jets (quarks)
(pp → Zγqq) ETj(q)> 30 GeV, |ηj(q)|< 4.5
∆R(γ, j(q)) > 0.4 Event kinematic |∆φ(Eν¯νT, γ j j(qq))| > 3π4
selection |∆φ(ETν¯ν, γ)| > π2 |∆φ(ETν¯ν, j(q))| > 1 ETγ > 150 GeV |∆yj j(qq)|> 2.5 ζγ< 0.3 pbalanceT < 0.1 mj j(qq)> 600 GeV
7.2 Extracting confidence intervals on anomalous quartic gauge-boson couplings.
An effective field theory (EFT) [4] with higher-dimensional operators [2] is adopted to parameterize the anomalous couplings. These operators are in the linear Higgs-doublet representation [2,3]. A parity-conserving EFT Lagrangian is constructed based on the hypothesis that the observed Higgs boson belongs to an SU(2)Ldoublet [2] and has the form
L= LSM+X i ci Λ2Oi+ X j fj Λ4Oj. (4)
The first term represents the SM lagrangian, while higher-order terms represent new physics indu-cing anomalous gauge couplings, such as the dimension-6 term (second term) and dimension-8 term (third term) with all components of each term summed up according to the dimension of the new physics scaleΛ [3, 4]. Out of these higher-order operators, the dimension-8 ones are the lowest-dimension operators inducing only quartic gauge-boson couplings without triple gauge-boson ver-tices. The dimension-8 operators with coeffcients fjare sub-categorized in fT,xoperators, containing only the field-strength tensor, and fM,xoperators, containing both the Higgs SU(2)L doublet derivat-ives and the field strength. The charged anomalous couplings of WWZγ can be induced only by the fM,x(x=0–7) and fT,x (x=0–7) operators. The neutral aQGCs of ZZZγ and ZZγγ can be induced by the fM,x(x=0–7) and fT,x(x=0–9) operators while Zγγγ QGC can be modified only by fT,x(x=0–9) operators.
Only a subset of these dimension-8 operators are probed here with events from Zγ j j EWK produc-tion: fT0/Λ4, as a representative operator of fT1/Λ4and fT2/Λ4; fT8/Λ4and fT9/Λ4, the two unique operators which can be probed only via neutral QGC vertices; and fM0/Λ4, fM1/Λ4, fM2/Λ4 and
fM3/Λ4, which allow comparisons and possible combinations with results from other experiments. Form factors (FF) must be introduced to restore unitarity at very high parton centre-of-mass energy √
ˆs: fi( ˆs) = fi/(1 + ˆs/Λ2FF)n, whereΛFF is the parameter chosen to prevent unitarity violation up to √
ˆs= 8 TeV and the FF exponent is set to n = 2.
Data in the aQGC regions, defined in Tables5and8for the charged-lepton and neutrino channels re-spectively, are used. These phase-space regions are determined by optimizing the expected confidence intervals on the dimension-8 operator coefficients in the individual channels.
MC Zγ j j EWK events with non-zero EFT dimension-8 operator coefficients are generated by Mad-Graph 5.1 [23] at LO, interfaced with Pythia 6 [51] for parton showering, and processed through the ATLAS detector full simulation, for both the charged-lepton and the neutrino channels. One MC sample is generated for each of the dimension-8 operators to study the aQGC event selection e fficien-cies. The difference with respect to the selection efficiency calculated from SM samples modelled with Sherpa is taken as an additional uncertainty of 20%(10%) for the charged-lepton (neutrino) channel analysis. The event yield from background physics processes sensitive to aQGC probed here are kept fixed to SM predictions.
Table 9: Measured and expected one-dimensional 95% confidence level intervals on aQGC parameters (in the Vbfnlo formalism) using the combination of all Zγ j j channels (charged-lepton and neutrino). The FF exponent n= 0 entries correspond to an infinite FF scale and therefore result in non-unitarized 95% CL inntervals. FF exponent n= 2 confidence intervals preserve unitarity with individual form-factor scales as shown in the last column for each dimension-8 operator. The maximum allowed form-factor valuesΛFFare chosen, according to the unitarity bounds calculated by Vbfnlo and are also reported in this table. The latest NLO cross-section prediction of Vbfnlo is used in the aQGC parameterization. [48]
95% CL intervals Measured [TeV−4] Expected [TeV−4] ΛFF[TeV]
n= 0 fT9/Λ4 [−4.1, 4.2] × 103 [−2.9, 3.0] × 103 fT8/Λ4 [−1.9, 2.1] × 103 [−1.2, 1.7] × 103 fT0/Λ4 [−1.9, 1.6] × 101 [−1.6, 1.3] × 101 fM0/Λ4 [−1.6, 1.8] × 102 [−1.4, 1.5] × 102 fM1/Λ4 [−3.5, 3.4] × 102 [−3.0, 2.9] × 102 fM2/Λ4 [−8.9, 8.9] × 102 [−7.5, 7.5] × 102 fM3/Λ4 [−1.7, 1.7] × 103 [−1.4, 1.4] × 103 n= 2 fT9/Λ4 [−6.9, 6.9] × 104 [−5.4, 5.3] × 104 0.7 fT8/Λ4 [−3.4, 3.3] × 104 [−2.6, 2.5] × 104 0.7 fT0/Λ4 [−7.2, 6.1] × 101 [−6.1, 5.0] × 101 1.7 fM0/Λ4 [−1.0, 1.0] × 103 [−8.8, 8.8] × 102 1.0 fM1/Λ4 [−1.6, 1.7] × 103 [−1.4, 1.4] × 103 1.2 fM2/Λ4 [−1.1, 1.1] × 104 [−9.2, 9.6] × 103 0.7 fM3/Λ4 [−1.6, 1.6] × 104 [−1.4, 1.3] × 104 0.8
For both channels, a one-dimensional profile-likelihood fit is used to derive the expected and observed 95% CL intervals of each dimension-8 operator coefficient, with all the other operator coefficients set to zero. The neutrino channel provides the best expected intervals for all operators. However, they are improved by 10–30% when the results from both channels are combined. The channel combination is obtained taking into account correlations between systematic uncertainties. In particular, the sys-tematic uncertainties of the photon identification efficiency, uncertainties due to the jet energy scale and resolution, PDF uncertainties, uncertainties in parton-shower modelling, and the systematics of QCD renormalization and factorization scales are considered as correlated. Among these systematic uncertainties, the QCD renormalization and factorization scale uncertainties are the leading ones, and are 8.0% (7.7%) in the charged-lepton (neutrino) channel.
Table9shows the expected and observed 95% CL intervals derived with theΛFF set to the maximum allowed value to preserve unitarity, according to the Vbfnlo calculation. The expected and observed 95% CL intervals derived without respecting the unitarity bounds (n= 0) and without other unitariz-ation restrictions are also reported in Table9.
8 Conclusions
Studies of electroweak production of a Z boson and a photon in association with a high-mass dijet system, with the Z boson decaying into a pair of either electrons, muons, or neutrinos, have been performed using 20.2 fb−1of proton–proton collision data at √s = 8 TeV collected by the ATLAS experiment at the LHC.
In the charged-lepton channel, the Zγ j j EWK production cross-section in a fiducial region with a signal purity of about 18% is found to be:
σEWK
Zγ j j = 1.1 ± 0.6 fb,
which is consistent with the NLO SM prediction from Vbfnlo, and corresponds to a significance of 2σ. The total Zγ j j production cross-section is also measured in the same fiducial region and in a phase-space region dominated by QCD production and both are found to be in good agreement with the NLO SM predictions from Vbfnlo.
Events with high-ET photons in both the charged-lepton and neutrino decay modes of the Z boson are used to extract confidence intervals on seven different aQGC parameters modelled by dimension-8 operators of an effective field theory. In both channels, 95% CL upper limits on the SM Zγ j j EWK production cross-sections are placed in these high-ET photon phase-space regions. The 95% CL intervals on the aQGC parameters are competitive or even more stringent than previous constraints obtained with events with Zγ j j and different final states.
Acknowledgements
We thank CERN for the very successful operation of the LHC, as well as the support staff from our institutions without whom ATLAS could not be operated efficiently.
We acknowledge the support of ANPCyT, Argentina; YerPhI, Armenia; ARC, Australia; BMWFW and FWF, Austria; ANAS, Azerbaijan; SSTC, Belarus; CNPq and FAPESP, Brazil; NSERC, NRC and CFI, Canada; CERN; CONICYT, Chile; CAS, MOST and NSFC, China; COLCIENCIAS, Colombia; MSMT CR, MPO CR and VSC CR, Czech Republic; DNRF and DNSRC, Denmark; IN2P3-CNRS, CEA-DSM/IRFU, France; SRNSF, Georgia; BMBF, HGF, and MPG, Germany; GSRT, Greece; RGC, Hong Kong SAR, China; ISF, I-CORE and Benoziyo Center, Israel; INFN, Italy; MEXT and JSPS, Japan; CNRST, Morocco; NWO, Netherlands; RCN, Norway; MNiSW and NCN, Poland; FCT, Por-tugal; MNE/IFA, Romania; MES of Russia and NRC KI, Russian Federation; JINR; MESTD, Serbia; MSSR, Slovakia; ARRS and MIZŠ, Slovenia; DST/NRF, South Africa; MINECO, Spain; SRC and Wallenberg Foundation, Sweden; SERI, SNSF and Cantons of Bern and Geneva, Switzerland; MOST, Taiwan; TAEK, Turkey; STFC, United Kingdom; DOE and NSF, United States of America. In ad-dition, individual groups and members have received support from BCKDF, the Canada Council, CANARIE, CRC, Compute Canada, FQRNT, and the Ontario Innovation Trust, Canada; EPLANET, ERC, ERDF, FP7, Horizon 2020 and Marie Skłodowska-Curie Actions, European Union;
Investisse-Generalitat de Catalunya, Investisse-Generalitat Valenciana, Spain; the Royal Society and Leverhulme Trust, United Kingdom.
The crucial computing support from all WLCG partners is acknowledged gratefully, in particular from CERN, the ATLAS Tier-1 facilities at TRIUMF (Canada), NDGF (Denmark, Norway, Sweden), CC-IN2P3 (France), KIT/GridKA (Germany), INFN-CNAF (Italy), NL-T1 (Netherlands), PIC (Spain), ASGC (Taiwan), RAL (UK) and BNL (USA), the Tier-2 facilities worldwide and large non-WLCG resource providers. Major contributors of computing resources are listed in Ref. [52].
References
[1] Eboli, O. J. P. and Gonzalez-Garcia, M. C. and Lietti, S. M.,
Bosonic quartic couplings at CERN LHC, Phys. Rev. D 69 (2004) 095005, arXiv:hep-ph/0310141.
[2] O. J. P. Eboli, M. C. Gonzalez-Garcia and J. K. Mizukoshi,
pp → j je±µ±νν and j je±µ∓νν at O(α6em) and O(α4emα2s) for the study of the quartic electroweak gauge boson vertex at CERN LHC, Phys. Rev. D 74 (2006) 073005, arXiv:hep-ph/0606118.
[3] M. Baak et al., Study of Electroweak Interactions at the Energy Frontier (2013), arXiv:1310.6708 [hep-ph].
[4] C. Degrande et al., Effective field theory: A modern approach to anomalous couplings, Annals Phys. 335 (2013) 21, arXiv:1205.4231 [hep-ph].
[5] Patterns of deviation from the standard model, Nucl. Phys. B 433 (1995) 41, arXiv:hep-ph/9405214.
[6] CMS Collaboration, A search for WWγ and WZγ production and constraints on anomalous quartic gauge couplings in pp collisions at √s=8 TeV, Phys. Rev. D 90 (2013) 032008, arXiv:1404.4619 [hep-ph].
[7] ATLAS Collaboration, Evidence of Wγγ Production in pp Collisions at √s= 8 TeV and Limits on Anomalous Quartic Gauge Couplings with the ATLAS Detector,
Phys. Rev. Lett. 115 (2015) 031802, arXiv:1503.03243 [hep-ex].
[8] CMS Collaboration, Measurements of the pp → Wγγ and pp → Zγγ cross sections and limits on anomalous quartic gauge couplings at √s= 8 TeV (2017),
arXiv:1704.00366 [hep-ex].
[9] ATLAS Collaboration, Measurements of Zγ and Zγγ production in pp collisions at √s= 8 TeV with the ATLAS detector, Phys. Rev. D 93 (2016) 112002,
arXiv:1604.05232 [hep-ex].
[10] ATLAS Collaboration, Search for triboson W±W±W∓production in pp collisions at √s= 8 TeV with the ATLAS detector, Eur. Phys. J. C 77 (2017) 141,
arXiv:1610.05088 [hep-ex].
[11] CMS Collaboration, Study of exclusive two-photon production of W+W−in pp collisions at √
s= 7 TeV and constraints on anomalous quartic gauge couplings, JHEP 07 (2013) 116, arXiv:1305.5596 [hep-ex].
[12] ATLAS Collaboration, Measurement of exclusive γγ → W+W−production and search for exclusive Higgs boson production in pp collisions at √s= 8 TeV using the ATLAS detector, Phys. Rev. D 94 (2016) 032011, arXiv:1607.03745 [hep-ex].
[13] ATLAS Collaboration, Measurement of W±W±vector-boson scattering and limits on anomalous quartic gauge couplings with the ATLAS detector(2016),
[15] CMS Collaboration, Measurement of the cross section for electroweak production of Zγ in association with two jets and constraints on anomalous quartic gauge couplings in proton-proton collisions at √s= 8 TeV (2017), arXiv:1702.03025 [hep-ex].
[16] CMS Collaboration, Measurement of electroweak-induced production of Wγ with two jets in pp collisions at √s= 8 TeV and constraints on anomalous quartic gauge couplings (2016), arXiv:1612.09256 [hep-ex].
[17] Bjorken, J. D., Rapidity gaps and jets as a new-physics signature in very-high-energy hadron-hadron collisions, Phys. Rev. D 47 (1993) 101.
[18] ATLAS Collaboration, The ATLAS Experiment at the CERN Large Hadron Collider, JINST 3 (2008) S08003.
[19] ATLAS Collaboration, Luminosity determination in pp collisions at √s= 8 TeV using the ATLAS detector at the LHC, Eur. Phys. J. C 76 (2016) 653, arXiv:1608.03953 [hep-ex]. [20] ATLAS Collaboration, The ATLAS Simulation Infrastructure, Eur. Phys. J. C 70 (2010) 823,
arXiv:1005.4568 [hep-ex].
[21] S. Agostinelli et al., GEANT4: A simulation toolkit, Nucl. Instrum. Meth. A 506 (2003) 250. [22] T. Gleisberg et al., Event generation with SHERPA 1.1, JHEP 02 (2009) 007,
arXiv:0811.4622 [hep-ph].
[23] Alwall, J. et al., The automated computation of tree-level and next-to-leading order differential cross sections, and their matching to parton shower simulations, JHEP 07 (2014) 079, arXiv:1405.0301 [hep-ph].
[24] S. Catani et al., QCD matrix elements+ parton showers, JHEP 11 (2001) 063, arXiv:hep-ph/0109231.
[25] F. Krauss, Matrix elements and parton showers in hadronic interactions, JHEP 08 (2002) 015, arXiv:hep-ph/0205283.
[26] H.-L. Lai et al., New parton distributions for collider physics, Phys. Rev. D 82 (2010) 074024, arXiv:1007.2241 [hep-ph].
[27] S. Frixione and B. R. Webber,
Matching NLO QCD computations and parton shower simulations, JHEP 06 (2002) 029, arXiv:hep-ph/0204244.
[28] S. Frixione et al., NLO QCD corrections in Herwig++ with MC@NLO, JHEP 01 (2011) 053, arXiv:1010.0568 [hep-ph].
[29] J. M. Butterworth, J. R. Forshaw and M. H. Seymour,
Multiparton interactions in photoproduction at HERA, Z. Phys. C 72 (1996) 637, arXiv:hep-ph/9601371.
[30] J. Pumplin et al.,
New Generation of Parton Distributions with Uncertainties from Global QCD Analysis, JHEP 07 (2002) 012, arXiv:hep-ph/0201195.
[31] T. Sjöstrand, S. Mrenna and P. Skands, A Brief Introduction to PYTHIA 8.1, Comput. Phys. Commun. 178 (2008) 852, arXiv:0710.3820 [hep-ph].