https://doi.org/10.4224/40001908
Vous avez des questions? Nous pouvons vous aider. Pour communiquer directement avec un auteur, consultez
la première page de la revue dans laquelle son article a été publié afin de trouver ses coordonnées. Si vous
Questions? Contact the NRC Publications Archive team at
[email protected]. If you wish to email the authors directly, please see the first page of the publication for their contact information.
https://publications-cnrc.canada.ca/fra/droits
L’accès à ce site Web et l’utilisation de son contenu sont assujettis aux conditions présentées dans le site LISEZ CES CONDITIONS ATTENTIVEMENT AVANT D’UTILISER CE SITE WEB.
READ THESE TERMS AND CONDITIONS CAREFULLY BEFORE USING THIS WEBSITE. https://nrc-publications.canada.ca/eng/copyright
NRC Publications Archive Record / Notice des Archives des publications du CNRC :
https://nrc-publications.canada.ca/eng/view/object/?id=9d4ecd38-e032-4f73-80f1-51b77e0aa679 https://publications-cnrc.canada.ca/fra/voir/objet/?id=9d4ecd38-e032-4f73-80f1-51b77e0aa679
Archives des publications du CNRC
For the publisher’s version, please access the DOI link below./ Pour consulter la version de l’éditeur, utilisez le lien DOI ci-dessous.
Access and use of this website and the material on it are subject to the Terms and Conditions set forth at Drone impact assessment on aircraft structure: flat plate testing and analysis
Dadouche, Azzedine; Galeote, Brian; Breithaupt, Timothy; Greer, Allan; Backman, David; Li, Gary (Linxi); Vidal, Charles; Gould, Ron
AEROSPACE REASEARCH CENTRE
N A T I O N A L R E S E A R C H C O U N C I L C A N A D A
Drone Impact Assessment on
Aircraft Structure: Flat Plate
Testing and Analysis
Volume 1 of 2
Report No: CR-GTL-2020-0053 Date: March 2020
Authors :
Aerospace - GTL Aerospace – SMPL Aerospace – AMTC External
Azzedine Dadouche Brian Galeote Timothy Breithaupt Allan Greer David Backman Gary (Linxi) Li
Contents
1 Introduction ... 1
2 Test setup & instrumentation ... 2
3 Test results & discussion ... 9
4.1 High speed and thin plate ... 9
4.2 Low speed and thin plate ... 15
4.3 High speed and thick plate ... 19
4.4 Low speed and thick plate ... 23
Table of Figures
Figure 1: General view of the drone super cannon ...2
Figure 2: Plate test frame...3
Figure 3: Test plate assembly ...3
Figure 4: Drone/sabot assembly ...4
Figure 5: DIC system: a) back side, b) front side ...5
Figure 6: Speckled vinyl applied to rear surface of a test plate ...5
Figure 7: Cameras locations for speed and orientation angles measurement ...6
Figure 8: Impact force at 250 knots against thin plate (Test #1) ...9
Figure 9: Impact force at 250 knots against thin plate (Test #2) ... 10
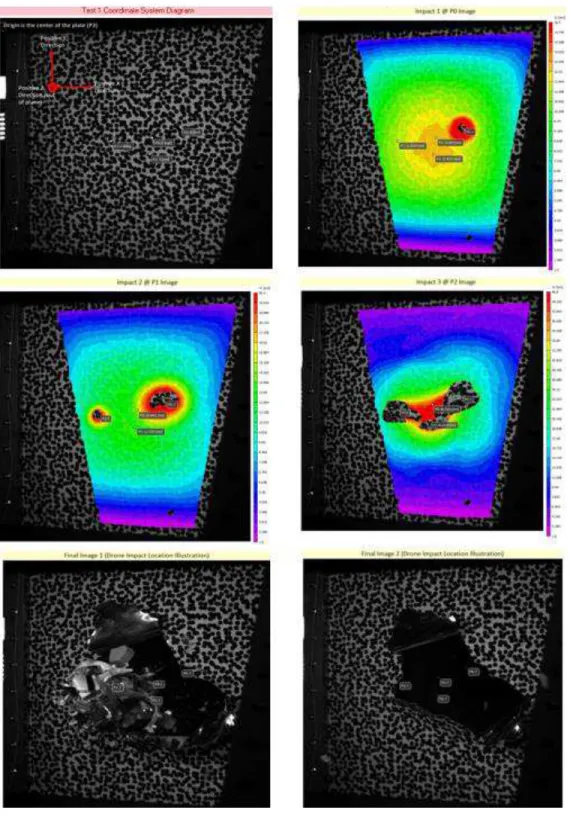
Figure 10: Impact and post-impact images for Test #1... 12
Figure 11: Impact and post-impact images for Test #2... 12
Figure 12: DIC data: Out of plane displacement at key points (Test #1) ... 13
Figure 13: DIC data: Out of plane displacement at key points (Test #2) ... 14
Figure 14: Impact force at 140 knots against thin plate (Test #3) ... 15
Figure 15: Drone crash time (Test #3) ... 16
Figure 16: Impact orientation (Test #3) ... 16
Figure 17: Plate and drone pictures after impact (Test #3) ... 17
Figure 18: DIC data: Out-of-plane displacement at key points (Test #3) ... 18
Figure 19: Impact load comparison (Tests: 3-5)... 19
Figure 20: Impact force on thick plates at 250 knots (Tests #6 and #7) ... 20
Figure 21: Post-test pictures (Test #6) ... 21
Figure 22: Post-test pictures (Test #7) ... 21
Figure 23: DIC data (Test #6) ... 22
Figure 24: DIC data (Test #7) ... 22
Figure 25: Impact force on thick plates at 140 knots (Tests #8 & #9) ... 23
Figure 26: Drone impact (Test #8)... 24
Figure 27: Drone impact (Test #9)... 24
Figure 28: Maximum peaks at 140 knots (thick plate) ... 25
Figure 29: Drone impact & DIC data (Test #8) ... 26
List of Tables
Table 1. Drone characteristics ...7
Table 2. Characteristics of test plates ...7
Table 3. Testing conditions requirements ...8
Table 4. Maximum force at each load cell... 10
Table 5. Speed and orientation angle of drone... 10
Table 6. Speed and orientation angle of drone (Tests 3-5) ... 15
Table 7. Maximum peaks for Tests #6 & #7 ... 20
Table 8. Speed and orientation angle of drone for Tests #6 & #7 ... 20
1
INTRODUCTION
Over the last decade, aerial drones have been increasingly used by both professional and inexperienced users resulting in few impact incidents throughout the world. Transport Canada (TC) has already implemented regulations dealing with the operation of drones, especially in sensitive areas such as airports where a safe distance must be observed. However, the risk of impacting an aircraft at low altitude remains from both malicious and careless operators.
NRC- Aerospace Research Centre has been performing bird impact testing both on aircraft structures, windshields as well as on engines since the 1960s where a number of pneumatic guns with various sizes have been developed and run for various clients. Over that period, NRC’s bird guns were used to fire bird carcasses in accordance with ASTM standard (F330 – 16) to certify aircraft materials, gelatin synthetic birds for research purposes as well as steel balls. The latter test aimed at certifying a bullet-proof windshield of a fighter aircraft with a firing ball velocity reaching 1237 km/h (1.036 Mach, 668 knots).
The main objective of this collaborative work between Transport Canada, Defence Research and Development Canada and the National Research Council Canada is to perform experiments simulating real impacts between drones (Quadcopters) and aircraft components (windshield and wing sections) at representative conditions (impact velocity, mass and type of projectile).
However, a series of tests on flat aluminum plates with two thicknesses was first carried out to: assess impact force
determine plate deformation at various locations assess drone damage
This report gives an overall description of the test setup for plate impact testing and provides experimental data along with analysis and discussion.
2
TEST SETUP & INSTRUMENTATION
A general view of NRC’s drone “super cannon” is presented in Figure 1. It is mainly composed of a stand-alone pressure vessel, high-speed valve, transition adapter (reducer) and a stainless steel barrel. The barrel features an ID of 17.25” allowing to launch projectiles with an overall diameter of 15”.
The plate test setup is shown in Figure 2. The test frame is composed of a massive steel structure supported on four steel swivel leveling mounts to ensure accurate height positioning of the test plate with regards to the centerline of the cannon. In addition, the hole-pattern on the front vertical plates of the test frame allow a coarse adjustment (3” step) of the horizontal beams on which the framed test plate assembly is mounted.
The test plate assembly is presented in Figure 3. It is equipped with four uniaxial load cells, located at the corners of the test frame (back side), with a total range up to 40,000 lb.
Figure 2: Plate test frame
Figure 3: Test plate assembly
NRC’s “BAAT1” sabot design was used to launch the drones for these impact tests. The
foam-based sabot features custom-made foam blocks to support the drone’s battery and camera as depicted in Figure 4. This design doesn’t require a stripping or arresting mechanism at the muzzle of the barrel.
Figure 4: Drone/sabot assembly
A 3D digital image correlation system (DIC) was used to measure the deformation of the test plates. Two high speed cameras (Photron SA.1) were used to capture images at 20,000 frames per second (fps) with a resolution of 1024 pixels by 720 pixels. The cameras were placed at the back of the test specimen and the captured DIC data was used to accurately determine the deformation of plates during the period of the drone impact (Figure 5). The cameras were mounted at an angle and protected by Polycarbonate shields to avoid any damage that might be caused by drone or sabot debris.
The test plates featured a thin layer of epoxy vinyl on which a random speckle pattern was printed (Figure 6). The speckle pattern was printed on the vinyl using archival ink and then adhered to the back surface of each test plate. The digital image correlation (DIC) algorithms subdivides the area of interest (AOI) into regularized squares (subsets) and then uses cross-correlation techniques to calculate displacements that occur between the initial reference image and subsequent deformed images. The derivative of these displacements over the entire AOI can then be used to calculate the full field strain on the back surface of the plate.
Figure 5: DIC system: a) back side, b) front side
In addition, three high speed cameras were used to measure the drone’s speed as well as its orientation angles (pitch, yaw and roll). A fourth camera was used to record an isometric view of the impact. Figure 7 depicts the location of the various cameras. C1 and C2 measure the speed from the top and side planes as well as the yaw and pitch angles respectively. C3 allows the determination of the roll angle and C4 gives an overall view of the impact.
The sequence of speed measurement is summarized below:
1) Setup high speed camera perpendicular to the drone’s line of flight
2) Setup a ruler along the path of the drone trajectory and record a baseline video to calibrate the AVI player program based on the distance selected on the ruler and the frame speed set in the camera.
3) After test, select a fixed point on the drone to be tracked over a number of frames 4) Calculate the speed between every two successive points along with the average value. Drone orientation angles are extracted from the side, top and back videos. Pictures are selected from each video and then post-processed separately to determine the drone’s orientation angles.
The specifications and dimensions of the drones and plates are given in Table 1 and Table 2. A total of nine tests using the DIC system have been conducted. Table 3 presents a summary of the nine plate impact tests. Tests were performed at two distinct speeds: 140 knots (72 m/s) as a typical landing approach speed and 250 knots (128.61 m/s) as a cruising speed under an altitude of 10,000 feet (3,048 m).
The distance between the cannon muzzle and test plates was selected based on the ASTM standard test method (F-330-16) recommendations (at least 10 times the ID of the barrel). This was used as a guideline only since the standard was developed for bird impact testing and certification.
The original plan was to launch all drones with a fully charged Lithium-Ion battery installed. However, experience from the first few tests demonstrated that charged batteries would short, overheat, smoke and ignite into open flame. It was therefore decided to complete the remaining tests using drones with flat batteries.
Before each test, the garage door of the test room was opened for ventilation purposes. In addition, a large capacity, ducted fan, located close to the test plate, was turned on immediately after each test to evacuate the air inside the testing room and draw in fresh air through a side door.
Table 1. Drone characteristics
Projectile Model Dimensions [in, cm] Mass [oz., gr.]
Full UAS Quadcopter 7.56x11.31x11.31
19.2x28.73x28.73 41.16, 1167
Table 2. Characteristics of test plates
Description Material Size (in, cm) Thickness
[in, mm] Quantity
Aluminum Panel ALC 2024-T3 41 x 41
104x104 0.063, 1.6 5 Aluminum Panel 2024-T351 41 x 41
Table 3. Testing conditions requirements
Test # Velocity [knot] Plate thickness [in, mm] Battery status
1 250 (±5) 0.063, 1.6 Charged 2 250 (±5) 0.063, 1.6 Charged 3 140 (±5) 0.063, 1.6 Discharged 4 140 (±5) 0.063, 1.6 Discharged 5 140 (±5) 0.063, 1.6 Discharged 6 250 (±5) 0.25, 6.35 Discharged 7 250 (±5) 0.25, 6.35 Charged 8 140 (±5) 0.25, 6.35 Discharged 9 140 (±5) 0.25, 6.35 Discharged
The load cells signals were recorded using a high-speed data acquisition system. The sampling frequency was set to 20,480 Hz. Data recording of the load cells was activated a few seconds before the drone was fired. However, since the amount of memory on the Photron SA.1 cameras only allowed for approximately 0.80 seconds of recording time, a trigger signal (5VDC) from the LabVIEW-based control system was provided to start recording right before the impact. The signal from LC#4 was also recorded (in parallel) by the DIC data acquisition system, and the recording begins for the DIC system after receiving the same trigger signal for the Photron SA.1 cameras. The trigger signal was also recorded using the high speed data acquisition system. This allowed for the temporal synchronization of all load signals as well as of the DIC deformation data.
A LabVIEW-based data acquisition system along with an electronic controller were used to trigger the various devices in the aforementioned sequence.
3
TEST RESULTS & DISCUSSION
A summary of each test is given below. Full videos and post impact pictures of the plates and drones will be presented to TC separately.
4.1 HIGH SPEED AND THIN PLATE
Two impact tests were performed on thin plates (0.063 in, 1.6 mm) at an expected speed of 250 knots (Tests #1 and #2). Figure 8 and Figure 9 show the overall impact load recorded by the load cells located at the four corners of the plate along with the total load at each time step. Both figures feature a linear increase of the load (up to ~ 500 lb) before any contact between the drone and the plate. This is caused by the column of air (ahead of the sabot) pushed out of the barrel during the firing process. The videos of the tests show the plates moving backwards before the impact occurs. The peak signals of the four load cells were not in phase as a result of the impact location (off center of the plate). The impact waves propagate throughout the plate accordingly towards the load cells. The maximum impact force recorded by the load cells is also different from one to the other as this is dependent on the impact location of the drone’s center of mass and its orientation angles (pitch, roll and yaw). The total load plotted in these figures is simply the algebraic sum of the four recorded load cell forces throughout the impact period. For Test #1, the total load maximum was 22,030 lb, whereas for Test #2, it was slightly higher (23,700 lb); a difference of about 1700 lb.
Figure 9: Impact force at 250 knots against thin plate (Test #2)
However, adding up the maximum forces recorded by each load cell gives a total maximum force of 27,717 lb for Test #1 and 27,740 lb for Test #2. The difference is very negligible (0.08%). Table 4 presents the maximum impact force at each load cell for both tests. The differences of loads between the two tests at each location is due to the differences in impact location and orientation of the drone as it impacts the plate.
Table 5 shows the speed and orientation angles of the drone for each test.
Table 4. Maximum force at each load cell
Test #
Maximum impact load [lb]
LC#1 LC#2 LC#3 LC#4 Total
1 7,330.13 7,774.32 6,623.87 5,988.94 27,717.26
2 7412.37 7167.63 6586.34 6574.52 27,740.86
Table 5. Speed and orientation angle of drone
Test #
Velocity [knot]
Orientation angle [°]
Pitch Yaw Roll
1 251.5 10.2 6.7 12.7
Pictures of the impact and post-impact for both tests are presented in Figure 10 and Figure 11. The drones have penetrated through the plates and created significant openings at the center of the plates. In both tests, the contact started with a single motor (due to the yaw). This was enough to create a hole in the plate. It is worth mentioning that the battery cells started smoking after the impact and initiated a fire.
DIC data is presented in Figure 12 and Figure 13. The digital image correlation method required a high contrast surface be applied to the area of interest. Due to the large deformations expected and due to the large area of interest, a white coloured epoxy vinyl adhesive with a black coloured speckle pattern printed on it, was bonded to the back surface of each plate. With this step
completed, a reference image of each plate was taken before each test and then “deformed” images of the plate were taken at 20,000 fps using high speed cameras (Photron SA.1). The DIC software subdivided the AOI into smaller regions (subsets) and used a cross-correlation
algorithm to determine the displacements between the reference and deformed images. These full field displacements were then differentiated to determine the in-plane strain tensors.
In order to setup the DIC data for comparison with the simulation result, a post-processing coordinate transformation was done to ensure the center of the plate was origin of the DIC co-ordinate system, with the x-axis and y-axis in plane with the panel, along either the height
direction or width direction. Such a transformation enables the displacement perpendicular to the panel surface (out of plane displacement) to be calculated. The out of plane displacement and the orientation of the x-axis and y-axis for Test #1 and Test #2 are shown in Figure 12 and Figure
13. Note that for Test #1, final two images did not include data since the drone penetrated the plate and the subsequent drone debris made impact with the camera setup, causing significant vibration thus invalidating data recorded after the debris impact.
Figure 10: Impact and post-impact images for Test #1
4.2 LOW SPEED AND THIN PLATE
Three tests (#3, #4, and #5) were carried out at low speed (approximately 140 knots) and against thin aluminium plates (0.063 in, 1.6 mm). These tests were challenging in terms of drone
orientation control at low speed. The sabot kept rotating within the barrel over the acceleration period. As a result, the drone impacted the plate in a different orientation during each of the three tests. However, impact speed was within the allowable tolerance of ±5 knots. Table 6 presents the measured speeds as well as the orientation angles. Figure 14 depicts the evolution of the impact forces for Test #3. The evolution of the load cell signals are very comparable to those obtained during the high speed drone tests (Figure 8 and Figure 9). The impact of the drone results in a series of oscillations of the plate which explains the generally sinusoidal shape of the signals. The first series of peaks (~3.608 s) represent the drone impact, whereas the second highest series of peaks represents the impact of the sabot. The remaining low-amplitude sinusoidal signals are due to the oscillation induced in the plate after the impact. The total contact time of the drone with the plate for Test #3 was approximately 5 milliseconds as shown in Figure 15.
Table 6. Speed and orientation angle of drone (Tests 3-5)
Test # Velocity [knot]
Orientation angle [°]
Pitch Yaw Roll
3 134.49 0 43 8
4 137.16 ~2 37 - 40 40 - 42
5 138.64 8.8 17.3 85
The yaw angle for this test (#3) was close to 45° as indicated in Table 6 and shown in Figure 16. The drone impacted the plate with a single motor at 0° pitch angle and about 8° roll angle. The camera stayed on and the drone crashed into the plate symmetrically (Figure 16). Pictures of the test plate and the drone are presented in Figure 17. The drone caused the plate to tear without penetration. The motors’ and camera’s imprints can easily be seen on the plate. The impacted arm of the drone was completely damaged. However, the other parts did not undergo similar failure including the battery pack.
Figure 15: Drone crash time (Test #3)
Figure 17: Plate and drone pictures after impact (Test #3)
Selected DIC data for Test #3 is presented in Figure 18. The colormaps show the sequence of the impact. It starts with the one arm/motor, body and camera and finally the side arms/motors. The highest out-of-plane deflection was at point P3 that features the body of the drone.
Comparison of the maximum impact loads for the three tests is presented in Figure 19. Even though the drone impact speed was within 4 knots of each other (Table 6), the loads are different especially for Test #5. Considering the orientation angles of the drone, especially the roll angle for Test #5 (Table 6), such results were expected. However, the totals of the maximum peaks for the three tests are very close (~2.7%) except for Test #5 (15% lower than Test #4 and 12.5% lower than Test #3).
It is also important to note that the plates for Test #4 and Test #5 were severely damaged but there was no tear through the material or penetration by drone debris.
Figure 19: Impact load comparison (Tests: 3-5)
4.3 HIGH SPEED AND THICK PLATE
Two tests (Test #6 and Test #7) were done at high speed (approximately 250 knots) and on thick aluminium plates (0.25 in, 6.35 mm). Test #6 was carried out with a dead battery whereas, in Test #7, a drone with a fully charged battery was used.
Figure 20 depicts the evolution of the load cells signals before and after the drone/plate impact for Tests #6 and #7. The trends are similar for both tests where the first series of spikes represent the drone impact and the second series of high peaks illustrates the sabot impact. The rest
portrays the plates’ oscillations after the impact. In addition, and similarly to the tests on thin plates (Figure 8 and Figure 9), the load cells recorded a linear evolution before the impact. The slope is much lower compared to the case of the thin plates.
A comparison of the maximum peaks for each test is presented in Table 7. Overall, the loads are comparable and the difference are mainly due to the impact location and orientation of the drone especially the yaw angle which are depicted in Table 8. The difference of the total forces is within 5.5%.
Figure 20: Impact force on thick plates at 250 knots (Tests #6 and #7)
Table 7. Maximum peaks for Tests #6 & #7
Test #
Maximum impact load [lb]
LC#1 LC#2 LC#3 LC#4 Total
6 14,535 16,973 17,226 19,435 68,169
7 13,852 18,913 19,064 20,165 71,994
Table 8. Speed and orientation angle of drone for Tests #6 & #7
Test #
Velocity [knot]
Orientation angle [°]
Pitch Yaw Roll
6 253.6 4.5 7.5 13.2
Various pictures of the drone impacting the plates from different angles are presented in Figure
21 and Figure 22. The same figures show the damage to plates as well as the remains of the drones. All plates exhibited similar damage with no penetration by the drone.
As mentioned in Table 3, the drone used for Test #7 had a fully charged battery pack (4 cells inside). After the impact, two out of the four cells were still attached to the drone’s body. They started smoking right after the impact and then ignited.
Selected DIC data is presented in Figure 24 and Figure 26 showing the out-of-plane displacement at key impact points of the drones (motors and drone’s body).
Figure 21: Post-test pictures (Test #6)
Figure 23: DIC data (Test #6)
4.4 LOW SPEED AND THICK PLATE
Tests #8 and Test #9 were carried out against thick aluminium plates (0.25 in, 6.35 mm) and at a speed of 140 knots. Drones with dead batteries were used for these impact tests. Figure 25 illustrates the various load cell signals before and after impact for both tests. Overall, the trends are similar and are in agreement with all the tests performed at the various speeds and plate thicknesses. However, such thick plates were not affected by the volume of air displaced along the barrel during the test. The maximum force recorded before the impact was under 30 lb. This is due to two main points:
thickness and rigidity of the plate air flow rate
Drone impact location and orientation angles (pitch, yaw and roll) affect the phase shift between the various signals. Figure 26 and Figure 27 depict the various orientations of the drones during impact (side and top views). Drone impact speed and orientation angles are given in
Table 9.
Figure 26: Drone impact (Test #8)
Table 9. Speed and orientation angle of drone for Tests #8 & #9 Test # Velocity [knot] Orientation angle [°]
Pitch Yaw Roll
8 138.6 2 9 4.5
9 140.2 8.2 11.4 40
A comparison of the impact peak loads between the two tests is presented in Figure 28. The variation between peaks for each load cell ranges between 4.7% (LC1) to 23.5% (LC3). However, this percentage is much lower when the total maximum force is considered (3.3%).
Figure 28: Maximum peaks at 140 knots (thick plate)
Pictures of the test plates and drones after the impact are presented in Figure 29 and Figure 30. In addition, colormaps of the out-of-plane displacement from the DIC system show the impact sequence for each test with the maximum out of plane displacement at the main body impact point.
4
CONCLUSION
Drone impact tests on flat aluminum plates have been performed at NRC using a newly developed “Super cannon”. Tests have been performed at two speeds and using two plate thicknesses. Below is a summary of the results:
NRC met Transport Canada stated requirements in terms of test speed and targeting accuracy through monitoring with high-speed cameras.
Drone speed and orientation angles were accurately measured using the views captured by high speed cameras located at key positions around the test plates. ASTM standard test method (F330-16) was used as a guide to determine the distance
between the muzzle and the target.
Speed of the drone has a significant effect on the impact energy. The latter increases with the square of the speed. This explains the difference in peak loads from test to test when only the speed is changed (same plate thickness).
Based on the test results, all high speed tests (250 knots) resulted in the failure of the thin plates (0.063 in, 1.6 mm). Drones penetrated and severely damaged the plates. Tests at 140 knots against thin plates caused damage without full penetration by the
drone. A few plates had a tear through the thickness and others suffered severe plastic deformation.
Tests against thick plates (0.25 in, 6.35 mm) did not result in any drone penetration or material tear. Plastic deformation occurred on all test plates.
The successful integration of the DIC system allowed the determination of the full-field strain map and out-of-plane displacement on the test plates which could not be as well described or recorded if individual strain gauges had been applied.
Cells of fully charged batteries tended to overheat, smoke and transition to open flames after a period of time following the impact and because the battery cells were mechanically damaged. Fully discharged batteries did not suffer this sequence to become a fire hazard.
An immediate response protocol was established to locate and remove all damaged battery cells from the test room, regardless their charge condition. Water immersion or burial in sand, outside the work area, were employed as containment measures. Impact forces and strain/displacement data will help with developing/validating
numerical impact models.
1 BAAT: Stands for the names of NRC staff who designed the sabot (Brian, Allan, Azzedine and Tim)