Publisher’s version / Version de l'éditeur:
Design, Manufacturing and Applications of Composites-Proceedings of the Eighth Joint Canada-Japan Workshop on Composites, 2010-11-01
READ THESE TERMS AND CONDITIONS CAREFULLY BEFORE USING THIS WEBSITE. https://nrc-publications.canada.ca/eng/copyright
Vous avez des questions? Nous pouvons vous aider. Pour communiquer directement avec un auteur, consultez la
première page de la revue dans laquelle son article a été publié afin de trouver ses coordonnées. Si vous n’arrivez pas à les repérer, communiquez avec nous à [email protected].
Questions? Contact the NRC Publications Archive team at
[email protected]. If you wish to email the authors directly, please see the first page of the publication for their contact information.
NRC Publications Archive
Archives des publications du CNRC
This publication could be one of several versions: author’s original, accepted manuscript or the publisher’s version. / La version de cette publication peut être l’une des suivantes : la version prépublication de l’auteur, la version acceptée du manuscrit ou la version de l’éditeur.
Access and use of this website and the material on it are subject to the Terms and Conditions set forth at Adhesive bond testing by laser shock waves and laser interferometry Perton, Mathieu; Blouin, Alain; Monchalin, Jean-Pierre; Gay, Élise; Berthe, Laurent; Boustie, Michel; Arrigoni, Michel
https://publications-cnrc.canada.ca/fra/droits
L’accès à ce site Web et l’utilisation de son contenu sont assujettis aux conditions présentées dans le site LISEZ CES CONDITIONS ATTENTIVEMENT AVANT D’UTILISER CE SITE WEB.
NRC Publications Record / Notice d'Archives des publications de CNRC: https://nrc-publications.canada.ca/eng/view/object/?id=457833a9-1cdd-46c0-bbfe-0c60e4fb931f https://publications-cnrc.canada.ca/fra/voir/objet/?id=457833a9-1cdd-46c0-bbfe-0c60e4fb931f
1
Adhesive bond testing by laser shock waves and laser interferometry
Mathieu Perton1, Alain Blouin1, Jean-Pierre Monchalin1,
Élise Gay2, Laurent Berthe2, Michel Boustie3, and Michel Arrigoni4
1
Industrial Materials Institute, National Research Council of Canada 75 de Mortagne, Boucherville, Québec, Canada, J4B 6Y4
2
Laboratoire Procédés et Ingénierie en Mécanique et Matériaux Arts et Métiers Paris Tech 151 boulevard de l’Hôpital, 75013 Paris, France
3
Institut P’, Département Physique et Mécanique des Matériaux, CNRS-ENSMA-Université de Poitiers
1 av Clément Ader, 86961 FUTUROSCOPE Cedex, France
4
Laboratoire Brestois de Mécanique et des Systèmes LBMS
ENSIETA - MSN (EA 4325 - ENSIETA / Université de Brest / ENIB) 2 Rue François Verny, 29806 Brest Cedex 9 France
ABTRACT
Adhesive bonding of structural components presents many practical advantages when compared to other joining methods, but its application for critical components is limited by the absence of reliable nondestructive methods that can assure the bond strength of the joint. In this paper, a method based on shock waves produced by a pulsed laser is applied to the evaluation of bond strength of two plates joined with an adhesive. Different adhesives were tested. A shock wave, produced by an energetic short laser pulse can cause a delamination at the adhesive/plate interface when it propagates through them. A good bond is unaffected by a certain level of shock wave stress whereas a weaker or kissing bond is damaged. The method is made quantitative and in-situ by optically measuring the sample back surface velocity with a Doppler or velocity interferometer. The interferometer signals allow distinguishing interfaces that pass the test from the ones that fail. The measured back surface velocity is related to the internal stress by a simple equation. Experimental results show that the proposed test is able to differentiate bond quality and give a value of the bond strength. Laser-ultrasonic inspection made on laser shock tested samples confirms that weak bonds are revealed by the method. The proposed testing approach may help a broad adoption of adhesive bonding throughout the aerospace industries and its use for joining primary aircraft structures.
2
INTRODUCTION
Adhesive bonding of structural components presents many practical advantages when compared to other joining methods. A benefit is in particular the elimination of fasteners and the associated drilled holes. It could also be economically advantageous to bond several small parts to make a large structure instead of having it co-cured. However, its use for primary structures is impeded by the absence of reliable nondestructive methods that can ensure the integrity of the joint.
Laser shock generation and spallation have been studied for the measurement of the bond strength between a thin planar coating on a substrate [1-6], between carbon fibers and their matrix [7], and more recently between cells and bio-materials [8]. For these measurements, a high energy pulsed laser is used to generate a high amplitude compression pulse which propagates through the sample. Upon reaching the free back surface, this pulse is reflected as a tensile pulse that can pry apart the coating or fibers. Recent work addresses the problem of adhesive bonding of thicker structures made of carbon-epoxy composite [9]. In contrast to thin coatings, laser shock waves do not induce spallation, but delaminations or disbonds in thick structures. The laser shock method can be seen as a proof test and the evaluation is non-intrusive and nondestructive if the bond is good. It has also the advantage of providing a local measurement without mechanical contact and of being able to operate on curved laminates.
In this paper, the laser shock wave technique is adapted to the evaluation of bond strength of composite laminates joined by an adhesive layer. Adhesion strength is probed by increasing the laser pulse energy step by step. A “good” joint would be unaffected under a given stress level whereas a weaker one would be damaged. In the following, the principles of bond strength evaluation will be detailed with the application to a bonded joint comprising composite plates made of carbon fibers embedded in epoxy and joined by an adhesive layer. The method is made quantitative and in-situ by optically measuring the sample back surface velocity with an interferometer. The interferometer signals give real-time signatures of well-bonded and disbonded interfaces and are used to obtain an estimate of the bond strength. The results were confirmed by laser-ultrasonic inspection made on shocked samples. Results show that the proposed test is able to evaluate bond quality.
PRINCIPLE AND EXPERIMENTAL APPROACH
A powerful Q-Switched Nd:YAG laser which delivers optical pulses of 8 ns duration and up to 2 J energy at 1064 nm wavelength is used to induce shock waves or very high amplitude ultrasonic waves in the sample. The laser beam is focused to a spot diameter of about 4 mm. To avoid surface damage and to increase the ultrasonic wave amplitude [5, 10], the surface of the material is first covered with an absorbing tape and then with a constraining medium, transparent to the laser wavelength, as illustrated in figure 1. For optical absorption, black electrical tape which is widely available is an efficient option. A water layer is used as constraining medium.
3 Generation Laser Black tape Composite laminate Water O-ring Velocimeter
Figure 1. Setup for laser shock generation.
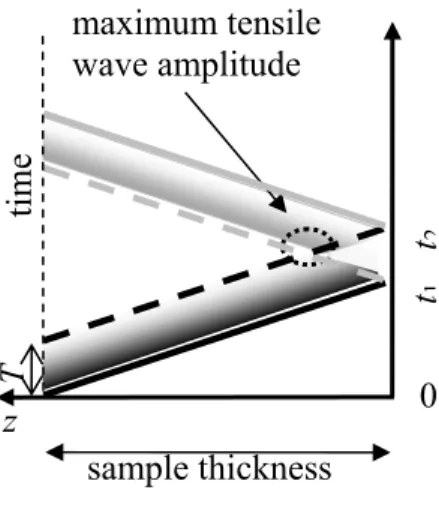
Under our generation conditions, the pressure level is below the Hugoniot Elastic Limit (HEL), so that wave propagation is in a weak or elastic shock regime in which the waves still travel approximately at the usual sound velocity [11]. However, under higher laser energy, it is possible to reach the regime of strong shock propagation, or at least elastic-plastic wave propagation. The source size (roughly the laser spot size) is a few times larger than the sample thickness, with the result that the waves propagating through the material are mostly compressional. Figure 2 shows a diagram of the evolution of a compression shock wave generated at the top surface with a time duration T, propagating through the thickness of a homogeneous plate and finally reflected by the free back surface as a tensile wave. The triangle which base line is delimited by the instants t1 and t2 corresponds to the time and space where the
compression due to the end of the incoming wave is balanced by the beginning of the reflected tensile wave. If attenuation mechanisms are neglected and for a typical shock pulse shape, the maximum tensile stress begins at a distance from the back surface given by DT/2, and this tensile wave propagates unchanged until the next reflection. Here, D
( )
z =c+s⋅u(
z)
is the shock wave propagation velocity, c the elastic wave propagation velocity, u the particle velocity and s is the Hugoniot slope parameter. Only the tensile stress could induce failure within the laminate or at the adhesive bonded interfaces.sample thickness z 0 time maximum tensile wave amplitude T t2 t1
Figure 2. Time-space diagram of the propagation of a shock wave pulse with duration T. Dark and light gray areas represent respectively the compression wave (pressure superior to the average pressure) and the tensile wave (pressure inferior to the average pressure). Dash and
To quantitatively evaluate the stresses inside a sample, an optical velocimeter based on a Fabry-Perot interferometer was developed and used to monitor the backwall surface velocity
( )
0u (see figure 1). A detailed description of the interferometer can be found in reference [12]. Under the assumptions of 1D propagation in a homogeneous material, no attenuation and an adiabatic process, the relationship at any instant t between the surface velocity signal and the
stress or pressure P ,
( )
z t at a depth z inside the plate is approximated by [13]:( )
1(
(
) (
)
)
, 2
P z t = ρD u t+z D −u t−z D [1]
where ρ is the material density.
For multi-ply composite structure, the propagation is altered by the transmission/reflection of the waves between the different layers, leading to an incorrect evaluation of the tensile stress inside the material. The propagation is also affected to some extend by material anisotropy since the source being of finite size diffraction effects cause the wave to differ from a plane wave propagating normally to the plies. It implies a discrepancy between the real pressure imposed to the joint and the one given by equation [1]. Although the purpose of this work is primarily to measure the bond strength between two carbon epoxy laminates, we will also address the strength between the plies of the laminate since in the case of a strong bond the laminate may yield before the bond.
MATERIALS PROPERTIES
The composite laminates were obtained by curing a stack of 4 or 8 carbon fibre plies pre-impregnated with epoxy (Cytec 5276-1). In each ply, the fibres (G40-800 – 24K) are unidirectional. The total thicknesses of the 4- and 8-ply are about 0.72 mm and 1.35 mm respectively and the sample in-plane dimensions are 50 mm x 50 mm. The orientation of the plies is [0/90]S and [0/45/90/-45]S for the 4- and 8-ply plates, respectively. Figure 3-a provides a
cross section of a single ply obtained under scanning electron microscope (SEM), in which carbon fibres are clearly seen. The ply thickness varies from 170 to 180µm. Figure 3-b shows the sketch of a 4-ply composite laminate. It consists in an alternation of pure epoxy layers (white and thin layers) and carbon-epoxy layers (dark grey layers). Magnified SEM images cross section of each ply is also presented. The diameter of the carbon fibres is estimated to be around 5 μm and the volume fraction of carbon fibres is 70% in average. SEM examination also shows that an epoxy layer about 15 μm thick is found between the plies. 30 µm-thick epoxy layers are also observed on the sample external surfaces. The three internal epoxy layers are called ep1, ep2 and
ep3. Given that the plies are co-cured, the epoxy matrix has a quite homogeneous high strength,
even between the plies. The composite sample shows strong anisotropy indicated by a longitudinal velocity cL of 3100 m.s-1 in the z direction normal to the plies and of 8300 m.s-1
along the 0o direction (along the fibre direction). The z axis origin is taken at the back surface where velocity measurements are made as shown in figure 3-b. The adhesive paste Hysol® EA9394 was used to bond the composite plates.
a) b)
Figure 3. a) cross section micrograph of a composite ply. b) sketch and magnified SEM cross sections of a 4-ply laminate.
z 0 0o ep3 ep1 ep2
RESULTS FOR A COMPOSITE LAMINATE ONLY
Experiments have been first performed on laminates only, without a bond, particularly to find the inter-ply damage threshold. The damage mechanism is discussed.
a. Experiments Below The Damage Threshold
The first set of tests was performed on a 4-ply laminate. Figure 4 shows the back surface velocity signal as a function of time for different laser pulse energies. The first sharp peak at about 0.35 μs corresponds to the arrival of the compression wave (L) followed by a reduction of the velocity due to rarefaction. The second and third peaks at about 0.85 µs and 1.45µs, noted as 3L and 5L, correspond to this compression wave after propagating over three and five times the thickness, respectively. The small echoes between these two peaks are due to reflections between the plies. The shapes of the velocity signals obtained with different laser energies are almost identical when normalized with respect to the maximum. The small differences can be explained by the thickness variations of the different layers and by the tape. Nevertheless, it is a proof that the shock regime is elastic and that the strong compression waves generated do not modify the material properties. As expected in elastic shock regime, the shock velocity D is approximately equal to the elastic velocity c. Generation and propagation of the high amplitude waves are in fact non invasive since the elastic limit for the carbon fibre is well above the rupture threshold of the epoxy and that the epoxy rupture is itself brittle at high strain rate, without any prior plastic deformation. This is confirmed by applying many shocks at the same place without observing any change.
Figure 4. Back surface velocity signals measured under 1200mJ (grey curve) and 800 mJ (black curve) laser shock pulse energy on a 4-ply laminate.
L
3L
5L
b. Experiment Above The Damage Threshold
The energy of the laser pulse was then increased to values much above the damage threshold and the results are shown in figure 5. All measurements were made at different locations on the sample. The signals obtained at 1300 and 1350 mJ present signatures very distinct from the one presented in figure 4. At 1350 mJ, the disbond is identified at about 480ns by small oscillations with a constant period and decreasing amplitude corresponding to reverberations within one ply. At 1300 mJ (laser power density of 1.3 GW/cm2), damage is identified but disbond is seen to occur later.
Figure 5. Back surface velocity signals measured for laser shock pulse energies above damage threshold in the 4-ply laminate.
Figure 6-a shows a laser-ultrasonic amplitude C-scan image obtained on the 4-ply laminate after laser shock. Note that laser-ultrasonic inspection is performed as usually in the thermoelastic regime, without the tape or water confinement used for producing shockwaves or high amplitude ultrasonic waves. The identified damage consists in a crack inside the epoxy layer ep1 closed to the back surface when laser energy is greater than 1350 mJ and inside the
epoxy layer ep2 when laser energy is around 1300 mJ, as shown in the A-scans of figure 6-b.
Once the location of the damage had been identified, damage threshold is determined from the velocity signals as shown in figure 5 and equation [1]. The calculated threshold is about 340 MPa, wherever damage occurred. Note that this dynamical tensile limit is much higher than
the usually accepted static tensile limit for this material [14], but the laser shockwave experiments are done in a much higher strain rate than usual mechanical tests.
700 850 1000 1200 1300 1350 1450 1450 1300 1300 1350 a b Figure 6. Laser-ultrasonic amplitude C-scan of the laminate after laser shock for different laser
pulse energies. (a) C-scan image and (b) A-scans from pointed regions in the C-scan. disbond at ep2
disbond at ep1
no disbond
RESULTS FOR BONDED LAMINATES
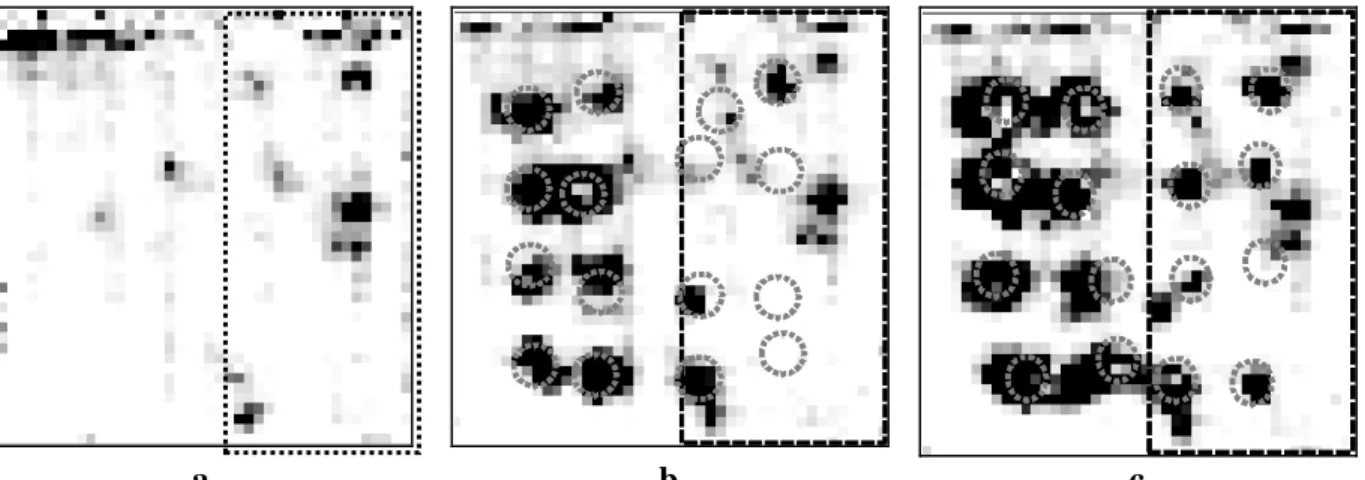
Then, two 4-ply laminates were bonded using the adhesive paste Hysol® EA9394. Rather than well preparing the surfaces before bonding and in order to achieve a weak bond, halves of each plate were only cleaned by solvent whereas other halves were roughened with a sandpaper and cleaned. The bond was measured to range between 90 and 160 µm thick. Since it was expected that adhesive strength could vary across the sample, 16 shocks were applied over the entire surface at each laser energy level, which was increased from 600mJ to 1200 mJ by step of 200 mJ. Figure 7 shows the laser-ultrasonic inspection results before (figure 7-a) and after laser shock pulses at 1000 mJ (figure 7-b) and 1200 mJ (figure 7-c). The dashed rectangle delimits the roughened area. The C-scan before laser shock shows the presence of a few pre-existing unbounded areas. The others C-scans reveal new disbonds caused by the laser shocks. The circles indicate the positions where shocks took place.
It is noted that below 1000 mJ no disbond is revealed by the ultrasonic C-scans while the velocimeter signals show disbond signatures, for example at 800mJ (figure 8). This discrepancy can be explained as follows: during the adhesive rupture, the high amplitude of the tensile waves separates the two planar interfaces of the joint and the waves are reflected toward the back surface giving strong reverberation signals within the back plate indicating separation. But after some time, good mechanical contact is restored, thus explaining the absence of damage signature by laser-ultrasonic inspection technique. The time required for the contact to be restored is indicated by the end of the reverberation velocity signals: it about 2.8µs for 800mJ loading as shown by figure 8. In this case we are producing a real kissing bond with good mechanical contact but no mechanical strength. This is unlike the cohesive damage produced in the epoxy between the plies of the laminate indicated above in the previous paragraph. In this case there is permanent cracking that is easily detected by ultrasound. According to equation [1] the bond strength is evaluated at about 130 MPa, less than half the bond strength between plies. No difference of damage threshold had been found between the two areas (roughened and not
roughened), but the surface of the defects on the C-scan are quite different letting to conclude that the rough surface avoid propagation of the disbonds, making them more difficult to be detected by ultrasonic inspection.
a b c Figure 7. Laser-ultrasonic inspection of the weakly bonded sample: (a) C-scan plot of the
amplitude of the 3rd spectral peak before laser shock, (b) Similar C-scan after laser shock at 1000 mJ, (c) Similar C-scan after laser shock at 1200 mJ.
Figure 8. Velocimeter signals produced at 600 mJ loading in black and at 800 mJ loading in grey.
CONCLUSION
A method based on high-intensity laser shock waves combined with laser-ultrasonic inspection has been used to evaluate the bond strength between carbon fibre composite laminates. Laminates without bonds were first tested and the inter-ply bond strength within the laminate was evaluated to about 340 MPa in the high strain rate regime of the method. Weakly bonded samples were made and showed a strength of about 130 MPa, significantly less than the
9
inter-ply strength of a laminate. The encouraging results provided by this work are an incentive for further development of the technique with in view ultimately its use for certifying adhesive bonding of primary aircraft structures.
ACKNOWLEDGEMENTS
The authors would like to thank Martin Lord and Christian Néron for their assistance in instrumentation for all aspects of this project. We also would like to thank Andrew Johnston, Richard Cole and Julieta Barroeta Robles of the Institute of Aerospace Research of NRC for providing the laminates and for useful information and discussions on composite materials and adhesive bonding. This work is part of the collaborative project SATAC between the National Research Council of Canada and the Centre National de la Recherche Scientifique of France.
REFERENCES
1. Vossen J. L., “Adhesion measurement of thin films, thick films, and bulk coatings”, ASTM
Spec. Tech. Publ., 640, (1978): 122-131.
2. Gupta V., Argon A. S., Cornie J. A., and Parks D. M., “Measurement of interface strength by laser-pulse-induced spallation”, Mater. Sci. Eng A126, (1990): 105–117.
3. Yuan J., Gupta V., “Measurement of interface strength by the modified laser spallation technique. I. Experiment and simulation of the spallation process” J. Appl. Phys. 74, (1993): 2388-2397.
4. Gupta V., Yuan J., “Measurement of interface strength by the modified laser spallation technique. II. Applications to metal/ceramic interfaces “, J. Appl. Phys. 74, (1993): 2397-2404.
5. Yuan J., Gupta V., Pronin A., “Measurement of interface strength by the modified laser spallation technique. III. Experimental optimization of the stress pulse”, J. Appl. Phys. 74, (1993): 2405-2410.
6. Davison L., Grady D. E., Shahinpoor M., High-Pressure Shock Compression of Solids II, Springer-Verlag, New York, 1996.
7. Yu A., Gupta V., “Measurement of in situ fiber/matrix interface Strength in graphite/epoxy composites”, Comp. Sci. and Tech., 58, (1998): 1827-1837.
8. Shim J., Hagerman E., Wu B. and Gupta V., “Measurement of the tensile strength of cell– biomaterial interface using the laser spallation technique”, Acta Biomaterialia, 4, (2008): 1657-1668.
9. Bossi R., Housen K., Walters C. T. and Sokol D., “Laser Bond Testing”, Materials
Evaluation, 67, (2009): 819-827.
10. Fabbro R., Fournier J., Ballard P., Devaux D. and Virmont J., “Physical study of laser-produced plasma in confined geometry”, J. Appl. Phys. 68, (1990): 775–781.
11. Asay J. R., Shahinpoor M., High-Pressure Shock Compression of Solids, Springer-Verlag, New York, 1993.
12. Arrigoni M., Monchalin J.-P., Blouin A., Kruger S. E. and Lord M., “Laser Doppler interferometer based on a solid Fabry–Perot etalon for measurement of surface velocity in shock experiments”, Meas. Sci. Technol. 20, 015302 (7pp) (2009).
10
13. Novikov S. A., Divnov I. I. and Ivanov A. G., “Failure of steel, aluminum, and copper under explosive loading”, Phys. Metals Metallogr. (USSR) 21,
(1966): 608-615.
14. Kwei T. K., “Strength of Epoxy Polymers. I. Effect of Chemical Structure and