Publisher’s version / Version de l'éditeur:
Vous avez des questions? Nous pouvons vous aider. Pour communiquer directement avec un auteur, consultez la
première page de la revue dans laquelle son article a été publié afin de trouver ses coordonnées. Si vous n’arrivez pas à les repérer, communiquez avec nous à PublicationsArchive-ArchivesPublications@nrc-cnrc.gc.ca.
Questions? Contact the NRC Publications Archive team at
PublicationsArchive-ArchivesPublications@nrc-cnrc.gc.ca. If you wish to email the authors directly, please see the first page of the publication for their contact information.
https://publications-cnrc.canada.ca/fra/droits
L’accès à ce site Web et l’utilisation de son contenu sont assujettis aux conditions présentées dans le site LISEZ CES CONDITIONS ATTENTIVEMENT AVANT D’UTILISER CE SITE WEB.
Technical Report, 2008-08-01
READ THESE TERMS AND CONDITIONS CAREFULLY BEFORE USING THIS WEBSITE.
https://nrc-publications.canada.ca/eng/copyright
NRC Publications Archive Record / Notice des Archives des publications du CNRC :
https://nrc-publications.canada.ca/eng/view/object/?id=cf5e7707-5d35-4d94-aa12-55807f04a190 https://publications-cnrc.canada.ca/fra/voir/objet/?id=cf5e7707-5d35-4d94-aa12-55807f04a190
Archives des publications du CNRC
For the publisher’s version, please access the DOI link below./ Pour consulter la version de l’éditeur, utilisez le lien DOI ci-dessous.
https://doi.org/10.4224/20178990
Access and use of this website and the material on it are subject to the Terms and Conditions set forth at
Ship safety and performance in pressured ice zones: Captain's responses to questionnaire
Ship Safety and Performance in Pressured Ice
Zones: Captains’ Responses to Questionnaire
Ivana Kubat and Denise Sudom
Technical Report CHC-TR-056
August 2008
The photos on the cover page are courtesy of Canadian Ice Service (CIS) of
Environment Canada (EC) and Canadian Coast Guard (CCG). They were taken by Ice Service Specialists of CIS and provided to CHC-NRC by Captain John Broderick.
Ship Safety and Performance in Pressured Ice Zones:
Captains’ Responses to Questionnaire
Ivana Kubat and Denise Sudom Canadian Hydraulics Centre National Research Council of Canada
Ottawa, Ont. K1A 0R6 Canada
Technical Report CHC-TR-056
ABSTRACT
Transport Canada funded a project whose objective is to provide real-time information on ice pressure development to ships operating in the Arctic, in order to minimize safety and operational problems due to such ice conditions. To ensure that the predictive system will provide information that will be of use to the Captains and ship owners and operators, a questionnaire was prepared and distributed to the Captains of vessels that travel through the Canadian Arctic. The main focus of the questionnaire was on topics such as the type of product needed, the geographical regions where pressure ice presents a problem during shipping, and how the product should be distributed to operating vessels. The
questionnaire and Captains’ responses are discussed in this report.
All Captains agreed that ice pressure can have a significant impact on a vessel’s
navigability, and that a product providing information on ice pressure development and build-up, and information on occurrence of leads, will significantly contribute to safe navigation through ice covered waters. In addition to a forecast of where pressured ice develops, the ability to demonstrate when pressured ice is developing in real-time is desirable. The responses identify the zones of interest and factors that can influence ice pressure. The responses also discuss the appropriate forecast products.
RÉSUMÉ
Transports Canada a financé une étude visant à générer des données en temps réel sur la pression qu’exerce la glace de mer sur la coque des navires naviguant en eaux Arctiques, dans l’optique de réduire les risques et d’aplanir les difficultés d’ordre opérationnel. On a donc conçu un questionnaire qui a été distribué parmi les commandants de bord et les exploitants dans l’Arctique Canadien, dans le but de recueillir des renseignements sur la meilleure façon de mettre en œuvre un tel système. Ce questionnaire mettait l'emphase sur les besoins des usagers, sur les zones géographiques où les pressions sont
particulièrement élevées et sur la meilleure façon de mettre ce système à la disposition des commandants de bord. Dans le présent rapport, on présente une description de ce questionnaire et on discute les résultats de l’enquête.
Le rôle important que joue la pression de la glace sur la navigabilité fait l’unanimité des commandants de bord. Ils estiment que si on arrivait à leur fournir des renseignements sur les pressions exercées sur la coque, de même que sur la présence de chenaux dans la couverture de glace, cela contribuerait considérablement à améliorer la sécurité de la navigation. Ils souhaitent également être en mesure de localiser les zones de hautes pressions et d’obtenir des données en temps réel sur quand elles se produisent. Les répondants signalent l’objet de leurs préoccupations, demandent de plus amples
TABLE OF CONTENTS
ABSTRACT... i
LIST OF FIGURES ... v
LIST OF TABLES ... vii
1. INTRODUCTION... 1
2. MARINER SURVEY... 4
2.1 Questionnaire ... 4
2.2 Participants in the Survey ... 5
3. RESULTS OF SURVEY... 7
3.1 Background Information... 7
3.1.1 Regions where ice pressure occurs ... 7
3.1.2 Season and conditions during which ice pressure occurs ... 8
3.1.3 What types of information do you use to forecast ice pressure? ... 9
3.1.4 How do you access this information? ... 9
3.1.5 Can you use GIS to read ice charts? ... 10
3.1.6 How important it is to have information on ridged/rubble ice in relation to pressured ice... 10
3.2 Questions that will help us with model developments ... 11
3.2.1 How long does it take for pressure to dissipate when the wind changes or conditions improve?... 11
3.2.2 What information currently exists that we could make use of in predicting ice pressure?... 12
3.3 Features of proposed forecast of pressured ice conditions ... 12
3.3.1 What information may assist in evaluating pressured ice zones... 12
3.3.2 Ice conditions ... 13
3.3.3 Wind... 14
3.3.4 Water current ... 15
3.4 Product type and format... 16
3.4.1 What type of product would help you determine where pressured ice exists or will form? ... 16
3.4.2 How frequently should the product be available?... 18
3.4.3 How should the product be distributed? ... 18
3.4.4 Would the Ice Service Specialists (ISS) play a role in this process?... 19
3.4.5 What should be the length scales covered by the forecast? ... 19
4. SUMMARY ... 20
5. ACKNOWLEGEMENT... 22
6. REFERENCES ... 23 APPENDIX A. Summary of Ice Pressure Scoping Study and Action Plan by Brian Wright & Associates Ltd. and C.J. Marine & Associates Ltd. ... A-1 APPENDIX B. Responses to Questionnaires... B-1
LIST OF FIGURES
Figure 1: Pressure events recorded in the IRS database ... 2
Figure 2: Pressure events in the IRS database during which a vessel was damaged... 3
Figure 3: Regions of interest... 8
Figure 4: Seasons of interest to have ice pressure development forecasted ... 9
Figure 5: Information that would help in evaluating pressured ice zones ... 13
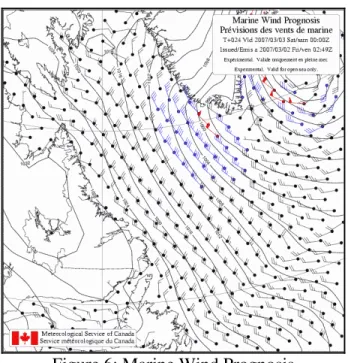
Figure 6: Marine Wind Prognosis... 14
LIST OF TABLES
Table 1: List of Captains and Ship Operators Interviewed... 6 Table 2: List of Individuals/ Marine Groups Interviewed during ice pressure Scoping
Ship Safety and Performance in Pressured Ice Zones:
Captains’ Responses to Questionnaire
Ivana Kubat and Denise Sudom
Canadian Hydraulics Centre, National Research Council, Ottawa, Ontario, Canada
1. INTRODUCTION
The Canadian Energy Research Institute evaluated the economics for development of gas reserves for Indian and Northern Affairs Canada and concluded that development could be viable (CERI, 2004). A number of oil and gas exploration licenses were issued to various oil companies for the Beaufort Sea / Mackenzie Delta, Svedrup Basin, and Eastern Arctic (http://www.ainc-inac.gc.ca/oil/). A number of studies indicate that extent of sea ice in the Arctic decreases (Wadhams, 2008; Brigham, 2007; Comiso, 2002; Falkingham et al., 2002; Flato and Boer, 2001). Advances in transport technologies have contributed to the growth of Arctic tourism (Snyder, 2005). All these facts implicate that marine transportation in the Arctic will significantly increase. However, the extreme ice conditions of the Arctic Archipelago and Northwest Passage pose a major obstacle to marine transportation. In addition, with the increase in shipping in the Arctic, it is likely that less experienced Masters will be at the helm and they will require better ice
information than is now available.
To simplify shipping in the harsh Arctic environment, good information on ice conditions should be made available to vessel captains. A scoping study has been performed to investigate methods for improving transportation in the High Arctic (Timco et al., 2005). The Captains of Canadian Coast Guard Icebreakers and Captains of commercial ships that operate in the Arctic have been interviewed within the framework of this study to determine the needs for ice information systems (Timco and Gorman, 2007). The
questions were aimed at determining the types and arrangements of ice that are of highest concern for vessel operation in the Arctic, and the range of ice conditions is the captains attempt to avoid. One of the high priority areas identified by Captains was reliable predictions of pressured ice conditions along shipping lanes.
Regions of high pressure will significantly slow the vessel and therefore affect the operation and in some cases could compromise safety. If a ship gets stuck, icebreaker support may be required. Damage to ships and corresponding downtime for repairs could reduce deliveries. A vessel could get trapped and beset in the pressured ice resulting in damage. In extreme cases, damage to ships could cause pollution to the environment and
risk of environmental pollution. Having knowledge of the location of leads will aid in planning an alternate route.
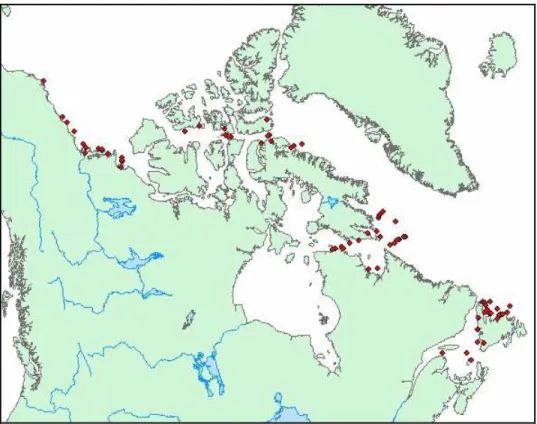
A comprehensive Ice Regime System (IRS) database was developed by NRC-CHC (Timco and Morin, 1998, Timco and Kubat, 2002). This database contains information related to occurrences of both damage and non-damage events in the Canadian Arctic. Although the research for this database was focused on the Arctic, it also contains several events which occurred in the Gulf of St.Lawrence. Each event in the database is
characterized by 79 fields that relate to vessel characteristics, route, climate, ice
conditions, and damage. The fields describing ice conditions provide information such as whether a vessel was transiting through a pressured ice zone and whether the vessel was damaged in that region. Locations of the events in pressured ice are plotted in Figures 1 and 2. Figure 1 shows locations of all IRS database events providing information on a vessel transit through pressured ice zone, while Figure 2 shows locations of ice pressure events during which a vessel was damaged.
Figure 2: Pressure events in the IRS database during which a vessel was damaged
At present, a product that can predict pressure development is not available. Transport Canada, therefore, funded a project whose objective is to provide real-time information on pressured ice conditions to ships operating in the Arctic to help minimize safety and operational problems due to such ice conditions. The main deliverable of the project is a predictive system that will provide information on the development of ice pressure areas and leads. This research will improve safe shipping and operability of vessels in the Arctic and minimize the risk of pollution. It will also improve energy efficiency by selecting the more navigable route.
The initial step in developing the predictive system was obtaining information from experienced and knowledgeable Captains of vessels that travel to the Canadian Arctic. A questionnaire was prepared and distributed to the Captains requesting information on the type of product they need to ensure safe navigation and the locations where pressured ice presents a problem during shipping. The questionnaire and Captains’ responses are discussed in this report.
2. MARINER
SURVEY
To ensure that the final product will provide useful information for Captains, ship owners and operators, a questionnaire was prepared and distributed to them for their comments and input.
The questions were divided into 4 sections: questions providing NRC-CHC with background information, questions that will help in the development of the product, questions on desired features of a proposed forecast of pressured ice conditions, and finally information on type and distribution of a desirable product. The entire Questionnaire is presented in Section 2.1:
2.1 Questionnaire
Background Information:
• What are the areas of interest (in order of priority)? • What about regions in the high Arctic?
• What are the seasons or months of interest? • At what time of year does pressured ice develop?
• What types of information do you use to forecast ice pressure (i.e. ice conditions, wind, currents, waves,etc.)?
• How do you access this information?
• How important is to have information on ridged/rubble ice in relation to pressured ice (i.e. to be able to estimate where pressured ice develops)?
• Can you use GIS software to read ice charts (if the information were delivered as a digital file)?
Few questions that will help us in the development:
• How long does it take for pressure to dissipate when the wind changes or conditions improve? i.e. Is it right away or does it take several hours?
• What information currently exists that we could make use of in predicting /validating our model? i.e. Are there any log books recording the vessel performance in
pressured ice; events when pressure happened, etc?
• What is your experience with conditions that usually lead to the development of pressured ice zones (combination of wind conditions and ice concentration and thickness)?
Features of a proposed forecast of pressured ice conditions:
• What information would you like to have delivered that may assist you in evaluating pressured ice zones (ambient pressure, ridging, intensity, pressures on hull, power requirements, speed limit, etc)?
• What information and format do you require on ice conditions (ridging coverage and heights, potential for lead opening, drift speeds?
• What information and format do you require on wind – i.e. what forecast? • What information and format on water currents (if any)?
• What information and format on swell waves and storms? • What additional information on ice conditions (ice navigation)?
• Are you interested in scenarios (pressure development under certain conditions – wind storm etc)?
Product
• What type of product would help you determine where pressured ice exists or will form?
o Hard copy of charts o Digital charts o Tabulated values o Animations
o Software run locally (i.e. onboard the ship having ability to input real time values of wind speed, direction, etc., therefore getting more accurate forecast).
In addition please indicate:
What information should be provided on the charts and/or animation, etc.? How frequently should the product be made available?
What type of information would you like to query when viewing the pressured ice animation, if applicable?
Would the ISS play a role in this process?
Should the product be distributed through CIS (by fax, or Internet)?
• What should be the length scales covered by the forecast (e.g. tens of km, hundreds of km, etc)?
2.2 Participants in the Survey
The Captains and ship operators that were contacted represent a broad range of the marine sector. These are very experienced Masters that have been involved with ship operations in ice for many years. The list of Captains interviewed is presented in Table 1.
Table 1: List of Captains and Ship Operators Interviewed Name of Captain or Contact person Organization
Capt. John Vanthiel Canadian Coast Guard
Capt. David Snider Canadian Coast Guard
Capt. Broderick Canadian Coast Guard
Capt. David Johns Marine Consultant
Capt. Andrew McNeil Canadian Coast Guard
Capt. Tony Potts Canadian Coast Guard
Capt. Alex MacIntyre Belmar Inc.
Master Bernard Moore Petro-Nav Inc.
Capt. Simpson Petro-Nav Inc.
Mr. Robert Gorman Enfotec Ltd./ Fednav
Several officers Woodward
Mr. Georges Tousignant Nunavut Eastern Arctic Shipping
Capt. Thomas Maher NTCL
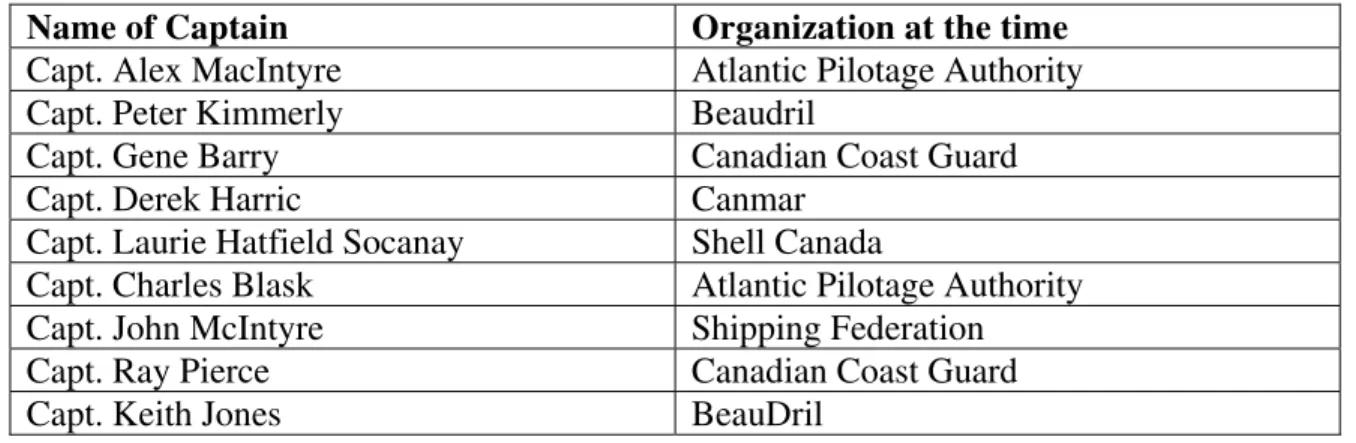
In addition, results of the Ice pressure Scoping Study and Action Plan (Wright and Jones, 1993) are presented in this report. During that scoping study nine Captains were interviewed (Table 2). Their answers obtained during the interviews were not added directly to the results from NRC-CHC questionnaire; rather, the Captains’ comments were included in the study as general overview. A general summary of that scoping study is presented in Appendix A.
Table 2: List of Individuals/ Marine Groups Interviewed during ice pressure Scoping Study (Wright and Jones, 1993)
Name of Captain Organization at the time
Capt. Alex MacIntyre Atlantic Pilotage Authority
Capt. Peter Kimmerly Beaudril
Capt. Gene Barry Canadian Coast Guard
Capt. Derek Harric Canmar
Capt. Laurie Hatfield Socanay Shell Canada
Capt. Charles Blask Atlantic Pilotage Authority
Capt. John McIntyre Shipping Federation
Capt. Ray Pierce Canadian Coast Guard
3. RESULTS OF SURVEY
All Captains agreed that ice pressure can have a significant impact on vessel navigability and that a product providing information on ice pressure development and build-up, as well as occurrence of leads, will significantly contribute to safe navigation through ice covered waters. Not only a forecast of where pressured ice develops is needed - the ability to demonstrate when pressured ice is developing in real time is also desirable. At present time there is not a product providing information on ice pressure development. The indicators such as historic presence, wind and current information, and mostly reports of ice pressure presence by other vessels are used to do a forecast.
The answers are grouped into the 4 sections: Background Information
Questions that will help with model developments Features of proposed forecast of pressured ice conditions Product type and format.
3.1 Background Information
3.1.1 Regions where ice pressure occurs
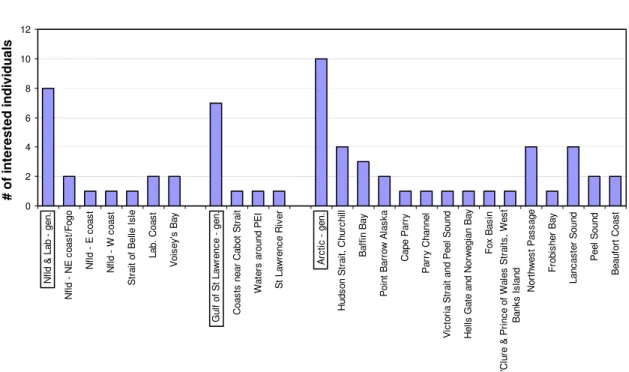
One of the first questions was to determine the regions where ice pressure posses a problem to shipping. There might be areas where pressured ice develops frequently and in a large scale, but as long as this doesn’t interfere with the shipping, there is no need for a forecast of pressured ice development. Figure 3 presents regions of interest for which Captains would like to obtain information on ice pressure development. For the purpose of this study, Canadian waters were divided into 3 regions: Arctic (North of 60°N), Atlantic Canada - Newfoundland and Labrador Coast, and Gulf of St. Lawrence. In addition, some Captains pointed out specific regions in these areas where pressured ice development should be addressed. Lancaster Sound, Beaufort Coast, and Hudson Strait were the areas of most interest in the Canadian Arctic. In Atlantic Canada, pressured ice was of concern mainly in Voisey’s Bay, off the Labrador Coast, and off the North-East Coast and Fogo Island. In the Gulf of St. Lawrence, pressured ice seems to cause problems all over the Gulf. Few Captains pointed to waters around the Prince Edward Island, Coast near the Cabot Strait and St. Lawrence River (approach to the Gulf). The priority in location also depends on the time of year which is directly linked to the traffic density and shipping season. For example on the Beaufort coast the information on pressured ice development is needed in November and July, in Lancaster Sound in November, in Hudson Strait from January to April, and off the Labrador Coast from February to June.
Areas of interest 0 2 4 6 8 10 12 Nf ld & Lab ge n. N fl d N E c o as t/ Fogo N fl d E c oas t Nf ld W c oas t S tr a it o f B e lle Is le L ab. C oa s t Voi s ey 's Bay G u lf of St Lawr enc e gen. Coas ts n ear C abo t St ra it W a te rs a round PE I St Law renc e R iv e r Ar c ti c gen. Huds on St ra it , C hur c h ill Ba ff in B a y Poi n t Bar ro w Al as k a Cape P a rr y P a rr y C hann el Vi c tor ia S tr a it and Peel Soun d Hel ls G a te a nd Nor w e g ian Bay Fox Bas in M 'C lu re & P ri n ce o f W a le s S tr a it s, W e st B a nk s I s land N o rt hwes t Pas s a g e Fr ob is her B a y L anc as te r Sound Peel Sound B e auf o rt C oas t # o f i n ter est ed in d ivi d u al s
Figure 3: Regions of interest
The regions specified by Captains agree well with data obtained from the Ice Regime System database (Figure 1). In the database, the highest concentrationsof pressured ice events were recorded in Hudson Strait, Frosbisher Bay and approach to Hudson Strait, Lancaster Sound, Peel Sound, Franklin Bay, Northeast coast of Newfoundland, and Beaufort Sea Coast in Mackenzie Delta (Liverpool Bay and Mackenzie Bay). The indicated regions of Captains’ interest also agree well with locations of pressured zones in which a vessel was damaged (Figure 2).
3.1.2 Season and conditions during which ice pressure occurs
Pressure development is not only linked to the season, i.e. it is not solely dependent on the time of year. It is dependent on ice concentration, ice breakup, floe size, and driving forces such as currents, tide, swell and wind. Also, proximity of land or adjacent heavier ice field can restrict movement of ice. Ice pressure can form any time of the year with the highest probability of developing in spring.
In some regions pressured ice development is mainly affected by currents, for example in Hudson Strait, Voisey’s Bay and St. Lawrence Seaway, while in some regions pressured ice develops because of wind forcing, such as in Churchill. Air temperature also plays a significant role. In case of the North East Coast of Newfoundland and Labrador Coast large swells play a significant role. Large swells from low pressure in the North Atlantic can cause extreme ice pressure events that are not forecasted. Present forecasts consider only winds and currents, but not the dynamics of ocean swells.
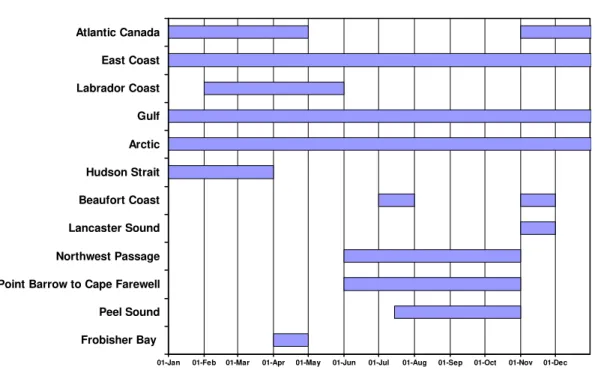
Captains were asked to specify seasons or months during which they would like to have information on ice pressure available. Their answers are summarized in Figure 4. The identified seasons are obviously related to the shipping season. Ice pressure can develop in the identified areas outside the specified season, but if the shipping is not present the forecast doesn’t have to be issued.
Seasons of interest
01-Jan 01-Feb 01-Mar 01-Apr 01-May 01-Jun 01-Jul 01-Aug 01-Sep 01-Oct 01-Nov 01-Dec
Atlantic Canada East Coast Labrador Coast Gulf Arctic Hudson Strait Beaufort Coast Lancaster Sound Northwest Passage Point Barrow to Cape Farewell Peel Sound Frobisher Bay
Figure 4: Seasons of interest to have ice pressure development forecasted
3.1.3 What types of information do you use to forecast ice pressure?
This question was asked to find out which parameters Captains use to estimate where ice pressure can occur or will develop. The answers were: historical presence of pressure, reports of ice pressure by other vessels, ice conditions, wind current, swell and waves, and tide. The importance of the factors affecting pressured development depends on the location. In general Captains use wind and wave forecasts, available tidal and current
information combined with local knowledge of a particular area to forecast pressure events, their severity and duration.
3.1.4 How do you access this information?
Daily and regional ice charts, CIS and NATICE charts
Weather system maps (synopsis every 6 hours in the sub-Arctic vs. 1 – 2 times a day in the Arctic)
Weather and ice forecasts from AES, radio traffic from other vessels
Swell and waves from charts that are issued twice a day and in a text format Surface pressure charts
Tide tables, tide atlas Radio, Internet or navtex,
From met reports.escareg, ice Halifax, ice Quebec, ice Nfld, continuous broadcasts on vhf, weather fax, Coast Guard radio on request, e-mail if possible, fax if
possible
Canadian Weather and Climatic Services Telecom with other vessels/ communities
Nordreg provides operating information and suggested ice-routing upon entry to the Arctic Shipping control Zones above 60 degrees North latitude
3.1.5 Can you use GIS to read ice charts?
This question was presented in order to find what Captains use to read ice charts, how well equipped vessels are, i.e. could they receive digital files (the information on ice pressure development could be delivered as a digital file which could then be overlaid on their GIS system). The answers were proportional, i.e. 50% yes and 50% no. Some of the comments are presented in a bullet form:
Depends on the ship equipment
At present cannot use GIS system, but it would be a wonderful tool. I understand there are quite a few systems available, just to name one, geomatica, which can use raster or vector overlays with info from satellite and radar imagery
Another useful tool is GIS based system IceNav, which ingests e00 and MapInfo MID/MIF files
The Canadian Ice Service presently provides us with Geo Referenced Satellite Imagery ICEVIEW. The recently developed ICE EGG System provides a Geo referenced ice chart which I find very useful for Arctic Operations. The layering of Ice information on our Electronic Chart System is presently being trialed onboard. We can read files on GIS software but downloading large files in a timely fashion
on board is a challenge given our communication equipment. PDF format is easier to access information but it can be done in digital format.
3.1.6 How important it is to have information on ridged/rubble ice in relation to pressured ice
Although ridging and pressure may have occurred in a totally different area, ridging seems to be in most cases a good indicator of pressure. If the area is immobile, ridged ice indicates past presence of pressure. When ice piles up, rafts and ridges, it forms a type of
granular ice that has melded into a solid block. In addition, if air temperature changes, i.e. increases during the day and decreases during night, the pore space between blocks of ice fill up with new ice which glues the blocks together and results in a rigid pile up of ice. This ice is very effective at absorbing the ship’s impact energy and therefore ice damage doesn’t extend very far from the ship. When the ship tries to penetrate the ice, it only disturbs ice in the immediate vicinity of the vessel. In addition the depth to which the vessel can penetrate is reduced. This makes backing and ramming very ineffective. Vessel capability and power can decrease a likelihood of being beset in ice, but this is not guaranteed.
The general rule from a mariner’s perspective is the greater ice thickness the more extensive and difficult ice ridging will be. However there were some instances on the Newfoundland Coast where relatively light ice was transformed by extreme pressure and swell conditions into a layered mass of rubble, which was impossible to penetrate.
In addition information on ocean swell is very important near the ice edge; ocean swell is a major factor in the creation of pressured ice and rubble fields.
3.2 Questions that will help us with model developments
3.2.1 How long does it take for pressure to dissipate when the wind changes or conditions improve?
The time required for ice pressure to dissipate depends on the dynamics of the ice field. Relief could occur very quickly, or could take hours depending on the extent of the ice field in which the ship finds itself. If the field extends for hundreds of miles as would be common in the Arctic Ocean, pressure relief after removal of the driving force may take hours. If the ice field is small, pressure relief may be very quick once the driving force has been removed. Wind is not the only factor causing ice pressure to dissipate. Swell also plays a role, along with tide, current, other driving forces, and type of ice regime under pressure. Wind can die down, but the pressure can persist. Good examples are Botwood and Lewisporte approaches. There the wind (NE) often dies down, but the ice pressure persists. It is the tidal action that causes the ice floes to loosen. The Southwest wind is required to finally push the ice out. In addition, ice pressure dissipates faster with tide change than with change in wind direction.
Pressured ice doesn’t usually break up en masse, instead large slabs and chunks of ice break away, causing the ice edge to recede bit by bit. The pressure at the outside edge of the pressured ice might dissipate right away, but pressure in the interior ice takes longer to subside, especially when enclosed by land. If the pressured ice contains large ice floes, their jostling motion can accelerate the dissipation of pressure and eventual break-up.
3.2.2 What information currently exists that we could make use of in predicting ice pressure?
The aim of this question was to find out what information on ice pressure is available and could eventually be used in developing the technology to predict ice pressure
development. For example are there are any log books recording the vessel performance in pressured ice; events when pressure occurred, etc? One of the comments was that much of the information that is needed to predict where pressured ice occurs in some areas is already available, but needs to be synthesized. Right now, Captains are doing that synthesis by themselves. The answers to what information currently exists are
summarized below:
Log books are the best choice as information is usually recorded when ever a ship is stopped or best in ice. This would provide data on ice pressure occurrence, but not necessarily on individual parameters that contributed to pressure development and the period for which the ice pressure lasted.
Bulletins that are issued to warn of pressured ice conditions. Those types of bulletins have been issued for the last ten years, or longer. Ice Observers might provide the information about these bulletins.
Coast Guard vessels will normally indicate existence of pressure. Not all commercial vessels indicate pressure.
Historical info on pressurized ice can be found through ship’s logs when operating in approaches to Bay of Islands, Cape Freels and north coast of Twillingate. In addition there is a study completed with MV Arctic when transiting near Devon Island.
The only information kept currently aboard merchant ships is a generic log
including ice conditions, but not including pressure information unless an incident caused by pressured ice occurs, when special mention would be made.
Information on ocean swell (sea state charts).
3.3 Features of proposed forecast of pressured ice conditions
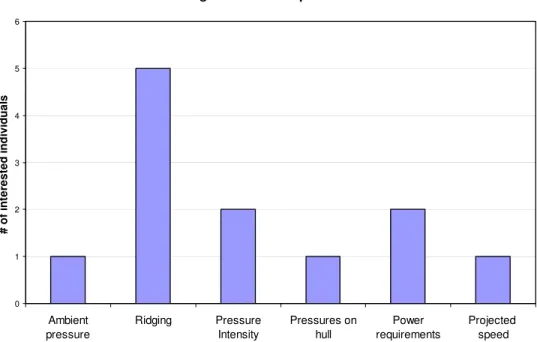
3.3.1 What information may assist in evaluating pressured ice zones
The aim of this question was to find out what information Captains would like to obtain to help them in predicting ice pressured development. Figure 5 provides some of the answers. It is clear that information on presence of ice ridges would greatly contribute to the evaluation of pressured ice zones.
Information assisting evaluation of pressured ice conditions 0 1 2 3 4 5 6 Ambient pressure Ridging Pressure Intensity Pressures on hull Power requirements Projected speed # o f i n ter ested in d iv id u al s
Figure 5: Information that would help in evaluating pressured ice zones
In addition to items shown in Figure 5 the feedback was as follows:
Analysis should be done ashore and provided to mariner as a probability forecast along with meteorological information
Power requirements and speed limits to be decided onboard
Information, based on modeling, on where pressure and currents can occur at various stages of tide cycle. This information combined with overlaid wind regime would be a good pressure indicator product.
Information not only on pressure development, but also on when the pressure will likely subside. A Captain needs such information to plan where a vessel should be at any given time in order to best utilize his time and effort.
Increased forecasting accuracy of individual elements causing pressure. Depth of ridge and possible types of ice within the ridge.
Historical data are extremely important for passage planning. 3.3.2 Ice conditions
The aim of this question was to find out what information and format Captains require on ice conditions. The answers are summarized in bullet form.
Ice concentration and ice type with a factor for ridge concentration. The estimate of ridges per km is not practical since rubbled ice is not well described this way. Potential for lead opening
Type of ice (First-year ice, Multi-year ice) Ice concentration
Ice age/thickness
Pack drift (rate and direction)
Degree of pressure in accordance with established categories (i.e. light, moderate, and severe).
Indicator of the focal point of the pressure 3.3.3 Wind
The aim of this question was to find out what information and format Captains require on wind. The answers are summarized in bullet form.
The existing information is well provided, perhaps with more frequent daily updates
48hr, 36hr, and 24 hr forecast Synoptic
Current wind
Pressure field and wind barbs (CIS has a great product available on their website as shown in Figure 6)
Wind speed and direction, approximate duration, increasing or decreasing, Information on wind shift, direction and intensity, increasing or decreasing
3.3.4 Water current
The aim of this question was to find out what information and format Captains require on water current. The answers are summarized in bullet form.
Information is already well provided
Identification that the current is a factor to pressure ridging if applicable Tide current patterns
Intensity of water current at intermediate levels and information on whether it is subject to tidal currents
3.3.5 Swell waves and storms
The aim of this question was to find out what information and format Captains require on swell waves and storms. The answers are summarized in bullet form.
Information is already well provided (sea state charts); Swell is most important near the ice edge
Storm tracks and projected wave and swell heights Period and significant wave height
Ocean Swell is a major factor in the creation of pressured ice and rubble fields. As of today it has not been considered in forecasting ice conditions.
3.3.6 Additional ice information
The aim of this question was to find out what information on ice conditions would help in navigation and would be of interest to Captains. The answers are summarized in bullet form.
Systematic and compiled reports from other vessels of the presence and severity of pressure
A probability forecast of the future presence of pressure conditions for defined areas, based on an analysis of input data. The development and use of models over time will be required to accomplish this
IceNav
Ice chart closer to real time 3.3.7 Scenarios
The aim of this question was to find out if Captains would be interested in scenarios, i.e. pressure development under certain conditions, for example wind storm, etc. Some Captains would find scenarios helpful, some not. The answers are summarized in bullet form.
Scenario development may be a useful tool over time in developing and prediction models and improving their accuracy
Pressure scenario forecasts would be beneficial for strategic planning Yes, would like to see scenarios under certain weather conditions Perhaps ice movement / coverage scenarios in animation form Not really
We do not believe that a software tool for “predicting” ridging will be useful for mariners as the number of real-time and local inputs of specific conditions needed to be useful to mariners is daunting and we believe not feasible. Efforts would be better directed to documenting real conditions and publishing that actual
information and not likely scenarios. Likely does not aid navigation; in fact it may cause more issues than it solves. Accurate information on navigational
obstructions is what is needed. Predictions of likely events, while interesting, cannot be used to steer a ship through ice-infested waters.
3.4 Product type and format
The aim of this section is to provide information on: what type of product Captains are interested in receiving to help them determine presence of pressured ice and its
development, how frequently the product should be available, how it should be
distributed, and what should be the length scale covered by the product. Answers to the questions asked in “product” section of the questionnaire are presented and discussed below.
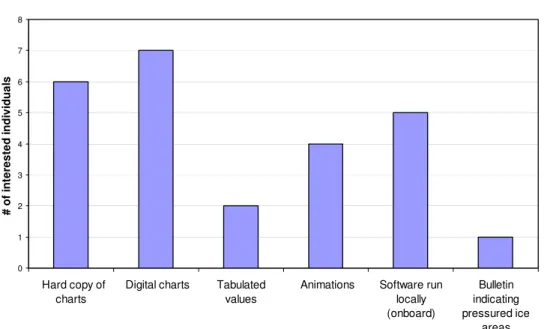
3.4.1 What type of product would help you determine where pressured ice exists or will form?
The aim of this question was to find out what type of product are Captains interested in receiving to help them determine presence of pressured ice and its development. Figure 7 presents the different types of products that they would like to receive. A number of Captains indicated an interest in having digital pressure charts that could be overlaid on maps used by their GIS system, or an avi file (i.e. animation) that would animate ice pressure and leads development. A number of Captains would also be
interested in running stand-alone software onboard the vessel into which they could input real-time parameters observed during the voyage and receive the output based on the parameters they have input into the model. On the other hand, some vessels don’t have tech-savvy equipment onboard, so in that case the hard copy of pressured charts would be the best option.
Pressured ice product 0 1 2 3 4 5 6 7 8 Hard copy of charts
Digital charts Tabulated values
Animations Software run
locally (onboard) Bulletin indicating pressured ice areas # o f i n ter ested in d ivi d u al s
Figure 7: Desired product providing information on ice pressure development In addition to items shown in Figure 7 the feedback was as follows:
Animations should show a history of where pressured ice will form, how quickly it develops and when it is expected to subside. For example, a product with vectors that depict the direction and strength of pressure. Colors should be used to classify the pressure as most severe, moderately severe, and less intense.
User should be able to interrogate the image in case he/she wants to obtain more information about factors that contributed to prediction, such as tidal level, wind speed, current, etc.
Software to run the animation should be made available to the ship allowing Captain to run the model in house. It could be customized for a specific region by letting the end user input relevant parameters. Ideally, the product should be able to be superimposed on his electronic charting system.
Software on board the vessel to run scenarios with wind and current input. Animation and software should be simple, not too complicated.
Text or coded format of a product would be time consuming for the navigator to decipher.
Charts that use vectors or colors to indicate where pressured ice exists should be made available to vessels that cannot run animations or a stand-alone software. These could be either digital or faxed to the vessel. The charts that are to be faxed should have vectors rather than colors since the color cannot be read well when faxed.
Probability forecast should be provided. Use of web based products.
Color charts showing location of ridged thick ice, updated hourly (if possible). Ideally real-time conditions for ridged ice location based on satellite technology. Historical data for reference.
Much of the information that is needed to predict where pressured ice occurs is already available. It needs to be synthesized, because right now Captains are doing the synthesis by themselves. The information available on the tides, swells,
currents, winds and ice (concentration, floe size, thickness) should be consolidated into a product that should be easily viewed and understood by the end user.
3.4.2 How frequently should the product be available? The answers to this question are presented in bullet form:
Forecast should be made available every 6 hours. This time range is especially important in areas where large tidal current is a one of the driving forces.
Charts and Bulletins could be issued every 24 hours.
Routinely with weather information along with updates for serious condition changes (i.e. warnings)
Ice pressure forecast should align with the regularly scheduled weather forecast because of clarity
Updated every hour if possible
Problem in the Arctic is often a reception. The product may be available but in higher Arctic the reception is often difficult.
3.4.3 How should the product be distributed?
The aim of this question was to find out how Captains would like to have the product distributed (i.e. through CIS, by fax, Internet, etc). In general, Captains see the Canadian Ice Service (CIS) playing the lead role in product distribution and/or maintenance of the website from which the product could be downloaded. The answers to the question on product distribution are presented in a bullet form:
Through all normal means including voice along with weather forecast Internet
Through established service provider (i.e. CIS) and made available through fax or Internet
For digital data through FTP or email Bulletins through the weather office
Through Canadian Ice Service, since CIS has a good history of ice forecasting CIS should take the lead in website maintenance and distribution of the product
Through CIS via Nordreg and regional communication centres
3.4.4 Would the Ice Service Specialists (ISS) play a role in this process?
The answers to this question varied based on the product preference. In addition, not all Captains answered this question, perhaps also to the fact that the abbreviation wasn’t spelled out in the questionnaire.
Yes, the ISS already has GIS system that he/she could use to view this type of information and help run the model
No, should be something a navigator can use directly and easily. 3.4.5 What should be the length scales covered by the forecast?
The aim of this question was to find out what should be the length scale of the area covered by the forecast. The answers are presented in a bullet form:
A rational approach would be the establishments of “sensitive zones”. These would be known to all ships. The forecast will be provided for these zones.
Tens of km
The length scale should be based on a 24 hour ship transit (e.g. 24 x 10 kts) Regional – possibly following the same coverage as CIS daily ice charts
CIS ice charts should be hyperlinked, so that more specific information can be obtained for a smaller area as opposed to a larger area as presently indicated on the ice charts available
In case of charts and animations to be published, the smaller the scale the better. The length scale depends on type of the transit a vessel is doing. For example
entering port would require tens while planning a voyage would require hundreds. Some questions included in the questionnaire were used in order to help NRC-CHC with product development at later stage, therefore were not discussed in the text of this report. The complete answers can be found in the Appendix B of this report.
4. SUMMARY
Transport Canada funded a project whose objective is to provide real-time information on ice pressure development to ships operating in the Arctic, in order to minimize safety and operational problems due to such ice conditions. To ensure that the predictive system will provide information that will be of use to the Captains and ship owners and operators, a questionnaire was prepared and distributed to the Captains of vessels that travel through the Canadian Arctic. The main focus of the questionnaire was on topics such as the type of product needed, the geographical regions where pressure ice presents a problem during shipping, and how the product should be distributed to operating vessels. All Captains agreed that ice pressure can have a significant impact on a vessel’s navigability, and that a product providing information on ice pressure development and build-up, as well as information on occurrence of leads, will significantly contribute to safe navigation through ice covered waters. In addition to a forecast of where pressured ice develops, the ability to demonstrate when pressured ice is developing in real-time is desirable.
The locations for which the product on ice pressure occurrence should be provided depend on shipping frequency. In the Canadian Arctic, the most important regions are Lancaster Sound, the Beaufort Coast, and Hudson Strait. In Atlantic Canada, pressured ice is of concern mainly in Voisey’s Bay, off the Labrador Coast, and off the North-East Coast and Fogo Island. In the Gulf of St. Lawrence pressured ice seems to cause
problems all over the Gulf. The priority in location also depends on the time of year, which is directly linked to the traffic density and the shipping season. However, ice pressure development is not solely dependent on the time of year. It is also dependent on ice concentration, ice breakup, floe size, and driving forces such as currents, tide, swell and wind. In addition, the proximity of land or an adjacent heavier ice field can restrict ice movement and cause a build-up of ice pressure. In some regions ice pressure development is mainly affected by currents, while in other pressure is caused by wind forcing. Air temperature also plays a significant role. Large swells from low pressure in the North Atlantic can cause extreme ice pressure events that are not forecasted. Ice pressure is most likely to develop in spring, but can form any time of the year. Basically, ice pressure can develop in any area, but if shipping is not present, there is no need to issue a forecast.
The importance of the factors affecting the development of pressured ice depends on the location. In general, Captains use wind and wave forecasts and available tidal and current information, combined with local knowledge of a particular area, to forecast the severity and duration of pressure events. Information about ice conditions obtained from the Canadian Ice Service (CIS) ice charts is also very important. Although ridging and pressure are not always synonymous, in most cases ridging seems to be a good indicator of pressure. If the area is immobile, ridged ice indicates past presence of pressure. In addition, information on ocean swell is very important near the ice edge where ocean swell may be a major factor in the creation of pressured ice and rubble fields.
The time required for ice pressure to dissipate depends on the dynamics and the extent of the ice field in which the ship finds herself. Wind is not the only factor causing ice pressure to dissipate. Swell also plays a role, along with tide, current, other driving forces, and the type of ice regime under pressure. Ice pressure dissipates faster with tide change than with change in the wind direction. Pressured ice doesn’t usually break as a whole; instead large slabs and chunks of ice break away causing the ice edge to recede bit by bit. The pressure at the outside edge of the ice field might dissipate immediately unlike the pressure at the center of the ice field, especially when enclosed by land. Captains indicated that important information for navigating through areas with potential ice pressure includes the ice concentration and ice type (with a factor for ridge
concentration), potential for lead opening, ice drift speed, degree of ice pressure in accordance with established categories (i.e. moderate, severe, etc), wind speed and direction, wind intensity, information on wind shift and whether wind is increasing or decreasing, intensity of water current at intermediate levels and information on whether it is subject to tidal currents, information on tidal current patterns, storm tracks and
projected wave and swell height.
The type and format of a product that will help Captains determine the presence of pressured ice and its development varies depending on the equipment available at each vessel. A number of Captains indicated an interest in having digital pressure charts that could be overlaid on maps used by their GIS system, or a digital animation showing ice pressure and leads development. A number of Captains would also be interested in running stand-alone software onboard a vessel which would accept and analyze real-time parameters input by the Captains. On the other hand, some vessels don’t have tech-savvy equipment onboard, so in that case a hard copy of pressured ice charts would be the best option. The ice pressure forecast should align with the regularly scheduled weather forecast (6 hours preferably) along with updates for serious conditions (in which case conditions should be updated every hour). The length scale of the area covered by the forecast should be based on a 24-hour ship transit. A suggested approach was the establishment of “sensitive zones” that would be known to all ships and the forecast would be provided for these zones.
The problem in the Arctic is often receiving the information. The product may be available, but in the higher Arctic the reception is often difficult, so this should be taken into account. In general, Captains see the Canadian Ice Service (CIS) playing the lead role in the product distribution and/or maintenance of a website from which the product could be downloaded.
The answers to the questionnaires presented in this report provide a basis for the meeting that will be held between NRC-CHC and CIS. Different options and future steps to address Captains’ and operators’ needs will be discussed at this meeting.
5. ACKNOWLEGEMENT
We are indebted to all Captains and ship operators who provided us with their comments and suggestions. We would like to thank Fiona Robertson from CCG icebreaking
program department for her help in distributing the questionnaire. The support and funding of Transport Canada is gratefully acknowledged.
6. REFERENCES
Brigham, W.L., 2007, Arctic Marine Shipping Assessment (AMSA): Responding to Changing Arctic Marine Access, Presentation at Symposium: Impact of an Ice-Diminishing Arctic on Naval & Marine Operations, Washington, DC, July 2007 CERI, 2004, Economics of High Arctic Gas Development. Report prepared by the Canadian Energy Research Institute for Indian and Northern Affairs Canada. Comiso, J.C., 2002, A Rapidly Declining Perennial Sea Ice Cover in the Arctic. Geophysical Research Letters. Vol.29, No.20, pp.17-1 – 17-4.)
Falkingham, J.C., Chagnon, R., and McCourt, S., 2002, “Trends in Sea Ice in the Canadian Arctic”, Proceedings 16th IAHR International Symposium on Sea Ice, Dunedin, New Zealand, Vol.1, pp 352-359.
Flato, G.M., and Boer, G.J., 2001, Warming Asymmetry in Climate Change Simulations, Geophysical Research Letters, Vo.28, No.1, pp.195-198
Snyder, J.M., 2005, Arctic Sea Ice Thickness: Implications for Arctic Tourism, International Workshop Arctic Sea Ice Thickness – Past, present and Future, Rungstedgaard, Denmark, pp. 229-243.
Timco, G.W. and Morin, I. (1998): “Canadian Ice Regime System Database”,
Proceedings 8th International Offshore and Polar Engineering Conference ISOPE’98, Montreal, P.Q., Canada, Vol II, pp 586-591,.
Timco, G.W. and Kubat, I., 2002, “Scientific Basis for the Ice Regime System: Discussion Paper”, National Research Council of Canada Report CHC-TR-002, TP 13916E, Ottawa, Canada.
Timco, G.W., Gorman, R., Falkingham, J. and O’Connell, B. (2005) Scoping Study: Ice Information Requirements for Marine Transportation of Natural Gas from the High Arctic, Technical Report CHC-TR-029, February 2005
Timco, G.W. and Gorman, R. (2007) Survey of Canadian Arctic Captains: Current Status and Research Needs, Proc 19th International Conference on Ports and Ocean Engineering Under Arctic Conditions (POAC), Dalian, China, Vol.2, pp.695-704
Wadhams Peter, 2008, Arctic Sea Ice changes Under Global Warming, Proceeding of ICETECH Conference, Banff, ICETECH08-140.
APPENDIX A. Summary of Ice Pressure Scoping Study and
Action Plan by Brian Wright & Associates Ltd. and
C.J. Marine & Associates Ltd.
Ice Pressure Scoping Study and Action Plan
One of the objectives of the study prepared by Brian Wright & Associated Ltd. and C.J. Marine & Associated Ltd. in May 1993 was summarizing the effects of ice pressure on marine operations along with related “marine user needs”. This Appendix briefly lists some of the points raised by the experienced Masters and Ice Pilots interviewed during that study.
Ice Pressure Occurrences and Observations
Many factors influence ice pressure, some known, others less known. During discussions with the Masters and Ice Pilots interviewed, the following points were raised:
Frequency
As the ice season progresses and the ice cover continues to grow in thickness and roughness, the frequency of ice pressure events increases. Persistent wind and storm conditions are considered the primary cause of ice pressure occurrences, with wind strength, direction and duration relative to land masses (or the Arctic pack) seen as the most significant factors. However, current and tides, particularly in the vicinity of ports, river estuaries and rivers, are also considered important influences. As such, the
frequency of pressure occurrences is highly variable and depends on the area. The frequency of events ranges from daily, to once per week, to once per storm.
Duration
The duration of ice pressure occurrences also varies widely. Pressure due to tidal influences may only last 4 to 6 hours while pressure due to wind and weather patterns may last 12 to 24 hours or even several days. Ice pressure in river systems may also last days until ice blockage or build-up can be broken. Typical pressure duration was cited as 12 hours, with common and extreme occurrences lasting between 24 and 36 hours and 3 to 5 days (or more) respectively.
Severity
It was generally agreed that the severity of ice pressure is mainly influenced by wind strength in a continued direction, and the type, thickness and roughness of the ice. In river systems, the currents and the ability of ice to flow out, thereby avoiding ice blockage and build-up, were seen as the most significant factors.
Location
Ice pressure occurrences can be experienced anywhere in ice infested waters. The Gulf of St. Lawrence and offshore Newfoundland were indicated as areas with high and frequent
ice pressure occurrence, specifically the confluence of the Saguenay and St. Lawrence Rivers, the St. Lawrence estuary (Escoumaine to Father Point), north or south of Anticosti Island, Quebec north shore, New Brunswick Gulf coast, south and north of Prince Edward Island, west of Canso lock, the west and north coast of Cape Breton Island, Cabot Strait, and the Strait of Belle Isle.
The Arctic was recognized as too large an area to attempt specifics, but prevailing winds, local kabatic effects, tides and currents were cited as important causes of ice pressure. Channels, lee shores and bays were stated to be areas of frequent ice pressure occurrence. Ice pressure predictability
All Masters and Ice Pilots agreed that ice pressure prediction was sometimes obvious, but often difficult. The following information would help in predicting the ice pressure occurrence:
Wind speed, direction and duration Types of ice
Sail height, thickness, size of floes, age Water depth, proximity to land mass Local effects such as tides and currents
In areas involving a fair level of traffic, unexpected ice pressure occurrences were noted as relatively infrequent, due to the fact that ship personnel talk to each other, offer advice and exchange ice information. Areas with less vessel traffic and periods of darkness, poor visibility and storm conditions result in a much higher likelihood of unexpected ice pressure encounters.
In general all mariners agreed that when possible, ice pressure areas should be avoided in terms of preferred routings. Higher resolution, clearer, more detailed ice charts received in a more timely manner including information on ice pressure occurrence and future potential have been identified as needs specific to the ice pressure problem area. Practical Knowledge
In the Newfoundland and Labrador offshore, the overall nature of the ice cover suggests that on shorter time scales and smaller space scales of relevance to ice navigation, pressure can be a very significant influence.
The eastern and central Arctic experiences ice pressure primarily during summer and fall periods. In addition to winds forcing ice against coastal boundaries, local current patterns, large tides, and ice break-up and clearance through various island channels are known as frequent causes of ice pressure.
River outflow and differential movements between the polar and seasonal pack ice areas are also recognized as occasional causes of ice pressure.
From both a practical marine and scientific overview perspective, the main generic observations regarding ice pressure that have been derived from vessel and other experiences can be summarized as follows:
In most areas, the main cause of ice pressure is associated with winds that move and compact ice against a coastal constraint
In order to experience significant pressure, the ice concentrations must be 9+ to 10/10th in the pressured area, the “ice compacting” winds sustained over reasonably long time periods, with considerable upwind “ice fetch”
In areas of high currents or strong tides, convergent ice movements caused by these environmental influences can also cause significant ice pressure and, although these effects are generally considered secondary, can dominate the process in many locales
Major river outflows carrying ice seaward where it meets the offshore ice can also result in zones of frequent and significant ice pressure
Ice pressure does not normally occur until the general ice cover is 20 to 30 cm thick because thin ice tends to raft in response to convergent forces, and is not (at this thickness) capable of sustaining or transmitting significant ice pressures The thickness and strength of the ice cover is important in the magnitude of the
pressures experienced, but do not appear to be dominant parameters
Ice pressure can occur over time scales of tens of minutes to days and over space scales of kilometres to hundreds of kilometres
The time and space associated with pressure occurrences are related to the duration and spacial scale of the wind and other environmental driving forces, and the length scale of the ice floes comprising the ice cover
Dynamic areas that are subjected to storms and complex circulation patterns are very susceptible to frequent and “unanticipated” ice pressure events, while areas that are more slowly varying and well behaved are more predictable in terms of ice pressure occurrences
Ice pressure occurrences are dependent upon season, particularly from an Arctic perspective, where high concentrations of drifting summer ice are usually required before pressure can be experienced
Ice pressure of concern to vessels can also occur at floe boundaries during
individual floe/floe interactions and within large singular floes, when a vessel has cut part way through it
The severity of ice pressure is highly variable and at present, extremely difficult to quantify
From a marine perspective, ice pressure magnitudes are typically categorized as light, moderate, heavy and extreme but these terms are relative to the performance capability of the particular ship experiencing it
From an ice force standpoint, the upper bound for extreme ice pressure occurrences is active ridging against the hull of a beset vessel, where “global” ridge building forces and some localized crushing forces would be representative of expected ice loadings
Pressure can often be anticipated or predicted from a knowledge of the overall character of the ice cover in a given area and the primary environmental forces acting or forecast to act on it, but is not always predictable or explainable, in terms of coming on and coming off
Ice pressure is transient with its persistence varying with the time scales of the wind and other environmental forces acting on the ice cover
In large open Arctic areas, pressure can be transmitted through the ice cover over distances of hundreds of kilometres and be felt by vessels operating in areas that appear relatively quiescent
Although these points may seem intuitively obvious, it is important that work directed toward both ice movement modelling and prediction of pressure areas properly
Captains’ Responses to Questionnaires
This Appendix presents complete answers to the questionnaire as obtained from Captains. The answers are organized by question, i.e. the answers from all Captains to the question #1 “What are the areas of interest (in order of priority)?”are provided first, then the answers from all Captains to the question #2 “What about regions in the high Arctic?” are provided second, etc. The list of Captains and ship operators interviewed is presented in Table 1 of the main report.
Background Information
1. What are the areas of interest (in order of priority)?
¾ In order of priority: 1) all of the Gulf of St. Lawrence, 2) NE Coast Nfld and Fogo Island, 3) Voisey’s Bay and 4) Strait of Belle Isle. Pressured ice is probably also an issue in Churchill and Hudson’s Strait – but you should confirm that. Pressured ice in Hudson Strait likely develops from current, whereas it likely forms because of wind in Churchill.
¾ In Canada, we should address our interest in two separate but complementary areas. The Arctic and Atlantic Canada and the Gulf of St. Laurence. They are
complementary in the sense that both are seasonal and take place in opposing seasons. This allows for a more efficient forecasting structure that concentrates on one area at a time. I.e.: Atlantic and Gulf in the winter and Arctic in the summer. Given that if there is no shipping present, there is no problem and that the affects of pressure ice on shipping is proportional to the density of the shipping activity, the areas of interest (in order of priority) are in my view;
A. Atlantic Canada and the Gulf of St. Laurence, specifically; • The waters around Prince Edward Island.
• The waters around Port Aux Basques Nfld. and Sidney N.S. • The North East Coast of Newfoundland.
• The Western Coast of Newfoundland. • The Gulf of St. Laurence generally • The East Coast of Labrador.
B. The Arctic, specifically; (from west to east) • The waters offshore of Point Barrow Alaska. • The waters offshore of Cape Parry.
• The waters of Victoria Strait and Peel Sound. • The waters of Parry Channel.
• The waters of Hells Gate and Norwegian Bay. • The waters of Baffin Bay.
• The waters of Hudson Strait and the Sea approaches to the Port of Churchill Man.
• If traffic develops as is likely, the waters of M’Clure Strait, Prince of Wales Strait and West Banks Island.
¾ Northwest Passage, Point Barrow to Cape Farewell
¾ Areas of interest would relate to areas where we must deal with escorts. In the Arctic, it would be Frobisher Bay (early season), Lancaster Sounds (late season), Peel Sound (order of priority). Always predominant between shore fast and drift ice.
¾ Labrador Coast (Feb to June), Hudson Strait (Jan to April), Beaufort coast (Nov and July), Lancaster Sound (November).
¾ Gulf of St. Lawrence, Newfoundland & Labrador, Arctic.
¾ St Lawrence river and Gulf, East Coast from Halifax to Labrador and Arctic ¾ For scale of coverage, large scale (small area) would represent locales such as the
NWP, Gulf of St. Lawrence, East Coast NL and Hudson Strait. Small scale (large area) would represent the Beaufort Sea and Baffin Bay for example. There may be local areas of interest such as the approaches to Deception Bay, PQ and Voiseys Bay, NL.
¾ My overall area of interest would be the entire Canadian Arctic and the areas of eastern Canada where sea ice is prevalent.
¾ Our principal geographic area of interest is the Arctic area generally; next is East Coast Canada, the Gulf of St. Lawrence and the St Lawrence River to Montreal. We routinely operate in all areas of the Eastern Arctic including the high Arctic and are developing business opportunities in the Western Arctic. We have operations through the eastern parts of Canada to Montreal.
¾ Generally areas related to Lancaster Sound , Peel Sound and approached to N.W. Passage etc.
2. What about regions in the high Arctic?
¾ The eastern approach to Lancaster Sound can also be an area of high pressure, namely because of the vast area over which the fetch develops in Baffin Bay. In general, fast ice “holds back” the pressure, although pressured ice might form at the ice edge, and work its way back into what was initially level landfast ice.
¾ Answered Above in point 2
¾ Labrador Coast (Feb to June), Hudson Strait (Jan to April), Beaufort coast (Nov and July), Lancaster Sound (November)
¾ Not interested
¾ All regions in high arctic.
¾ My overall area of interest would be the entire Canadian Arctic and the areas of eastern Canada where sea ice is prevalent.
¾ Our principal geographic area of interest is the Arctic area generally; next is East Coast Canada, the Gulf of St. Lawrence and the St Lawrence River to Montreal. We routinely operate in all areas of the Eastern Arctic including the high Arctic and are developing business opportunities in the Western Arctic. We have operations through the eastern parts of Canada to Montreal.
¾ Atlantic Canada and Gulf of St. Laurence, January through April. Arctic, June through November.
¾ June through November
¾ Labrador Coast (Feb to June), Hudson Strait (Jan to April), Beaufort coast (Nov and July), Lancaster Sound (November)
¾ Winter - November to May ¾ all seasons and months
¾ My overall area of interest would be the entire Canadian Arctic and the areas of eastern Canada where sea ice is prevalent
¾ We operate our tanker and freight/ferry fleet continuously from mid April until the end of December and charter some of our ships through the rest of the year. Some of our ferries operate until late December early January in ice-infested waters, but weather conditions prevailing have an impact on operating windows.
¾ Generally mid July through to late October. 4. At what time of year does pressured ice develop?
¾ Pressured ice can form any time of year – but it is most notably in spring (when there is ice!). Pressured ice can form from thin ice (6” thick or less) and thick ice. When thin ice piles up, rafts, ridges, it forms a type of granular ice. This type of ice is broken up, destroyed and has melded into something akin to a solid block of sugar – because this ice is very effective at absorbing the ship’s impact energy, the
damaged zone doesn’t extend very far from the ship. That makes backing and ramming quite ineffective. Brash ice piled high is another problem for shipping. ¾ It is not dependant on a “time of Year”; it is dependant on ice and the pressure
drivers of wind and current being present.
¾ Normally ice pressure will develop late in the Arctic shipping season. ¾ During periods noted above.
¾ Pressured ice develops in mid winter or earlier if there have been many cold days with strong uni-directional wind.
¾ Mostly winter and spring, but can develop in summer months if sufficient ice is present.
¾ In the Arctic, the principal time for us dealing with ice pressure issues is the beginning and end of our shipping season and rarely do we have problems with pressured ice in the Arctic. We would say it is almost irrelevant during the major portion of the shipping season for the Arctic areas we service when we service them. In our experience, wind conditions are relatively calm during the majority of the Arctic shipping season and therefore we have not encountered significant ice pressure problems during our operations. In the Gulf of St. Lawrence/St. Lawrence River and Newfoundland and Labrador regions, we operate for a longer season. We do deal with pressurized ice during our operations but it occurs during the winter season principally on the north east coast of Newfoundland, along the coast of Labrador and intermittently in the gulf region.