Publisher’s version / Version de l'éditeur:
Transactions of the Engineering Institute of Canada, 4, 2, pp. 72-81, 1960-10-01
READ THESE TERMS AND CONDITIONS CAREFULLY BEFORE USING THIS WEBSITE. https://nrc-publications.canada.ca/eng/copyright
Vous avez des questions? Nous pouvons vous aider. Pour communiquer directement avec un auteur, consultez la première page de la revue dans laquelle son article a été publié afin de trouver ses coordonnées. Si vous n’arrivez pas à les repérer, communiquez avec nous à [email protected].
Questions? Contact the NRC Publications Archive team at
[email protected]. If you wish to email the authors directly, please see the first page of the publication for their contact information.
NRC Publications Archive
Archives des publications du CNRC
This publication could be one of several versions: author’s original, accepted manuscript or the publisher’s version. / La version de cette publication peut être l’une des suivantes : la version prépublication de l’auteur, la version acceptée du manuscrit ou la version de l’éditeur.
Access and use of this website and the material on it are subject to the Terms and Conditions set forth at
Loads and load factors
Schriever, W. R.
https://publications-cnrc.canada.ca/fra/droits
L’accès à ce site Web et l’utilisation de son contenu sont assujettis aux conditions présentées dans le site
LISEZ CES CONDITIONS ATTENTIVEMENT AVANT D’UTILISER CE SITE WEB.
NRC Publications Record / Notice d'Archives des publications de CNRC:
https://nrc-publications.canada.ca/eng/view/object/?id=5cd40907-0b85-4e89-b597-c886e988d081
https://publications-cnrc.canada.ca/fra/voir/objet/?id=5cd40907-0b85-4e89-b597-c886e988d081
Ser
,
THI- lNzi.t2
- lno. 1O6
e r 2
BI,DG
NATIONAL RESEARCH COUNCIT
CANADA
DIVISIOI\ OF BUILDING RBSEARCH
BUILDING RESEARCH. LIBRARY
-DEC 2 1960
JNATIONAL RESEARGH cou'tgIL
TOADS AND LOAD F'ACTORS
by
W. R. SCHRIEVER
AI.IATYZEO
REPRINTED FROM
TRANSACTIONS OF THE ENGINEERING INSTITUTE OF CANADA,
vol,. 4. NO. 2. 1960. P.72-81
TECHNICAL PAPER NO. 106
OF THE
DIVISION OF BUILDING RESEARCH
PRICE 25 CENTS
OTTAWA
NRC 5995
OCTOBER 1960
This publication is being distributed by the Division of Building Research of the National Research Council as a contribution towards better building in Canada. It should not be reproduced in whole or in part, without per-mission of the original publisher. The Division would be glad to be of assistance in obtaining such permission.
Publications of the Division of Building Research may be obtained by mailing the appropriate remittance, (a Bank, Express, or Post Office Money Order ot a cheque made payable at par in Ottawa, to the Receiver General of Canada, credit National Research Council) to the National Research Council, Ottawa. Stamps are not acceptable.
A coupon system has been introduced to make payments for publications relatively simple. Coupons are available in denominations of 5,25, atd 50 cents, and may be obtained by making a remittance as indicated above. These coupons may be used for ihe poo"lir.. of all National Research Council publications including specifications of the Canadian Government Specifica-tions Board.
Loads and Load Factors
W. R. Schrievero M.E.I.C.?'ltis paper reaiews sonrc of ilte itttltortant factors thnt affect the safety of stnrctures. Attetttion is directed pdrticularlv tousard statistical ,Laridtions of octual loads on strilctures lnd
sttttistical adriations of the strengtls of strucnnes, *^lticlt to-gctbe'r detenttine tke real margin of safety. The trcatnrent of the question of structural sdfety in tlrc pdst and possihle fttntre ntore rational approdches are discussed in generol tcnns.
(2) Basic coneepts of structural design.
Safety against collapse, deflections
assumptrons.
(b) ^variation in the applied loads rhe magnitude of which usually cannot be predicted accurately.
Mr. Sctrriever is Head, Building Structures Section' Division of Building Research, National Research Council, Ottawa.
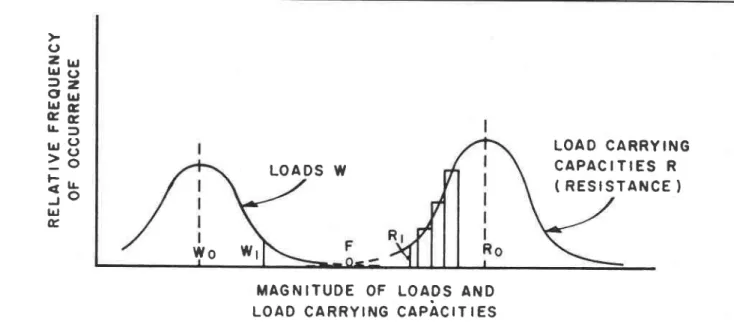
Random Distribution of Strenghs and Loads
(b) Reliability of design method, accuracy of calculations' i.j Work-"nship in thi shop and.in the field. (d) Inspection and control of quality. (e) Deterioration of structure (cor-rosion, etc.).
2. Loadsi (a) Magnitude and control of load. (b) Distribu-tion of the load. (c)-Load combinaDistribu-tions. (d) Load duraDistribu-tion'
Now. r1 is easy to. see rhat if in one srrucrure it happens rhar a very high load.coincides with a very low srrength-a failure may occur as indicated by rhe inrerseciion F of thi two curves or, actually,.by any point in rhe zone of overlapping of tne tarls ot the two cllrves.
"l'actor of Safetytt
upper limit to the load (as is the case wirh snow or wind loads
although very small probability of failure. There is no such thing as absolute safety.
Thus it would appear desirable, as Freudenthalr has pointed out, in principle, to establish a procedure of srucrural-design in which the conventional concepts of safety, factors of safety, load f'actors or allowable stresses do not occur. In fact
will be necessary for some time to retain the concept of "safery", rather than p obabiliry of failure. But it is lioped that more and more engineers i^rill t'i.- safery in terms' of probabiliry of failure.
certain period immediatelv preceding the design such as 'the-
lasi ten I'ears'. Theo'reiically a"choice ca:n only be made afrer a probability of failure has been selected and after it has been established how conservative rhe esd-mate of strength has been.
Thus, reviewing realistically the present common design bases (the present selection of the allowable stress and rhe design load) one might shudder in the face of rhe consequences. But, of course! one consideratioil has, so far, been neglected, the factor of evolution through past experience. The- reason engineers have done well in the past, in spire of the lack of a more rational approach, is thar the values of the allowable stresses have been adiusted, from time to time, on the basis of a consensus on past performance, taking into acmunt known failures of srucrures or the lack of such failures on the one hand and the,improvement, over the years, of the quality of materials used in construction on the other.
Stress Factor vs. Load Factor
Common present elastic design methods in steel use a eertain."srress-factor" (a ratio between the yield point and rhe allowable stress) in contrast to a "load-factort' lwhich
ct Z u J u J ( J r 2 C l s l
uE
l L 3- r 3
= o
i r .
f o
ldc,
L O A D C A R R Y I N G
C A P A C I T I E S R
( R E S I S T A N C E
)
L O A D S W
w o
fY1
M A G N I T U D E
O F L O A D S
A N D
L O A D C A R R Y l N G
C A P I C I T
I E S
specifies a certain ratio ofthe collapse load to the,design load). Although to-day most engineers think in terms of stress-facrors the "load-factor" concept is not new. Professor Pugsley2 pointed out that in the nineteenth century the failure load of cast-iron construction was calculated using the modulus of rupture as a basis. The failure load was requiied to be four times the maximum working load to which the stmcture was expected to be subiected. Laier, when wrought iron and steel came into use and advances in the elastic theory were made, engineers began to think mainly in terms of stresses. At 6rst the ratio of the breaking stress to the working stress was used. Then, it was recogniz-ed that dealing with-ductile materials the use of the ultimate stress was not iustified because the elastic theory was valid only to the limit of proportionaliry. Therefore a more realistic definition of the "factor of safety" as the ratio of the yield stress to the working stress was adopted. But this definition was an improvement for purposes
of elastic analysis only since the load required to produce collapse was not uniformly related to the load producing the. working suess.
It is- very imporunt to appreciate fully the diference between stress-factor md load-.faaor methods of design. This is illustrated in the "Steel Skeleton" by Baker, Horne and Heymans by an example: suppose a structure which is initially unstressed is subiected to a load P producing a maximum
considerably from one structure to another. This has been
o
o
J1 . 6
1 . 4
1 . 2
l . o
O ' 8
o . 6
o . 4
O . 2
o
D E
F L E C T
I O N
Fig. 2. Load-deflection curves showing ratios of colhprc load to yield load (efter Baker et al3).
C A P I T A L C O S T
I N S U R A N C E
A G A I N S T
C O L L
A P S
E
L O A O F A C T O R
Fig. 3. Cost of structure as a function of the load factor.
o
o
o
F 3T'o
(-)
.Is:!-J.ryv-.-W c ' l ' 5 3
w d ' t '1 5
illustrated by Baker, Horne and Heyman by an example in which the load deflection curves for a steel I-beam (Fig. 2) have been plotted for three conditions:
(a) simply supported carrying a uniformly distributed Ioad (b) completely fixed at the supports carrying a uniformlv distributed load, and
(c) completely fixed at its ends carrying two equal point loads at the quarter points.
The vertical scale is plotted in terms of the loads required to produce first yield. It is found that the ratio of the load at collapse to the load at first yield varies between l.l5 and, 1.72. Is it loeical then to relate the factor of safety to the yield stress? Obviously, if strength is considered the design'criterion, it is inadequate to accept an allowable stress as a basis for design. The fact however that allowable stress design does not give a consistent measure of strength does not renier elastic an-alysis useless. The design of structures is a problem of many facets. Particularly in dealing with deflections under working loads elastic thi:ory is esiential. Are deflections likely-to be more critical in structures designed by the plastic method than in those designed elastically? As plastic design will generallv result in lighter sections, deflections at working loads will be higher for the same type of connection. Economv in plastic design is obtained, however, largely by providing rigid joints through welding or high-strength bolts. In many cases this will lead to a reduc-tion in deflecreduc-tion compared to convenreduc-tional riveted structures. It is therefore probable that the over-all effect of plastic design will be to cause a reduction rather than an increase in deflection.
ln an elastically designed structure the stresses at working loads are all su"pposed to be within the elastic range, and therefore deflections should disappear when the loads are removed. In practice, however, part of the deflection will remain because, at some points, the stresses caused by the rvorking load will have exceeded the yield point due to stress concentrations at rivets or residual stresses.
(3) Actual Loade and Probability of Extreme Loade
The great importance of the choice of the design load has already been-pointed out. Since the accuracy of design cannot be better than the accuracy ofthe load assumptions, refinement in the structural analysis cannot make up for crudeness of load analysis.
To make accurate load assumptions extreme loads must be predicted accurately. Such predictions must be based on observations of loads on existing structures. The collection of load records therefore is a matier of first importance as will be discussed later.
For some structures the loads are known accuratelv. for others they are not. For a water tank or a theatre with fixed seats the live loads can be predicted with considerable accuracy. In other cases such as warehouses there is a limited control, whereas for a third category such as strucrures where the whole live load is due to natural causes, there is practically no control over the live load.
Then there is the possibiliry of load combinations. It is conceivable, for example, that in a building all floors could be packed solid with people; at the same time a very high wind could be blowing and the roof might be covered with a deep layer of snow, but the probability of this combination is so small that most designers would discard it. But how far should one go in discarding such loading conditions? Again it is apparent that the problem of extreme loads must be viewed in terms of their probability of occurrence. An obvious difficulrv is the fact thai records of very high load (in the zone of the
tail of the frequency curve, Fig. 1) are rare. Extrapolation is therefore difficult.
If however enough information is available on the loads and also on the streigths, the two histograms can be
approxi-of a suiuble value approxi-of the probability approxi-of failure.
Two answers to this quesdon seem possible. First, the determination of the average probability of failure of existing stmctures, based on the assumption that, on the average, current practice (live loads, allowable stresses) provides structures with that degree of safety which is desired by man in our society. Second, the calculation of the probability by rational means based on economical considerations as suggested
by some given method for a certain condition. If the beam is made lighter its initial cost will decrease, but the cost of insurancl against risk of collapse will increase. If on the other hand the beam is made stronser the initial cost will increase whereas the insurance againJt collapse will decrease due to the recluction in probability of failure. If this were done a point of minimum cost misht be determined (Fig. 3). '
This presenution of the"problem is of course freatly over-simplified and idealized, but it illustrates the problem well. In practice there are numerous difficulties, since so many factors are involved. In view of these difficulties it is not surprising that there are many different views on the prac-ticability of applying the theory ofprobability to the calculation of load factors. One point seems to stand out however. Since
university research, as stated by Baker, Horne and Heyman3. (4) Information on Loads and the National
Building Code
In Canada the vital importance of actual load records for the
in Canada.
The body responsible for the Code is the Associate C-om-mittee on the National Building Code consisting of a group of about twenty expert individuals, engineers, architects, build-ing officials, builders and others who are appointed by the National Research Council. To assist in its work the Asso-ciate Committee has set up three Advisory Groups, dealing with the three main aspects of the Code, public health, fire safety and structural sufficiency. The group concerned with loads is the Advisory Structural Group whose terms of reference are briefly: to keep the Cr;de continually under review, rvith respect to all aspects of structural sufEciency; to ensure that the Code is in accord with the economical use of all common structural materials; to consider new develop-ments in structural design and materials; to advise the
Asso-L A R G E
C I T Y
R O L L I N G
C O U
N T R Y
F L A T
C O U N T R Y
Fr
9
lrj I2 0 0 0 '
l g o o '
I 3 0 0 '
I O O M P Hr o o o '
I
I
I
g o o '
I O O M P HW I N D V E L O C
I T Y
Fig. 4. Wind velocity as a function of height for various ground roughnesses with gradient velocity of lfi) m.p.h. (after Davenportl5).
o
o
o
ciate Committee with regard to desirable changes in those parts of the Code which are in any way concerned with structural sufEciency; and to bring to the attention of the National Research Council's Divis'ion of Building Research special structural problems which the Group considers call for research and investigation in Canada.
During the past few years the Advisory Structural Group has paid considerable attention to the design loads which are stipulated in the National Building Code. Upon their recom-mendation the Division of Buildine Research has undertaken special studies particularly of snow loads on roofs, but also of wind loads, floor loads and earthquake loads.
(a) Snow Loads on Roofs
The numerous roof failures of the winter of 1958-59 caused by snow loads have again reminded everybody of the danger that can be caused by heavy snow loads on roofs. The most trasic failure was that of the Listowel Memorial Arena in which eight people were killed. This collapse was the result of the coincidence of faults in construction, workmanship and design combined with a high load in an unsymmetrical distri-bution. In addition to this failure there were hundreds of less spectacular roof failures particularly in the snow belt area in the Iee of Lake Huron.
It is thus obvious that the specification of snow loads for design purposes is a most important part of any building code in a country like Canada where snow loads are generally the heaviest load to be resisted by roofs. The snow loads given in the Code were based on observations of snow depth on the ground made over the ten years 1941-50 at meteorological stations. The loads were calculated by taking the maximum recorded depth of snow with an assumed specific gravity of 0.2 plus the weight of the maximum 24-hour rainfall which might fall into this snow. From these figures a map was prepared giving computed maximum snow loads on a hori-zontal surface in the form of contour lines from which a designer can determine the specified snow load for any locatioi in Canada.
The shape of the roof is taken into account in two ways bv allowing a reduction for increasing slope and by stating that uniformly or non-uniformly distributed loads in excess of those
specified on the map shall be anticipated where shape, differ-ences in roof level, insulation qualities or orientation of a building, or its proximity to other buildings may cause an unusual accumulation or densification of snow. This latter clause indicates that the selection of the proper design snow Ioad is, even at the present time, not one that can be taken lighdy by any designer as a figure which is set by the autho-rities and over which he has no responsibility.
Observations show, however, that snow depths on the ground are not always truly representativc of snow loads on ioofs. Therefore the Associate Committee on the National Building C.ode asked the Division of Building Research in 1956 to conduct a country-wide survey of actual snow loads on roofs. The main obiectives of this survey were to establish relationships between snow loads on the ground and snow loads on roofs and to assess factors which affect the accumula-tion of snow on roofs so that the effects of wind, shape of building, heat loss, solar radiation, and sheleer on the snow load might be assessed for design purposes, Ieading to a refinement of the snow load requirements of the C-ode and a collection of case records that may be of direct use to
de-(RCAF hangars). At the kev stations both snow depths and density are measured.
Beiause of the r,'ariation in snorvfall fronr )'crr to ycar jt is unrvise after only two -vears of the observations to drav'general conclusions. The results to date, holvever, indicaie the following trends:
(b) Of all the factors affecting snow accumulation on roofs in one area wind is the most important. In some cases it reduces the load, in others it increases the load, the shape of the building and the shelter conditions being the determinins factors. La-rge arched roofs are frequently"sublect to heavi snow accumulatrbns on the leeward side.
(c) Flat roofs without parapets develop a fairly even snow cover which in rvindy locations is less than on rhe ground. Flat roofs with parapets are subiect ro concenrrarions Jf.no* along the parapets whereas the middle ofrhe roofgenerally has a lieht load.
(a) Heat loss through roofs reduces the snow depth parti-cularly in older uninsulated buildings.
On'the whole, the preliminary reirlts of the survey indicate that the design snow loads given in the National Building Code (1953) although representing an over-simplified approach to the problem, can be regarded as a conservarive although not always economical guide for design.
(b) Wind Loadg
In spite of the fact that wind loads represent the major loadings on many high strucrures, civil engineers still use design wind loads which do not apply accurately to the form of structure and do not reflect an accuracy consistent with the present knowledge of wind forces.
The wind forces on a structure result from the differential pressures caused by obstructions to the free flow of wind. Therefore the forces are functions of the velocity of the wind on the one hand and the size, shape and orientation of the structure on the other hand. C-orrespondingly information on wind loads must come from two sources, meteorology and aerodynamics.
The determination of the wind forces on a strucrure is basically a dynamic problem. However, it is current practice in most cases to treat such forces as static loads. This approach is sadsfactory if the relationship between the gust frequencies and the natural frequencies of the structure are such as to allow a static response. This is the case for many buildings.
At present the wind load requirements such as are found in the National Building C,ode are based on three factors: (l) The maximum gust velocity at 30-fr. height (usually obtained from hourly wind mileages multiplied by a "gust factor"). (2) Increase of velocity with height. (3) Shape and orientation of the strucrure. The velocity pressure is
calcu-I
I
I
C A N A D A
lated as the product of a constant depending on the density of the air, the square of the appropriate maximum gust velocity times the velocity height coefficient and the shape factor.
P: 0.002i6 C" (CEI/3a\2
Mailmum gust aelocity dt 30-lt. height: The present design wind velocities are obtained basically fronr. anemometer records taken at about 200 meteorological stations across Canada giving hourly mileages corrected by a gust factor. Records from these stations are available for periods ranging from 1 to 30 years. Unfortunately the anemometers are usually situeted on iop of buildings *hi.h fr"qo.ntly affect aero-dynamically the velociry at the anemometer.
For design purposes hourly mileages are of course not sufEcient. Gust velocities are required. The hourly mileages are therefore corrected by a gust factor which is obtained from correlations made at a number of stations at which both cup and pressure rube anemometers are available, the latter being capable of recording gusts with a duration of a few seconds. The empirical relation used for the figures in the National Building Code was V,:25 +1.22 VM where Z" is the maximum gust velocity and V1a the maximum hourly mileage. These computed maximum gust velocities were then shown as lines of equal velocity in the form of a map in the National Building C-ode.
Increase of oelocity aaith height: lVind velocities near rhe ground are greatly reduced by ground roughness. Only at heishrs of t000 to I 500 feet does wind reach its full velocity, thJgradient velocity, which is unaffected by the friction along the -ground. For the increase of velocity with height th-e l/7th-power law is used in the National Building Code. This is a familiar aerodynamic profile found in wind tunnel investi-gations. Experimental investigations have shown however that there are many variations in nature from this law. If the velocity profile over flat terrain wittr no obstructions is com-pared with that o[ rolling and treed country and that of the middle of a large city it is found that a considerable error ie made by assuming the same velocity height relationship for all cases (see Fig. +). The exponent ofthe power law is found to vary roughly between l/9 znd l/2. DavenportT has suggested an exponenr of l/7 for flat and open country, approximately | /3 .5 for wooded country-side and the outskirts of large cities and approximarely l/2.5- for the centres of large cities-. These variations are reflected in the rather large differences found in the wind load standards of different countries, as shown in a paper by van Erpt (see Fig. 5).
Shape Jacnrs: The influence of the shape and orientation of the structure on the wind pressures developed is expressed by so-called shape factors which indicate by what amount the velocity pressure on a certain surface of a building deviates from the straight velociry pressure either in the positive direction (pressure) or in the negative direction (suction). Shape factors are obtained from wind tunnel tests on small models of buildings. For sharp-edged structures the pressure distribution observed on the models can be applied directly, without scale factor, to any larger scale structure of the same shape.
The values of the shape factors given in the National Building Code were taken largely from the British Standard Code oT Practice which in turti *ere based largely on investi-gations in a laminar flow wind tunnel at the Ni'tional Physical Laboratory ([,ondon, England).
One di{ficulty in making use of the results of these tests is that the distribution of pressures is quite irregular and thus difficult to translate into simple loading cases. AIso any slight change in the shape of the model immediately results in changes in the pressure distribution.
Both positive and negative pressures occur and it is often with -regard to the negative pressures that greatest errors F lrJ lrJ l! o z f o E o UJ o d, F I
9
lrl I 7 0 0 5 0 0 3 0 0r o o
I
I
vro (S)t/r FoR
V 3 9 = 9 0 M P I { U S A ( A M E R I C A N S T A N D . A S S O C . ) B E L G I U M ( I N T E R I O R A N O S E A S H O R E ) N E T H E R L A N O S Io t o 2 0 3 0 4 0 5 0
P S FFig. 5. Velocity pressurer as a function of height difrcrent countriea (after van Erps).
I o o o
4 0 0).g
\ \
:, k]"- -
*\o
O B S E R V E D M A X I M U M L O A O So w H I T E ' s te c o n o i
X D U N H A M . S R E C O R D S O O T T A W A R E C O R D S S P E C I F I E D L O A D S B R I T I S H S T A N O A R O C O D E O F P R A C T I C E I 9 5 2 - O F F I C E S U S E D F O R S T O R A G E A N C F I L I N G P U R P O S E S A M E R I C A N S T A N O A R D S A S S O C I A T I O N A 5 8 - I 1 9 5 5 N A T I O N A L B U I L D I N G C O D E O F C A N A D A 1 9 5 3 F! z o o
tn d) ) o t o o E o o J r,! 40 : : : - : X _ . . - ,' t ' : - . B l l l u . s I G T R D E R S\ o c A M J q 9 t n u c n ax - ' L c o L s . a
F o o r r N G s .
s
--
\ - -
B E A M s
a o r n o e n t
x
2 0Fig. 6. Variation of maximurn office
B A S E D O N W H I T E ' S R E C O R D S r o o 2 0 0 4 0 0
F L O O R A R E A ( S O F T )
floor load with area (observed and Hornell).
r o o 0 2 0 0 0 4 0 0 0 t o o o o
specified). (After Whitee, I)unhamro,
TABLE I(a). Yariations in strength of steel and eonerete (from Julignl3)
TABLE II. I-oad factors for probability of failure PF-IO--4 for log-normal distribution of R and V (frorn Julignra)
Superior frgures in table are values for Pp : 1g-0 R : Strength (resistance)
W : Load effect
r n : Standard deviation of R'l op
Ro : Mean value of R i & : coeff' of variation o r : S t a n d a r d d e v i a t i o r r o f W ) o s , wo : Meanvalue of trz i n: coetl' ol varratron Stcel Yicld Point Concrete Cornp. Strength Good I Poor control I control Struct. Stecl R e i n f . S t e e l
Highest test strength, psi. Mean test strength, psi. Lowest test strength, psi. Standard deviation, psi. Coeff. of variation
Desired min. strength. psi. Number of samples 56,600 +0,000 3 1 .1 0 0 3 , 5 0 0 0 . 0 8 7 3.1,000 3 , 9 7 + 64,900 47 ,700 38,900 .5.950 0 . 1 2 + 40,000 1 a r 6980 5 1 8 0 3 8 1 0 540 0 . 1 0 4 3830 8 6 1 9 1 0 0 .58.50 1500 1540 0.263 4300 296
TABLE I(h). Valiations in traffic loads (trucks over 13 tons). (Frorn Texas Eng. Exptl. Station)
Max. H truck Average H truck Stand. deviation Coeff. of variation No. of trucks 46 tons 2 1 . 1 to n s 5 . 1 t o n s o.238 4530
occur. Very large negativc pressures or suctions do occur in lirnited local areas on many shapes of buildings. Negative pressures develop rvhere the greatest turbulence develops and thus occur particularly at points of sharp projections along the lcading cdges of roofs for instance. Shape factors as low as -4 or - 5 tirlcs have been obsen'ed in very localizcd areas. These suctions are particularly important when designing the fastening of cladding. For roof cladding the National Buitding C-ode gives a shape factor of -2.0. This may however not be conservative. After any strong wind storm there is amplc opportunity to observc and diagnose minor damage particu-larly in rural areas.
(c) Floor Loads
After the difficulties encountered in specifying realistically and adequately the loads due to snow and wind it might appear, at first, that floor loads, which are independent of climate should be easier to formulate. Yet this is not rcally the case. The floor loads given in building codes to-day are essentially estimated only. As with other loads the design loads should be based on observations of actual loads. The collection of such load records, in order to be useful, must be carried out accurately and must cover a large number of each type of occupancy, since large variations in load intensities can be expected. It is understandable therefore that comparatively little work has been donc on this subiect.
The two most extensive survcys published have been that of Whitee in London in 1930 covering eight buildings and that of Dunhamro in Washington in 1916 covering two heavily loaded government office buildings. Both surveys confirmed the gen-eral principlc of decreaJing mean floor load with increasing area. Some of the results of these surveys are shown in Fig. 6 togethcr with some present design load specifications and lines suggested by Dr. Hornerl on the basis of the normal probability curve for a probability of ovcr-loading of I in 1000. Fig. 6 shows that there are considcrable differences betrveen the various approaches.
(5) Load Factors
After the above discussion of the loads and the complications of rational live load assumptions it may be helpful to rcvicrv once more the safety problem in its simplest form rvhich can be stated in strict probability terms: if the probabilities of high load intensities on a structure are knorvn and if the probabilities of low strengths of structures are also known ihe likelihood of failure cin be calculated. Thus the strensth to be provided in a structure dcpends on the choice of ihc probability of collapse.
Two approaches were mentioned earlier. One was a theore-tical method of arriving at a most economical probability of failure (bv designing the structure so as to make its total cost, consisting o[ initial capital cost plus the cost of insurance against collapse, a minimum), the other the calculation of the probability ofcollapse ofexisting structures. The latter method would peimit one- to find out-what probabilities of failure enginccrs have unknowingl,v accepted by using the allowable stresses that are common to-day. An example of this has recently been presented by a Committee on Factors of Safety ;f the American Society of Civil Engineers and reported bv the chairnran, Olivcr Julian, in a first progress reportl3. In this study intcresting inFormation, partly presented earlier by Freudenthall, on the variation in the strength of structural materials and in traffic loads on highway Eridges is given. .\ summary of this information is given in Tables I(a) and I(b).
In the first column of Table I(a), for cxample, it will be seen that the yield point of structural steel varied from 31,100 psi. to 56,600 psi., with a mean of 40,000 psi- The standard deviation was 3500 psi. which wzs 8.7/6 of the mean" This latter figure is called the coefEcient of variation. In the
TABLE III. I)etermination of ultimate load factors. (a). Values of X factors.
B : p vg l l l 2 1 3 t 4 1 3 1 4 5 1 6 1 7 5 1 5 t 7 1 . 9 2 1
r 7
1 9 5 2 2 I A < 1 3 1 .4 5 1 6 , | 7 5 I . ) J 1 7 5 1 9 5 2 1 5 1 8 2 0 5 z 5 Z J J t . l 1 .9 5 2 . 2 2 . 4 5 2 . 0 5 2 . 3 5 2 . 6 5 2 . 9 5 1 A 2 . 7 5 3 1 3 4 5 2 7 5 3 1 5 3 5 5 3 . 9 s 2 4 I 7 < 3 1 3 . 4 5 2 . 1 5 2 3 5 2 6 5 2 9 5 2 l 2 4 z t 3 0A - material, workmanship, inspection and maintenance B - a c c u r a c y o f l o a d i n g a s s u m p l i o n , c o t t t r o l o f u s e C - accrtracy of analysis
TABLE III(b). Values of Y factors.
D - Loss of life due to collapse E - propcrty damage dtte to collapse
orher columns corresponding information on the yield point of reinforcing steel and the compressive strcngth of concrete is shorvn. Inihe columns for concrete the differences betwecn "good" control and "poor" control are noteworthy.-Table
I(b) shows the variations in traffic loads due to heavy trucks measured by the Texas Engineering Experiment Sration.
Table II (also from Julianl3) gives the relationship between the load factors required for design to achieve a
tural steel or reinforced concrete rvith good control) a minimum Ioad factor of 2.62 is required to reduce the probability of failure to 10-a or 1.15 for a probability of failure of 10-6 as shown by the small figures.
It should be emphaiized that in this example the load factor has been taken as the ratio of the failure load to thc mc,rn load and not the design load. This explains why probability of failure seems high. I[, in the example it were assumed that-the design load were the mean tmck load plus twice the
C h a r a c t c r i s t i c
Not serious Serious Very scrious
standard deviation, the design krad would become j I tons This r'vould mean that the load factor for a probabilitv of failure of l0-a would become 1.75, and for l0-6'woulaAiZ.l.
A New Approach
data become available, it will be pcssible ro increase the statistical contribution to judgemenf. Improvement will not come overnight - it will require an active interest and an active discussion by the profcssion. Then, step by step, rhere will be adoption in codes and specifications. An example of an excellent step in the new approach to load factors has been suggested recenrly in a "Report on Structural Safety"tr 6t t special committee of . the British Institution of Structural F.ngineers. The report suggests the selection of two load lactors:
(t) Uhimate Load Factor, or rhe rario of the collapse load ro the appropriate workinq load.
(b) Limiting Load Factor, or latio of the load at which some limiting condition such as excessive deflection or cracking first arises, to the appropriate working load.
Of these two factors rhe ultimate load factor is considered of primary importance and it is for this factor that rhe follow-ing system of selection applies.
The choice of the load factor for the design of a given structure is based on the assessment of a numbcr of factors which are grouped as follows:
Group X - Probability of collapsr
A. Material, worl<manship, inspection, mainrenance B. Accuracy of loading assumption, control of use C. Accuracy of analysis, type of structure Group Y - Seriousness of collapse
D. Danger" to human life E. Economic losses.
In each factor there is considerable variation in the field. For example, under factor A dealing with materials and workmanship, there may be at one extreme, a structure btrilt from ductile materials produced with a high degree of conrrol, fabricated and erected by skilled men under efEcient super-vision, under opdmum weather conditions, with effeciive maintenance after completion of the stmcture, whereas, at the other extreme, there may be a strucrure which is made from poorly known or poorly controlled marerial, erected by unskilled labour, under poor supervision, in bad wearher wirh Iittle attention to maintenance durinp its life. If each factor is described by a certain scoring sy.t.ir a quanritative approach to the probability and consequences of collapse is possible.
Suppose that each factor in the X group is given one of four ratings: very good (vg), good (g), fair (Q, poor (p).Where design and construction is in accordance with generally ac-cepted codes and specifications the radngs for all charac-reristics A, B and C will normally be "g", good. A rating ''vg",
very good, would only be given in exceptional cases, as for in.stance for factor B when the loadine is known within very close limits such as the hydrosratic loading in a water tank.
With regard to the group Y dealing with the consequences of a collapse, three ratings for factors D and E are esrablished: not serious (ns). serious (s), very serious (vs).
Based on this scoring system the committee responsible for this proposal established numerical values for rhe various factors. The ultimate load factor is obtained by multiplying the X factor obtained from Table III(a) with'the Y factoi obtained from Table III(b).
To appreciate how the system works a numbcr of examples are given below.
(a) -Reinforced concrete water tank designed fbr a water supply in a courtry district.
A : g , B : v g , C : g , D : n s , E : s .
X : 1.45, Y : 1.1. Therefore load factor : 1.60. (b) Gallery for a theatre in structural steel.
A : g , B : v g , C : g , I ) : v s r E : s .
X : 1.45, Y : 1.5. Therefore load factor : 2.18. (c) Load bearing walls in brick masonry built in a small
commuruty.
A : p , B : g , C : p , D : v s , E : s .
X : 2.95, Y : 1.5. Therefore Ioad facror : 4.4. It is thus easy to see how the system works and how, depending on the conditions, the load factor varies. For the case, for instance, that factors A, B and C are all found to be "good", such as found in regular structural steel work under well known conditions, and that the consequences of collapse are "not serious" the load factor is 1 .7 5 . If , on the other hand, the consequences of collapse are "serious", the load facror is 2.25.If this is compared with the load factors used for plastic design at the present time (1.85 on this Continenr,
1.75 in Britain) close agreement is found, as would be expected since the values of the table were based on an assessment of a number of typical stnrctures by each of the members of the committee and thus would tend to reflect a tradidonal level in load factors. The main and very important advantage of the tabular systeil. however. is the differentiation between conditions defending on the five factors used.
(6) Conclusions
It has been pointed out that no structure, no matter how conservativelv designed and how well constructed, offers absolute safery. Every structure has some finite probabiliry of failure, although it may be very small, of the order of 10-0. I-oads and strengths used in design are not fixed quantities limits of which can be predicted, since, if one waits long enough, records will always be broken. The probabilities of extremes in loads and strength are the significant valnes. The safety of a structure cannot adequately be expressed by a "safety factor". Only if the probability of extreme loads and the probability of eitremes of lo* rtiength are known, can the real probability of failure be stated. Thus the problem is reduced to a choice of probability of failure. A theoretical approach to the choice o'f th* -oi, economical probability of failure has been mentioned.
However, in view of the difficulties of taking a completely statistical approach to the problem, intermediate steps are required. A simple tabular method proposed by the Institution ofStructural Engineers has been presented. This is an excellent example ofhow the problem could be handled.
At present the load factor for plastic design is chosen by the expedient of relating it to the actual load factor against collapse of a simply-supported bearn designed elastically (.1.85 or. 1.75). This approach has some merits at the present tlme as rt retalns some of the benefits of past experience and also because it separates the question of adoption of plastic design as a method from that of a change in margin of safery. New approaches to loads and load factors are being tried in many countries. Such a new approach must accompany new design methods such as plastic design in steel to make these methods frrlly effective. The general adoption of these new approaches to design, loads and safety will require the best thinking and an active interest by all engineers.
REFERENCES
(l) Freudenthal, A. M., "Safety and the probability of struc-tural failure". Proc. Amer. Soc. Civ. Eng., uoi. 80, 1954, Separate No. 468.
(2) Pugsley, - A. G., "Concepts of Safery in Structural Engineering", J. Inst. Civ. Eng., vol. 36, no. 5, March
195 l.
(3) Baker, J. F., Horne, M. R., Heyman, J., "The Steel Skeleton", Cambridge University Press, 1956, ,108 pp. (,1) Torroja, E.,Peez, A., "Calcul de coefficient de Seciriit6",
I.A.B.S.E., 4th Consress. 19i2. preliminarv publication. (5) Johnson, Arne I., ""Strength,' Safety
"nd ii,conomical Dimensions of Structures". Stockholm, Statens Kommit-tee for Byggnadsforskning, 1953, Meddelanden no, 22, P. 16.
(6) National Building Code of Ca:na.da (1953): National Re-search Council, Ottawa, Ont.
(7) Davenport, A. G., "A Rationale for Determining Design Wind Velocities". Proc. Amer. Soc. Civ. Eng,, vol. 86, ST 5, May 1960, p. 39-68.
(8) Van Erp, J. W. T., "Wind Load Standards in Europe".
Proc. Amer. Soc. Gv. Eng., Struct. Div., vol. 76, Nov. 1950, Separate No. 42.
(9) White, C. M., "Survey of Live Loads irr Offices". First Interim Report, Steel Structures Research Committee, L o n d o n , 1 9 3 1 .
(10) Dunham, J. W., "Design Live Loads in Buildings'?. Trans. Amer. Soc. Civ. Eng., vol. ll2, L9+7.
(11) Horne, M. R., "The Variation of Mean,Floor Loads with Area". Engineeri.ng, vol. 171, Feb. 1951, pp. 179-182. (12) Burton, F., "A concise history of building codes from
the earliest days". Engineering and Contracti.ng, vol. 68, no. 2, Feb. 1929, pp. 82-85.
(13) Julian, O. G., Synopsis of First Progress Report of Committee on Factors of Safetv. Proc. Amer: Soc. Civ. Eng., Struct. Div,, vol. 83, Separate No. 1316, July 1957. (1,$) Institution of Strucrural Engineers, report on suuctural
.safety. The.Structural Engineer, vol. 34, no.5, May 1955, pp. 141-149.
(15) Davenport, A. G., "Wind Loads on Strucrures". National Research Council, Division of Building Re-search, Ottawa. March 1%0. NRC 5576.
ffiqqNEB
A list of all publications of the Division of Building Research is available and may be obtained from the Publications Section, Division of Building Research, National Research Council, Ottawa; Canada.