arXiv:hep-ex/0608019v1 7 Aug 2006
BABAR-CONF-06/028 SLAC-PUB-12018
A Search for B
+→ τ
+ν Recoiling Against B
−→ D
0ℓ
−ν
¯
ℓX .
The
B
AB
ARCollaboration June 12, 2018Abstract
We present a search for the decayB+→ τ+ν
τusing 288 fb−1of data collected at theΥ (4S) resonance with theBABARdetector at the SLAC PEP-IIB-Factory. A sample of events with one reconstructed semileptonic B decay (B−→ D0ℓ−ν¯ℓX) is selected, and in the recoil a search for B+→ τ+ντsignal is performed. The
τ is identified in the following channels: τ+ → e+ν
e¯ντ,τ+ → µ+νµν¯τ,τ+ → π+ν¯τ andτ+ → π+π0ν¯τ. We measure a branching fraction ofB(B+→ τ+ντ) = (0.88+0.68−0.67(stat.) ± 0.11(syst.)) × 10−4and extract an upper limit on the branching fraction, at the 90% confidence level, ofB(B+→ τ+ντ) < 1.8 × 10⁻⁴. We calculate the product of theB meson decay constant and |Vub| to be fB·|Vub| = (7.0+2.3−3.6(stat.)+0.4−0.5(syst.))×
10−4GeV.
Submitted to the 33rdInternational Conference on High-Energy Physics, ICHEP 06, 26 July—2 August 2006, Moscow, Russia.
Stanford Linear Accelerator Center, Stanford University, Stanford, CA 94309
TheBABARCollaboration,
B. Aubert, R. Barate, M. Bona, D. Boutigny, F. Couderc, Y. Karyotakis, J. P. Lees, V. Poireau, V. Tisserand, A. Zghiche
Laboratoire de Physique des Particules, IN2P3/CNRS et Universit´e de Savoie, F-74941 Annecy-Le-Vieux, France
E. Grauges
Universitat de Barcelona, Facultat de Fisica, Departament ECM, E-08028 Barcelona, Spain
A. Palano
Universit`a di Bari, Dipartimento di Fisica and INFN, I-70126 Bari, Italy
J. C. Chen, N. D. Qi, G. Rong, P. Wang, Y. S. Zhu
Institute of High Energy Physics, Beijing 100039, China
G. Eigen, I. Ofte, B. Stugu
University of Bergen, Institute of Physics, N-5007 Bergen, Norway
G. S. Abrams, M. Battaglia, D. N. Brown, J. Button-Shafer, R. N. Cahn, E. Charles, M. S. Gill, Y. Groysman, R. G. Jacobsen, J. A. Kadyk, L. T. Kerth, Yu. G. Kolomensky, G. Kukartsev, G. Lynch, L. M. Mir, T. J. Orimoto,
M. Pripstein, N. A. Roe, M. T. Ronan, W. A. Wenzel
Lawrence Berkeley National Laboratory and University of California, Berkeley, California 94720, USA
P. del Amo Sanchez, M. Barrett, K. E. Ford, A. J. Hart, T. J. Harrison, C. M. Hawkes, S. E. Morgan, A. T. Watson
University of Birmingham, Birmingham, B15 2TT, United Kingdom
T. Held, H. Koch, B. Lewandowski, M. Pelizaeus, K. Peters, T. Schroeder, M. Steinke
Ruhr Universit¨at Bochum, Institut f¨ur Experimentalphysik 1, D-44780 Bochum, Germany
J. T. Boyd, J. P. Burke, W. N. Cottingham, D. Walker
University of Bristol, Bristol BS8 1TL, United Kingdom
D. J. Asgeirsson, T. Cuhadar-Donszelmann, B. G. Fulsom, C. Hearty, N. S. Knecht, T. S. Mattison, J. A. McKenna
University of British Columbia, Vancouver, British Columbia, Canada V6T 1Z1
A. Khan, P. Kyberd, M. Saleem, D. J. Sherwood, L. Teodorescu
Brunel University, Uxbridge, Middlesex UB8 3PH, United Kingdom
V. E. Blinov, A. D. Bukin, V. P. Druzhinin, V. B. Golubev, A. P. Onuchin, S. I. Serednyakov, Yu. I. Skovpen, E. P. Solodov, K. Yu Todyshev
Budker Institute of Nuclear Physics, Novosibirsk 630090, Russia
D. S. Best, M. Bondioli, M. Bruinsma, M. Chao, S. Curry, I. Eschrich, D. Kirkby, A. J. Lankford, P. Lund, M. Mandelkern, R. K. Mommsen, W. Roethel, D. P. Stoker
University of California at Irvine, Irvine, California 92697, USA
S. Abachi, C. Buchanan
University of California at Los Angeles, Los Angeles, California 90024, USA
S. D. Foulkes, J. W. Gary, O. Long, B. C. Shen, K. Wang, L. Zhang
H. K. Hadavand, E. J. Hill, H. P. Paar, S. Rahatlou, V. Sharma
University of California at San Diego, La Jolla, California 92093, USA
J. W. Berryhill, C. Campagnari, A. Cunha, B. Dahmes, T. M. Hong, D. Kovalskyi, J. D. Richman
University of California at Santa Barbara, Santa Barbara, California 93106, USA
T. W. Beck, A. M. Eisner, C. J. Flacco, C. A. Heusch, J. Kroseberg, W. S. Lockman, G. Nesom, T. Schalk, B. A. Schumm, A. Seiden, P. Spradlin, D. C. Williams, M. G. Wilson
University of California at Santa Cruz, Institute for Particle Physics, Santa Cruz, California 95064, USA
J. Albert, E. Chen, A. Dvoretskii, F. Fang, D. G. Hitlin, I. Narsky, T. Piatenko, F. C. Porter, A. Ryd, A. Samuel
California Institute of Technology, Pasadena, California 91125, USA
G. Mancinelli, B. T. Meadows, K. Mishra, M. D. Sokoloff
University of Cincinnati, Cincinnati, Ohio 45221, USA
F. Blanc, P. C. Bloom, S. Chen, W. T. Ford, J. F. Hirschauer, A. Kreisel, M. Nagel, U. Nauenberg, A. Olivas, W. O. Ruddick, J. G. Smith, K. A. Ulmer, S. R. Wagner, J. Zhang
University of Colorado, Boulder, Colorado 80309, USA
A. Chen, E. A. Eckhart, A. Soffer, W. H. Toki, R. J. Wilson, F. Winklmeier, Q. Zeng
Colorado State University, Fort Collins, Colorado 80523, USA
D. D. Altenburg, E. Feltresi, A. Hauke, H. Jasper, J. Merkel, A. Petzold, B. Spaan
Universit¨at Dortmund, Institut f¨ur Physik, D-44221 Dortmund, Germany
T. Brandt, V. Klose, H. M. Lacker, W. F. Mader, R. Nogowski, J. Schubert, K. R. Schubert, R. Schwierz, J. E. Sundermann, A. Volk
Technische Universit¨at Dresden, Institut f¨ur Kern- und Teilchenphysik, D-01062 Dresden, Germany
D. Bernard, G. R. Bonneaud, E. Latour, Ch. Thiebaux, M. Verderi
Laboratoire Leprince-Ringuet, CNRS/IN2P3, Ecole Polytechnique, F-91128 Palaiseau, France
P. J. Clark, W. Gradl, F. Muheim, S. Playfer, A. I. Robertson, Y. Xie
University of Edinburgh, Edinburgh EH9 3JZ, United Kingdom
M. Andreotti, D. Bettoni, C. Bozzi, R. Calabrese, G. Cibinetto, E. Luppi, M. Negrini, A. Petrella, L. Piemontese, E. Prencipe
Universit`a di Ferrara, Dipartimento di Fisica and INFN, I-44100 Ferrara, Italy
F. Anulli, R. Baldini-Ferroli, A. Calcaterra, R. de Sangro, G. Finocchiaro, S. Pacetti, P. Patteri, I. M. Peruzzi,1
M. Piccolo, M. Rama, A. Zallo
Laboratori Nazionali di Frascati dell’INFN, I-00044 Frascati, Italy
A. Buzzo, R. Capra, R. Contri, M. Lo Vetere, M. M. Macri, M. R. Monge, S. Passaggio, C. Patrignani, E. Robutti, A. Santroni, S. Tosi
Universit`a di Genova, Dipartimento di Fisica and INFN, I-16146 Genova, Italy
1
G. Brandenburg, K. S. Chaisanguanthum, M. Morii, J. Wu
Harvard University, Cambridge, Massachusetts 02138, USA
R. S. Dubitzky, J. Marks, S. Schenk, U. Uwer
Universit¨at Heidelberg, Physikalisches Institut, Philosophenweg 12, D-69120 Heidelberg, Germany
D. J. Bard, W. Bhimji, D. A. Bowerman, P. D. Dauncey, U. Egede, R. L. Flack, J. A. Nash, M. B. Nikolich, W. Panduro Vazquez
Imperial College London, London, SW7 2AZ, United Kingdom
P. K. Behera, X. Chai, M. J. Charles, U. Mallik, N. T. Meyer, V. Ziegler
University of Iowa, Iowa City, Iowa 52242, USA
J. Cochran, H. B. Crawley, L. Dong, V. Eyges, W. T. Meyer, S. Prell, E. I. Rosenberg, A. E. Rubin
Iowa State University, Ames, Iowa 50011-3160, USA
A. V. Gritsan
Johns Hopkins University, Baltimore, Maryland 21218, USA
A. G. Denig, M. Fritsch, G. Schott
Universit¨at Karlsruhe, Institut f¨ur Experimentelle Kernphysik, D-76021 Karlsruhe, Germany
N. Arnaud, M. Davier, G. Grosdidier, A. H¨ocker, F. Le Diberder, V. Lepeltier, A. M. Lutz, A. Oyanguren, S. Pruvot, S. Rodier, P. Roudeau, M. H. Schune, A. Stocchi, W. F. Wang, G. Wormser
Laboratoire de l’Acc´el´erateur Lin´eaire, IN2P3/CNRS et Universit´e Paris-Sud 11, Centre Scientifique d’Orsay, B.P. 34, F-91898 ORSAY Cedex, France
C. H. Cheng, D. J. Lange, D. M. Wright
Lawrence Livermore National Laboratory, Livermore, California 94550, USA
C. A. Chavez, I. J. Forster, J. R. Fry, E. Gabathuler, R. Gamet, K. A. George, D. E. Hutchcroft, D. J. Payne, K. C. Schofield, C. Touramanis
University of Liverpool, Liverpool L69 7ZE, United Kingdom
A. J. Bevan, F. Di Lodovico, W. Menges, R. Sacco
Queen Mary, University of London, E1 4NS, United Kingdom
G. Cowan, H. U. Flaecher, D. A. Hopkins, P. S. Jackson, T. R. McMahon, S. Ricciardi, F. Salvatore, A. C. Wren
University of London, Royal Holloway and Bedford New College, Egham, Surrey TW20 0EX, United Kingdom
D. N. Brown, C. L. Davis
University of Louisville, Louisville, Kentucky 40292, USA
J. Allison, N. R. Barlow, R. J. Barlow, Y. M. Chia, C. L. Edgar, G. D. Lafferty, M. T. Naisbit, J. C. Williams, J. I. Yi
University of Manchester, Manchester M13 9PL, United Kingdom
C. Chen, W. D. Hulsbergen, A. Jawahery, C. K. Lae, D. A. Roberts, G. Simi
University of Maryland, College Park, Maryland 20742, USA
G. Blaylock, C. Dallapiccola, S. S. Hertzbach, X. Li, T. B. Moore, S. Saremi, H. Staengle
R. Cowan, G. Sciolla, S. J. Sekula, M. Spitznagel, F. Taylor, R. K. Yamamoto
Massachusetts Institute of Technology, Laboratory for Nuclear Science, Cambridge, Massachusetts 02139, USA
H. Kim, S. E. Mclachlin, P. M. Patel, S. H. Robertson
McGill University, Montr´eal, Qu´ebec, Canada H3A 2T8
A. Lazzaro, V. Lombardo, F. Palombo
Universit`a di Milano, Dipartimento di Fisica and INFN, I-20133 Milano, Italy
J. M. Bauer, L. Cremaldi, V. Eschenburg, R. Godang, R. Kroeger, D. A. Sanders, D. J. Summers, H. W. Zhao
University of Mississippi, University, Mississippi 38677, USA
S. Brunet, D. Cˆot´e, M. Simard, P. Taras, F. B. Viaud
Universit´e de Montr´eal, Physique des Particules, Montr´eal, Qu´ebec, Canada H3C 3J7
H. Nicholson
Mount Holyoke College, South Hadley, Massachusetts 01075, USA
N. Cavallo,2G. De Nardo, F. Fabozzi,3C. Gatto, L. Lista, D. Monorchio, P. Paolucci, D. Piccolo, C. Sciacca
Universit`a di Napoli Federico II, Dipartimento di Scienze Fisiche and INFN, I-80126, Napoli, Italy
M. A. Baak, G. Raven, H. L. Snoek
NIKHEF, National Institute for Nuclear Physics and High Energy Physics, NL-1009 DB Amsterdam, The Netherlands
C. P. Jessop, J. M. LoSecco
University of Notre Dame, Notre Dame, Indiana 46556, USA
T. Allmendinger, G. Benelli, L. A. Corwin, K. K. Gan, K. Honscheid, D. Hufnagel, P. D. Jackson, H. Kagan, R. Kass, A. M. Rahimi, J. J. Regensburger, R. Ter-Antonyan, Q. K. Wong
Ohio State University, Columbus, Ohio 43210, USA
N. L. Blount, J. Brau, R. Frey, O. Igonkina, J. A. Kolb, M. Lu, R. Rahmat, N. B. Sinev, D. Strom, J. Strube, E. Torrence
University of Oregon, Eugene, Oregon 97403, USA
A. Gaz, M. Margoni, M. Morandin, A. Pompili, M. Posocco, M. Rotondo, F. Simonetto, R. Stroili, C. Voci
Universit`a di Padova, Dipartimento di Fisica and INFN, I-35131 Padova, Italy
M. Benayoun, H. Briand, J. Chauveau, P. David, L. Del Buono, Ch. de la Vaissi`ere, O. Hamon, B. L. Hartfiel, M. J. J. John, Ph. Leruste, J. Malcl`es, J. Ocariz, L. Roos, G. Therin
Laboratoire de Physique Nucl´eaire et de Hautes Energies, IN2P3/CNRS, Universit´e Pierre et Marie Curie-Paris6, Universit´e Denis Diderot-Paris7, F-75252 Paris, France
L. Gladney, J. Panetta
University of Pennsylvania, Philadelphia, Pennsylvania 19104, USA
M. Biasini, R. Covarelli
Universit`a di Perugia, Dipartimento di Fisica and INFN, I-06100 Perugia, Italy
2
Also with Universit`a della Basilicata, Potenza, Italy
3
C. Angelini, G. Batignani, S. Bettarini, F. Bucci, G. Calderini, M. Carpinelli, R. Cenci, F. Forti, M. A. Giorgi, A. Lusiani, G. Marchiori, M. A. Mazur, M. Morganti, N. Neri, E. Paoloni, G. Rizzo, J. J. Walsh
Universit`a di Pisa, Dipartimento di Fisica, Scuola Normale Superiore and INFN, I-56127 Pisa, Italy
M. Haire, D. Judd, D. E. Wagoner
Prairie View A&M University, Prairie View, Texas 77446, USA
J. Biesiada, N. Danielson, P. Elmer, Y. P. Lau, C. Lu, J. Olsen, A. J. S. Smith, A. V. Telnov
Princeton University, Princeton, New Jersey 08544, USA
F. Bellini, G. Cavoto, A. D’Orazio, D. del Re, E. Di Marco, R. Faccini, F. Ferrarotto, F. Ferroni, M. Gaspero, L. Li Gioi, M. A. Mazzoni, S. Morganti, G. Piredda, F. Polci, F. Safai Tehrani, C. Voena
Universit`a di Roma La Sapienza, Dipartimento di Fisica and INFN, I-00185 Roma, Italy
M. Ebert, H. Schr¨oder, R. Waldi
Universit¨at Rostock, D-18051 Rostock, Germany
T. Adye, N. De Groot, B. Franek, E. O. Olaiya, F. F. Wilson
Rutherford Appleton Laboratory, Chilton, Didcot, Oxon, OX11 0QX, United Kingdom
R. Aleksan, S. Emery, A. Gaidot, S. F. Ganzhur, G. Hamel de Monchenault, W. Kozanecki, M. Legendre, G. Vasseur, Ch. Y`eche, M. Zito
DSM/Dapnia, CEA/Saclay, F-91191 Gif-sur-Yvette, France
X. R. Chen, H. Liu, W. Park, M. V. Purohit, J. R. Wilson
University of South Carolina, Columbia, South Carolina 29208, USA
M. T. Allen, D. Aston, R. Bartoldus, P. Bechtle, N. Berger, R. Claus, J. P. Coleman, M. R. Convery, M. Cristinziani, J. C. Dingfelder, J. Dorfan, G. P. Dubois-Felsmann, D. Dujmic, W. Dunwoodie, R. C. Field, T. Glanzman,
S. J. Gowdy, M. T. Graham, P. Grenier,4V. Halyo, C. Hast, T. Hryn’ova, W. R. Innes, M. H. Kelsey, P. Kim,
D. W. G. S. Leith, S. Li, S. Luitz, V. Luth, H. L. Lynch, D. B. MacFarlane, H. Marsiske, R. Messner, D. R. Muller, C. P. O’Grady, V. E. Ozcan, A. Perazzo, M. Perl, T. Pulliam, B. N. Ratcliff, A. Roodman, A. A. Salnikov,
R. H. Schindler, J. Schwiening, A. Snyder, J. Stelzer, D. Su, M. K. Sullivan, K. Suzuki, S. K. Swain, J. M. Thompson, J. Va’vra, N. van Bakel, M. Weaver, A. J. R. Weinstein, W. J. Wisniewski, M. Wittgen,
D. H. Wright, A. K. Yarritu, K. Yi, C. C. Young
Stanford Linear Accelerator Center, Stanford, California 94309, USA
P. R. Burchat, A. J. Edwards, S. A. Majewski, B. A. Petersen, C. Roat, L. Wilden
Stanford University, Stanford, California 94305-4060, USA
S. Ahmed, M. S. Alam, R. Bula, J. A. Ernst, V. Jain, B. Pan, M. A. Saeed, F. R. Wappler, S. B. Zain
State University of New York, Albany, New York 12222, USA
W. Bugg, M. Krishnamurthy, S. M. Spanier
University of Tennessee, Knoxville, Tennessee 37996, USA
R. Eckmann, J. L. Ritchie, A. Satpathy, C. J. Schilling, R. F. Schwitters
University of Texas at Austin, Austin, Texas 78712, USA
4
J. M. Izen, X. C. Lou, S. Ye
University of Texas at Dallas, Richardson, Texas 75083, USA
F. Bianchi, F. Gallo, D. Gamba
Universit`a di Torino, Dipartimento di Fisica Sperimentale and INFN, I-10125 Torino, Italy
M. Bomben, L. Bosisio, C. Cartaro, F. Cossutti, G. Della Ricca, S. Dittongo, L. Lanceri, L. Vitale
Universit`a di Trieste, Dipartimento di Fisica and INFN, I-34127 Trieste, Italy
V. Azzolini, N. Lopez-March, F. Martinez-Vidal
IFIC, Universitat de Valencia-CSIC, E-46071 Valencia, Spain
Sw. Banerjee, B. Bhuyan, C. M. Brown, D. Fortin, K. Hamano, R. Kowalewski, I. M. Nugent, J. M. Roney, R. J. Sobie
University of Victoria, Victoria, British Columbia, Canada V8W 3P6
J. J. Back, P. F. Harrison, T. E. Latham, G. B. Mohanty, M. Pappagallo
Department of Physics, University of Warwick, Coventry CV4 7AL, United Kingdom
H. R. Band, X. Chen, B. Cheng, S. Dasu, M. Datta, K. T. Flood, J. J. Hollar, P. E. Kutter, B. Mellado, A. Mihalyi, Y. Pan, M. Pierini, R. Prepost, S. L. Wu, Z. Yu
University of Wisconsin, Madison, Wisconsin 53706, USA
H. Neal
1
INTRODUCTION
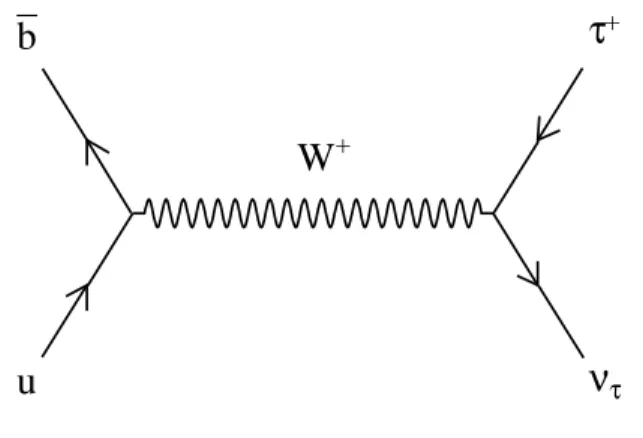
In the Standard Model (SM), the purely leptonic decayB+→ τ+ν
τ 5proceeds via quark annihilation into aW+boson (Fig. 1). Its amplitude is thus proportional to the product of theB-decay constant fBand the quark-mixing-matrix elementVub. The branching fraction is given by:
B(B+→ τ+ν) = G 2 FmBm2τ 8π " 1 − m 2 τ m2 B #2 τB+fB2|Vub|2, (1)
where we have set ¯h = c = 1, GF is the Fermi constant, Vub is a quark mixing matrix element [1, 2],
fB is the B+ meson decay constant which describes the overlap of the quark wave-functions inside the meson, τB+ is the B+ lifetime, and mB and mτ are the B+ meson and τ masses. This expression is
entirely analogous to that for pion decay. Physics beyond the SM, such as a two-Higgs doublet models, could enhance or suppress theB(B+→ τ+ντ) through the introduction of a charged Higgs boson [3].
Current theoretical values forfB(obtained from lattice QCD calculations) [4] have large uncertainties, and purely leptonic decays of theB+meson may be the only clean experimental method of measuringf
B precisely. Given measurements of|Vub| from semileptonic B → uℓν decays, fB could be extracted from the measurement of theB+ → τ+ντ branching fraction. In addition, by combining the branching fraction measurement with results fromB mixing, the ratio |Vub|/|Vtd| can be extracted from B(B+→ τ+ντ)/∆m, where∆m is the mass difference between the heavy and light neutral B meson states.
u
b
+W
τν
+τ
Figure 1: The purely leptonicB decay B+→ τ+ντ proceeding via quark annihilation into aW+boson. The decay amplitude is proportional to the lepton mass and as such decay to the lighter leptons is suppressed. This mode is the most promising for discovery of leptonicB decays. However, experimental
challenges such as the large missing momentum from several neutrinos make the signature forB+→ τ+ν τ less distinctive than for other leptonic modes.
The SM estimate of this branching fraction is(1.59±0.40)×10−4, using|Vub| = (4.39±0.33)×10−3[5] andfB = 0.216 ± 0.022 GeV [4] in Eq. 1.
In a previously published analysis of a smaller sample of223 × 106 Υ (4S) decays the BABAR collabo-ration set an upper limit of:
B(B+→ τ+ντ) < 2.6 × 10⁻⁴at the 90% CL. [6] (2)
5
Charge-conjugate modes are implied throughout this paper. The signalB will always be denoted as a B+
decay while the semi-leptonicB will be denoted as a B−
The Belle collaboration reported evidence of a signal in this channel recently [7]; a central value of
(1.06+0.34
−0.28(stat.) +0.18
−0.16(syst.)) × 10
−4was extracted. The analysis presented herein is a detailed update of the previousBABARsearch.
2
THE
B
A
B
AR
DETECTOR AND DATASET
The data used in this analysis were collected with theBABARdetector at the PEP-II storage ring. The sample corresponds to an integrated luminosity of288 fb−1 at theΥ (4S) resonance (on-resonance) and 27.5 fb−1 taken40 MeV below B ¯B threshold (off-resonance). The on-resonance sample consists of about 320 × 106
Υ (4S) decays (BB pairs). The collider is operated with asymmetric beam energies, producing a boost of βγ ≈ 0.56 of the Υ (4S) along the collision axis.
The BABAR detector is optimized for asymmetric energy collisions at a center-of-mass (CM) energy corresponding to theΥ (4S) resonance. The detector is described in detail in Ref. [8]. The components
used in this analysis are the tracking system composed of a five-layer silicon vertex detector and a 40-layer drift chamber (DCH), the Cherenkov detector (DIRC) for chargedπ–K discrimination, the CsI calorimeter
(EMC) for photon and electron identification, and the 18-layer flux return (IFR) located outside of the 1.5T solenoidal coil and instrumented with resistive plate chambers for muon and neutral hadron identification. For the most recent 51 fb−1 of data, a portion of the muon system has been upgraded to limited streamer tubes (LST) [9]. We separate the treatment of the data to account for varying accelerator and detector conditions. “Runs 1–3” corresponds to the first 111.9 fb−1, “Run 4” the following 99.7 fb−1 and “Run 5” the subsequent 76.8 fb−1.
A GEANT4-based [10] Monte Carlo (MC) simulation is used to model the signal efficiency and the physics backgrounds. Simulation samples equivalent to approximately three times the accumulated data were used to modelBB events, and samples equivalent to approximately 1.5 times the accumulated data
were used to model continuum events wheree+e− → uu, dd, ss, cc and τ+τ−. A large sample of signal events is simulated, where aB+meson decays toτ+ντ and aB−meson decays to an acceptableB mode. Beam related background and detector noise from data are overlayed on the simulated events.
3
ANALYSIS METHOD
Due to the presence of multiple neutrinos, theB+ → τ+ντ decay mode lacks the kinematic constraints which are usually exploited inB decay searches in order to reject both continuum and BB backgrounds.
The strategy adopted for this analysis is to reconstruct exclusively the decay of one of theB mesons in the
event, referred to as “tag”B. The remaining particle(s) in the event, referred to as the “signal side”, are
then compared with the signature expected forB+→ τ+ν
τ. In order to avoid experimenter bias, the signal region in data is not examined (“blinded”) until the final yield extraction is performed.
The tag B is reconstructed in the set of semileptonic B decay modes B− → D0ℓ−ν¯ℓX, where ℓ is
e or µ and X can be either nothing or a transition particle from a higher mass charm state decay which
we do not attempt to reconstruct (although those tags consistent with neutral B decays are vetoed). The D0 is reconstructed in four decay modes: K−π+, K−π+π−π+, K−π+π0, and K0
sπ+π−. The Ks0 is reconstructed only in the modeK0
s → π+π−. These cases where the low momentum transition daughter ofD∗0decays need not be reconstructed and the final state B → D0ℓνX as observed provides a higher efficiency but somewhat lower purity than the exclusive reconstruction method ofB− → D∗0ℓ−ν¯ℓ. The choice of reconstructing the tag B as B− → D0ℓ−ν¯
ℓX was optimized by maximizing s/
√
s + b where s = signal and b = background where a branching fraction for B+→ τ+ντ of1 × 10−4 is assumed.
TheB+ → τ+ντ signal is searched for in both leptonic and hadronicτ decay modes: τ+ → e+νeν¯τ,
τ+→ µ+ν
µν¯τ,τ+ → π+ν¯τ andτ+ → π+π0ν¯τ. The branching fractions of the aboveτ decay modes are listed in Table 1.
Table 1: Branching fractions for theτ decay modes used in the B+→ τ+ν
τ search [11]. Decay Mode Branching Fraction (%)
τ+→ e+νe¯ντ 17.84± 0.06
τ+→ µ+νµν¯τ 17.36± 0.06
τ+→ π+ν¯τ 11.06± 0.11
τ+→ π+π0ν¯τ 25.42± 0.14
3.1 Tag B Reconstruction
The tagB reconstruction proceeds as follows. First we reconstruct the D0candidates in the aforementioned four decay modes using reconstructed tracks and photons where aπ0 is included. The tracks are required to meet particle identification criteria consistent with the particle hypothesis, and are required to converge at a common vertex. Theπ0candidate is required to have invariant mass between 0.115–0.150 GeV/c2 and its daughter photon candidates must have a minimum energy of 30 MeV. The mass of the reconstructed D0 candidates inK−π+,K−π+π−π+, andK0
sπ+π− modes are required to be within 20 MeV/c2 of the nominal mass [11]. In theK−π+π0decay mode the mass is required to be within 35 MeV/c2of the nominal mass [11].
FinallyD0ℓ candidates are reconstructed by combining the D0with an identified electron or muon with momentum above 0.8 GeV/c in the CM frame. The D0 andℓ candidates are required to meet at a common
vertex. An additional kinematic constraint is imposed on the reconstructedD0ℓ candidates: assuming that
the massless neutrino is the only missing particle, we calculate the cosine of the angle between theD0ℓ candidate and theB meson,
cos θB−D0ℓ=
2EBED0ℓ− m2B− m2
D0ℓ 2|~pB||~pD0ℓ|
. (3)
Here (ED0ℓ,~pD0ℓ) and (EB,~pB) are the four-momenta in the CM frame, andmD0ℓ andmBare the masses
of the D0ℓ candidate and B meson, respectively. EB and the magnitude of ~pB are calculated from the beam energy: EB = ECM/2 and |~pB| =
q
E2
B− m2B, whereEBis theB meson energy in the CM frame. Correctly reconstructed candidates populate the range [−1, 1], whereas combinatorial backgrounds can take unphysical values outside this range. We retain events in the interval−2.0 < cos θB−D0ℓ < 1.1, where the
upper bound takes into account the detector resolution and the loosened lower bound accepts those events where a soft transition particle from a higher mass charm state is missing.
If more than one suitableD0ℓ candidate is reconstructed in an event, the best candidate is taken to be the
one with the largest vertex probability. The sum of the charges of all the particles in the event (net charge) must be equal to zero.
At this stage of the selection, the observed yield in data and the predicted yield in the MC simulation agree to within approximately 3%. This discrepancy is corrected by scaling the yield and efficiency obtained from MC simulation. By multiplying the relevant branching fractions and reconstruction efficiencies, from signal MC simulation,B tagging efficiencies are extracted. Scale factors of 1.05, 1.00 and 0.97 are used
to correct these efficiencies for Runs 1–3, Run 4 and Run 5 respectively. The systematic error associated with this correction is described in Sec. 5. The corrected tag reconstruction efficiency in the signal MC simulation is (7.61± 0.05)×10−3 for Runs 1–3, (6.31± 0.05)×10−3 for Run 4 and (5.87± 0.06)×10−3 for Run 5 where the errors are statistical only.
3.2 Selection of B+ → τ+ν
τ signal candidates
After the tagB reconstruction, in the signal side the τ from the B+ → τ+ν
τ decay is identified in one of the following modes:τ+→ e+νeν¯τ,τ+→ µ+νµν¯τ,τ+→ π+ν¯τ orτ+→ π+π0ν¯τ. We select events with one signal-side track which must satisfy the following selection criteria: it must have at least 12 DCH hits, its momentum transverse to the beam axis,pT, is greater than 0.1 GeV/c, and its point of closest approach to the interaction point is less than 5.0 cm along the beam axis and less than 1.5 cm transverse to the beam
axis. The invariant mass of a signal-side π0 candidate must be between 0.115–0.150 GeV/c2, the shower shape of the daughter photon candidates must be consistent with an electromagnetic shower shape and the photons must have a minimum energy of 50 MeV in the CM frame.
The different signal tau decay modes are distinguished by their selection criteria. Theτ+ → e+νeν¯τ,
τ+→ µ+ν
µν¯τ,τ+ → π+ν¯τ andτ+ → π+π0ν¯τ signal modes, all of which contain one charged track, are separated by particle identification. Both theτ+ → π+ν¯τ and theτ+ → π+π0ν¯τ modes contain a pion signal track and are characterized by the number of signal-sideπ0mesons.
• Particle identification:
– For theτ+ → e+ν
eν¯τ selection the track must be identified as an electron and not identified as a muon.
– For theτ+ → µ+νµν¯τ selection the track must be identified as a muon and not identified as an electron.
– For theτ+ → π+ν¯τ selection we require that the track is not identified as an electron or a muon. – For theτ+ → π+π0ν¯τ selection we require that the track is not identified as an electron or a
muon or a kaon.
• Signal-side π0multiplicity:
– For theτ+→ π+ν¯τ selection we require the event to contain no signal-sideπ0.
– For theτ+→ π+π0ν¯τ selection we require that the event contains at least one signal-sideπ0. Background consists primarily ofB+B−events in which the tagB meson has been correctly reconstructed and the recoil side contains one signal candidate track and additional particles which are not reconstructed by the tracking detectors or calorimeters. Typically these events contain KL0 candidates and/or neutrinos, and frequently also additional charged or neutral particles which pass outside of the tracking and calorime-ter acceptance. Background events also containB0B¯0 events. The continuum background contributes to hadronicτ decay modes. In addition some excess events in data, most likely from two-photon and QED
processes which are not modeled in the MC simulation, are also seen. These backgrounds have a distinc-tive event shape and are suppressed by the following constraints on the kinematics of the B+ → τ+ντ candidates.
• Missing mass: The missing mass is calculated as follows. Mmiss =
q
(EΥ(4S)− Evis)2− (~pΥ(4S)− ~pvis)2. (4)
Here (EΥ(4S), ~pΥ(4S)) is the four-momentum of the Υ (4S), known from the beam energies. The quantitiesEvisand~pvisare the total visible energy and momentum of the event which are calculated by adding the energy and momenta, respectively, of all the reconstructed charged tracks and photons in the event.
– For the τ+ → e+νeν¯τ selection events with missing mass between 4.6 and 6.7 GeV/c2 are selected.
– For the τ+ → µ+νµν¯τ selection events with missing mass between 3.2 and 6.1 GeV/c2 are selected.
– For theτ+→ π+ν¯τ selection the missing mass is required to be greater than 1.6 GeV/c2. – For theτ+→ π+π0ν¯τ selection the missing mass is required to be less than 4.6 GeV/c2.
• Maximum CM momentum of the τ daughter:
The following maximum CM momentum requirements are applied to theτ daughter particles.
– The electron candidate from theτ+→ e+νeν¯τ decay must have a CM momentum of less than 1.5 GeV/c. The CM momentum requirement is not applied to the τ+ → µ+νµν¯τ selection because the momentum spectrum of the muon from τ decays peaks below 1 GeV/c and the
particle identification efficiency for low momentum muons is lower than that for low momentum electrons. Therefore, applying the maximum momentum cut reduces the selection efficiency of theτ+→ µ+ν
µν¯τ mode significantly.
– For the two hadronic τ decay modes, the CM momentum of the π from τ+ → π+ν¯τ must be greater than 1.6 GeV/c. The ππ0combination fromτ+ → π+π0ν¯τ must have CM momentum greater than 1.7 GeV/c.
• Continuum Rejection using the Rτ τ variable:
An effective way to removee+e− → τ+τ− background is to place a cut in a plane defined by two variables: the cosine of the angle between the signal candidate and the tagB’s thrust vector (in the CM
frame), and the minimum invariant mass constructable from any three tracks in an event (regardless of whether they are already used in a tag or signal candidates). For the background, the cosine of the thrust angle peaks at−1 and 1, while the minimum invariant mass peaks below 1.5 GeV/c2. We transformed this 2-D variable into a 1-D variable using the following empirically derived equation
Rτ τ ≡ q (3.7 − | cos(θT~ Dℓ,signal)|) 2+ (Mmin 3 − 0.75)2, (5)
whereM3min is the minimum invariant mass of any three changed tracks andθT~Dℓ,signalis the angle between the thrust axes of the reconstructedDℓ and the signal candidates. Because other continuuum
backgrounds also peak in the cosine of the thrust angle, this variable is good at rejecting other similar categories of non-bb background. The selection criteria imposed on this quantity are:
– Forτ+→ e+ν
– Forτ+→ µ+νµν¯τ:Rτ τ > 2.74 – Forτ+→ π+ν¯
τ:Rτ τ > 2.84 – Forτ+→ π+π0ν¯τ:Rτ τ > 2.94
Theτ+→ π+π0ν¯τdecay proceeds via an intermediate resonance. For this mode further background rejection can be achieved by applying the following requirements on the intermediate meson.
– ρ+selection:
The signal-side track is combined with a signal-sideπ0to form theρ+candidate. In events with more than one signal-sideπ0, the candidate with invariant mass closest to the nominalπ0 mass [11] is chosen. The invariant mass of the reconstructed ρ+ is required to be within 0.64–0.86
GeV/c2. A quantity similar tocos θB−D0ℓ, which is defined in section 3.1, can be reconstructed
forτ → ρν as follows: cos θτ −ρ= 2EτEρ− m 2 τ− m2ρ 2|~pτ||~pρ| , (6)
where (Eτ,~pτ) and (Eρ,~pρ) are the four-momenta in the CM frame,mτandmρare the masses of theτ and ρ candidate, respectively. The quantities |~pτ| and Eτ are calculated assuming the
τ is from the B+ → τ+ν
τ decay, and theB+ is almost at rest in the CM frame. We accept candidates withcos θτ −ρ > 0.87.
• Eextrarequirement:
The most powerful variable for separating signal and background is the remaining energy (Eextra), calculated by adding the CM energy of the neutral clusters and charged tracks that are not associated with either the tagB or the signal. The photon candidates contributing to the Eextra variable have minimum cluster energies of 20 MeV in the CM frame. For signal events the neutral clusters
con-tributing toEextra arise predominantly from processes such as beam-background, hadronic split-offs and Bremsstrahlung. Signal events tend to peak at lowEextra values whereas background events, which contain additional sources of neutral clusters, are distributed towards higherEextravalues. The most signal sensitive region is optimized for each mode and is blinded in on-resonance data until the selection is finalized. TheEextra < 0.5 GeV region is defined as the nominal blinding region which is slightly larger than the signal region for each mode.
For all the signal modesEextra is optimized for the best signal significance (assuming the branching fraction is1 × 10−4). The optimization yields to following requirements:
– Forτ+→ e+νeν¯τ:Eextra <0.31 GeV – Forτ+→ µ+νµν¯τ:Eextra <0.26 GeV – Forτ+→ π+ν¯
τ:Eextra <0.48 GeV – Forτ+→ π+π0ν¯τ:Eextra <0.25 GeV
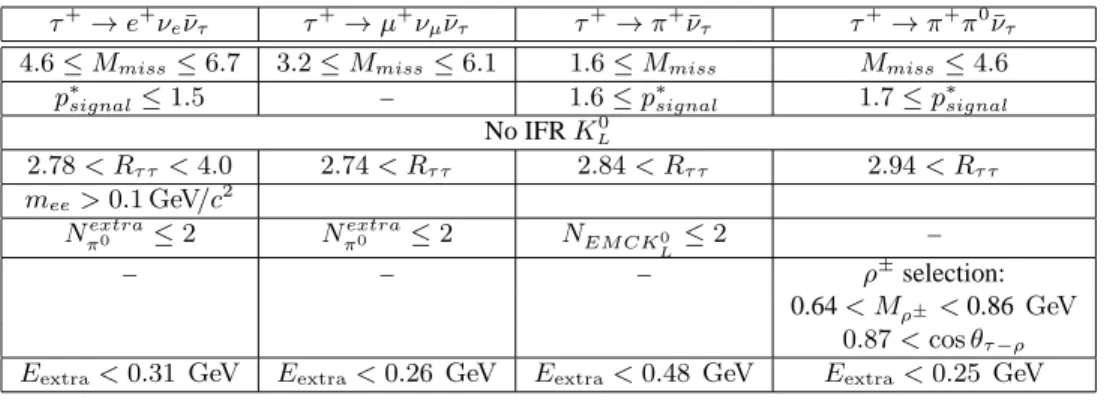
Table 2: The selection criteria for different signal modes using aB−→ D0ℓ−ν¯
ℓtag are listed in this table.
τ+
→e+
νeν¯τ τ+→µ+νµν¯τ τ+→π+ν¯τ τ+→π+π0ν¯τ
4.6 ≤ Mmiss≤ 6.7 3.2 ≤ Mmiss≤ 6.1 1.6 ≤ Mmiss Mmiss≤ 4.6
p∗ signal≤ 1.5 – 1.6 ≤ p ∗ signal 1.7 ≤ p ∗ signal No IFRK0 L 2.78 < Rτ τ< 4.0 2.74 < Rτ τ 2.84 < Rτ τ 2.94 < Rτ τ mee> 0.1 GeV/c2 Nextra π0 ≤ 2 N extra π0 ≤ 2 NEM CK0 L ≤ 2 – – – – ρ± selection: 0.64< Mρ± < 0.86 GeV 0.87 < cos θτ −ρ
Eextra< 0.31 GeV Eextra< 0.26 GeV Eextra< 0.48 GeV Eextra< 0.25 GeV
Table 3: The signal efficiencies, mode-by-mode, relative to the number of tags. The branching fraction for the givenτ decay mode selected is included in the efficiency.
Mode Efficiency (BF Included)
τ+→ e+νeν¯τ 0.0414± 0.0009 τ+→ µ+ν µν¯τ 0.0242± 0.0007 τ+→ π+ν¯τ 0.0492± 0.0010 τ+→ π+π0ν¯τ 0.0124± 0.0005 3.2.1 Signal Efficiency
The signal-side selection efficiencies for theτ decay modes are determined from signal MC simulation and
summarized in Table 3. The signal efficiencies correspond to the number of events selected in a specific signal decay mode, given that a tagB has been reconstructed.
The selection efficiency forτ+ → µ+νµν¯τ is low compared to that of theτ+→ e+νeν¯τ mode because the momentum spectrum of the signal muons peaks below 1 GeV/c, where the muon detection efficiency is
low. Since no minimum momentum requirement and no tight pion identification criteria are applied to the
τ+ → π+ν¯τ signal selection, electron and muon signal tracks that fail particle identification requirement get selected in this mode. Any trueτ+ → π+π0ν¯τ signal events, with a missed π0 also get included in
τ+→ π+ν¯
τ selection mode. Therefore theτ+→ π+ν¯τ selection mode has the highest signal efficiency. 3.3 Validation of Background Estimation from Eextra Sidebands
We further study the agreement between simulation and data by using the extra energy sideband region, and the ratio of the yields in this region to that in the signal region. This is used mainly to test the reliability of the background estimation in the lowEextraregion by extrapolation from the higherEextra region.
TheEextra > 0.5 GeV region is defined as the “sideband” (sb). The “signal region” is defined separately for each selection mode. For each control sample after applying appropriate selection cuts, the number of MC events in the signal region (NMC,Sig) and sideband (NMC,sb) are counted and their ratio (RMC) is obtained.
RMC = NMC,Sig
NMC,sb
Using the number of data events in the sideband (Ndata,sb) and the ratio RMC, the number of expected background events in the signal region in data (Nexp,Sig) is estimated.
Nexp,Sig = Ndata,sb· RMC (8)
The number of expected data events (Nexp,Sig) in the signal region is compared with the observed number of data events (Nobs,Sig) in the signal region. The agreement between the above two quantities provide validation of background estimation in the lowEextra region.
Table 4 illustrates the level of agreement between the sideband projections in MC and data. In general, the agreement is at the1σ level between the direct count in the MC signal region and the projected data.
The projections in data are used to predict background for the final extraction, hence we only rely on the data for this.
Table 4: The sideband-to-signalbox projection computed using a sideband region whereEextra > 0.5 GeV. The second column corresponds to the ratio of yields in the signal region and sideband as measured in MC.
Mode ratio (MC) upper sb (Data) signal region (Proj) signal region (MC) electron 0.137 ± 0.015 305.00 ± 17.46 41.91 ± 5.19 39.72 ± 4.07
muon 0.037 ± 0.004 965.00 ± 31.06 35.39 ± 4.16 36.13 ± 4.02 pion 0.043 ± 0.004 2288.00 ± 47.83 99.09 ± 9.10 87.69 ± 7.72 rho 0.005 ± 0.001 2805.00 ± 52.96 15.30 ± 3.48 15.81 ± 3.58
4
VALIDATION OF TAG B YIELD AND E
extraSIMULATION
The tagB yield and Eextra distribution in signal and background MC simulation are validated using various control samples. The level of agreement between the data and simulation distributions provides validation of theEextra modeling in the simulation and corrects for differences in the yield of reconstructed tagB’s.
“Double-tagged” events, for which both of the B mesons are reconstructed in tagging modes, B− →
D0ℓ−ν¯ℓX vs. B+→ ¯D0ℓ+νℓX are used as the main control sample. Due to the large branching fraction and high tagging efficiency for these events, a sizable sample of such events is reconstructed in the on-resonance dataset. Due to all of the decay products of theΥ (4S) being correctly accounted for the double-tagged
events reconstructed have a high purity.
To select double-tag events we require that the two tagB candidates do not share any tracks or neutrals.
If there are more than two such non-overlapping tagB candidates in the event then the best candidates
are selected as those with the largest D0-ℓ vertex probability, as with the signal search. The number of
double-tagged events (N2) is given by
N2 = ε2N. (9)
whereN is the number of B ¯B events in the sample and ε is the tag efficiency that is compared between data
and MC. Using the expression in equation 9 we calculate the efficienciesεdataandεMC. The correction fac-tor, ratio of the efficiencies between data and simulation, from this method is given in equations 10, 11 and 12 for Runs 1–3, Run 4 and Run 5 respectively.
εRuns 1–3
εMC = 1.05 ± 0.02
εRun 4 εMC = 1.00 ± 0.03 (11) εRun 5 εMC = 0.97 ± 0.03 (12)
It was directly verified that data taken during Runs 1–3 agreed in both shape and normalized yield whereas during Run 4 and Run 5 data were taken with the machine operating in a mode of continuous injection which may affect detector backgrounds differently. These runs are therefore considered separately.
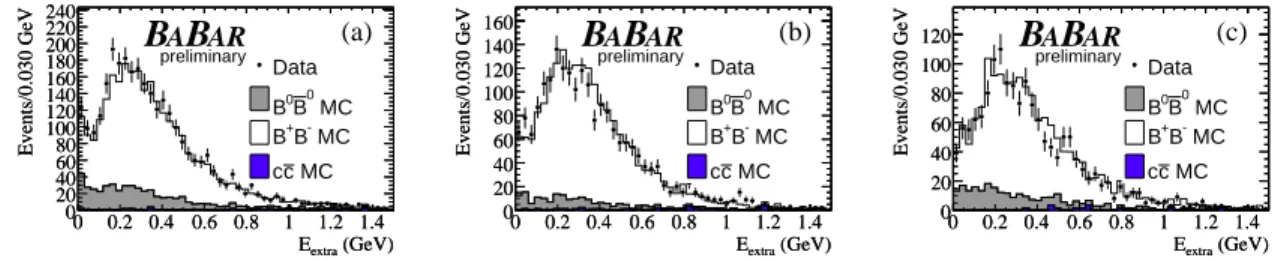
TheEextra for the double-tagged sample is calculated by summing the CM energy of the photons which are not associated with either of the tagB candidates. The sources of neutrals contributing to the Eextra distribution in double-tagged events are similar to those contributing to theEextra distribution in the signal MC simulation. Therefore the agreement of theEextradistribution between data and MC simulation for the double-tagged sample, in figure 2, is used as a validation of theEextra simulation in the signal MC.
(GeV) extra E 0 0.2 0.4 0.6 0.8 1 1.2 1.4 Events/0.030 GeV 0 20 40 60 80 100 120 140 160 180 200 220 240 (GeV) extra E 0 0.2 0.4 0.6 0.8 1 1.2 1.4 Events/0.030 GeV 0 20 40 60 80 100 120 140 160 180 200 220 240 Data MC 0 B 0 B MC -B + B MC c c
B
AB
AR preliminary (a) (GeV) extra E 0 0.2 0.4 0.6 0.8 1 1.2 1.4 Events/0.030 GeV 0 20 40 60 80 100 120 140 160 (GeV) extra E 0 0.2 0.4 0.6 0.8 1 1.2 1.4 Events/0.030 GeV 0 20 40 60 80 100 120 140 160 Data MC 0 B 0 B MC -B + B MC c cB
AB
AR preliminary (b) (GeV) extra E 0 0.2 0.4 0.6 0.8 1 1.2 1.4 Events/0.030 GeV 0 20 40 60 80 100 120 (GeV) extra E 0 0.2 0.4 0.6 0.8 1 1.2 1.4 Events/0.030 GeV 0 20 40 60 80 100 120 Data MC 0 B 0 B MC -B + B MC c cB
AB
AR preliminary (c)Figure 2: The distribution of the remaining neutral energy (Eextra) for double-tagged events, plotted for generic MC and data: a) Runs 1-3, b) Run 4 and c) Run 5. No off-resonance data events are seen in the
Eextraregion plotted here. In these events both of theD0ℓ candidates from double-tag are required to pass the selection described in section 3.1 and best candidate selection. The differences in these distributions are used for obtaining the systematic error for tagging efficiency correction.
The simulation is further validated by comparing a sample of events where the signal candidate and tag
B candidate are of the “wrong-sign” with non-zero net charge. The agreement between data and simulation
for all signal modes for the background estimation in theEextrasignal region provides a useful cross-check.
5
STUDIES OF SYSTEMATICS
The main sources of uncertainty in the determination of theB+ → τ+ντ branching fraction are the follow-ing:
• Uncertainty in tagging efficiency determination
• Uncertainty in determination of the efficiency εifor each selection mode.
• Uncertainty in the determination of the number of expected background events in the signal region
for each selection mode.
A small uncertainty of 1.1% also enters the branching ratio limit calculation from the estimation of the number ofB+B−events present in the data sample [12]. The systematic uncertainties are summarized in table 5.
5.1 Tagging Efficiency Systematics
The tagging efficiency and yield in signal simulation is corrected using the double-tagged events. The selection of double-tagged events is described in section 4.
We take the 1.9%, 3.0% and 3.1% errors (from equations 10, 11 and 12) obtained from the double tag method as the systematic uncertainties associated with the tagging efficiency and yield correction in MC. The combined, luminosity weighted, tagB yield systematic uncertainty is 1.5%. The luminosity weighted
tagB yield correction is 1.01.
5.2 EextraSystematic Uncertainty
The systematic uncertainty due to the mis-modeling of theEextra variable is extracted using the double-tagged events. The selection of double-double-tagged events is described in Section 4. A cut is imposed on theEextra distributions shown in Figures 2(a), 2(b) and 2(c) to extract the yield of candidates satisfying
Eextra < 0.5GeV. This yield is then compared to the number of candidates in the full sample. Comparing the ratio extracted from MC to that extracted from data yields a correction factor, the error on which is taken as the systematic uncertainty forEextra. These values are broken up by run and we extract the follow-ing numbers: Runs 1–3 = 0.98±0.06, Run 4 = 0.99±0.06, Run 5 = 1.02±0.08 The combined, luminosity weighted systematic uncertainty forEextrais 3.8%. The luminosity weightedEextra correction is 0.99.
5.3 Uncertainties in the signal selection efficiencies in each selection mode
Besides the tagging efficiency uncertainty, the contribution to the systematic uncertainties in the determina-tion of the efficiencies comes from systematic uncertainty on the tracking efficiency, particle identificadetermina-tion, and simulation of the neutral clusters in the calorimeter which contribute to the Eextra distribution, and
KL0identification. The different contributions to the systematic uncertainty on the selection efficiencies are
listed in table 5.
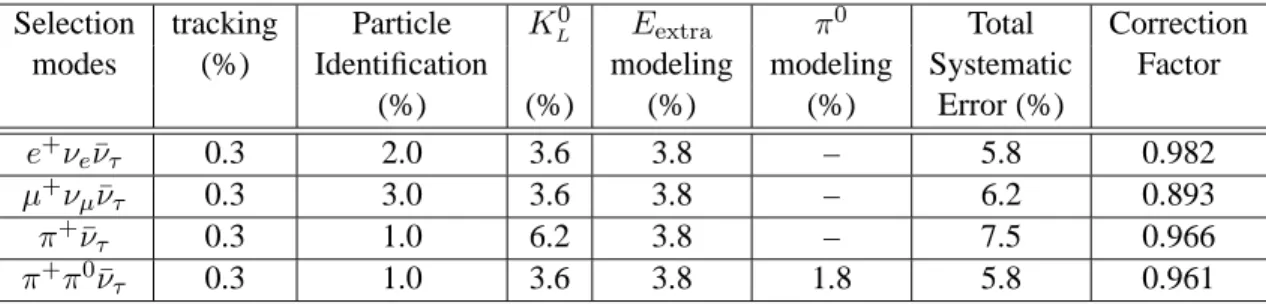
Table 5: Contribution to the systematic uncertainty on the signal selection efficiencies in different selec-tion modes. These uncertainties are added together in quadrature with the uncertainty on the tagB yield,
extracted from the double-tagged control sample, of 1.5%. The uncertainty on MC statistic is added in quadrature to obtain the total systematic uncertainty.
Selection tracking Particle KL0 Eextra π
0 Total Correction
modes (%) Identification modeling modeling Systematic Factor
(%) (%) (%) (%) Error (%) e+νeν¯τ 0.3 2.0 3.6 3.8 – 5.8 0.982 µ+νµν¯τ 0.3 3.0 3.6 3.8 – 6.2 0.893 π+¯ν τ 0.3 1.0 6.2 3.8 – 7.5 0.966 π+π0ν¯ τ 0.3 1.0 3.6 3.8 1.8 5.8 0.961 5.4 Uncertainties on KL0modeling
The systematic uncertainty on the modeling ofKL0 candidates is extracted using the double-tagged events
a systematic uncertainty, similarly to the method used forEextra. We quantify this comparison by com-paring the yield with a cut demanding exactly zero reconstructed IFR measuredK0
Lcandidates remaining,
with a sample where any number of KL0 candidates remain and take the ratio of ratios from the MC and
data. We extract the following values for corrections and systematic uncertainties: Runs 1–3 = 0.98±0.05, Run 4 = 1.00±0.06, Run 5 = 0.98±0.08, hence percentage uncertainties of 5.1%, 6.0% and 8.2%. The cor-rection factors are all close to unity as expected. The combined, luminosity weighted systematic uncertainty for IFRKL0candidates is 3.6%. The luminosity weighted IFRK
0
Lcorrection is 0.99.
The same exercise is performed for K0
L candidates reconstructed in the EMC. We extract the
fol-lowing values for corrections and systematic uncertainties: Runs 1–3 = 0.88±0.05, Run 4 = 1.00±0.10, Run 5 = 1.08±0.11. Percentage uncertainties are 5.7%, 10% and 10.2%. The combined, luminosity weighted systematic uncertainty for EMC K0
L candidates is 5.1%. The luminosity weighted EMC KL0
correction is 0.97.
6
RESULTS
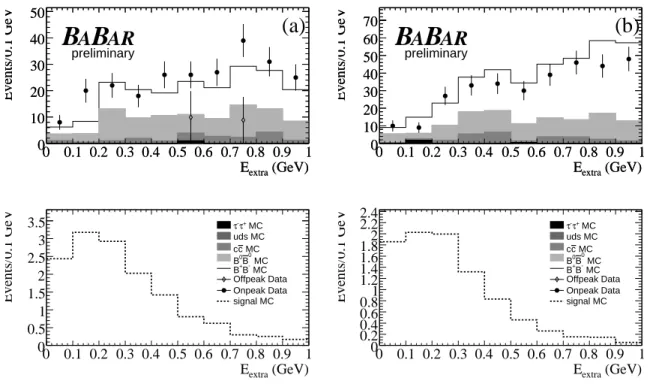
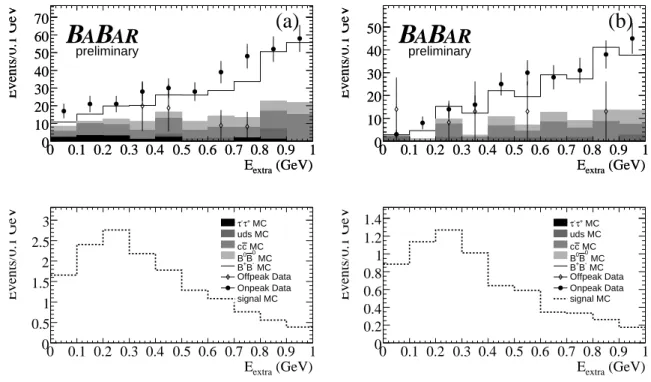
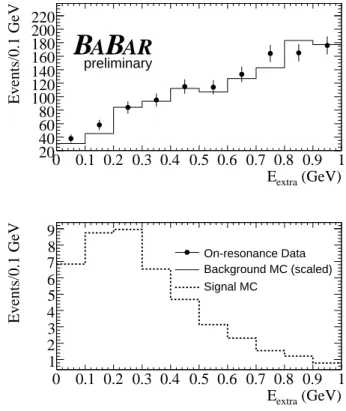
After finalizing the signal selection criteria, the signal region in the on-resonance data is examined. Table 6 lists the number of observed events in on-resonance data in the signal region, together with the expected number of background events in the signal region. Figures 3 and 4 show theEextra distribution in data and simulation for each of theτ decay modes considered. Data is overlayed on the summed MC
contribu-tion, scaled to the dataset luminosity, and signal MC is plotted for comparison. Figure 5 shows theEextra distribution for all modes combined.
(GeV) extra E 0 0.1 0.2 0.3 0.4 0.5 0.6 0.7 0.8 0.9 1 Events/0.1 GeV 0 10 20 30 40 50 (GeV) extra E 0 0.1 0.2 0.3 0.4 0.5 0.6 0.7 0.8 0.9 1 Events/0.1 GeV 0 10 20 30 40 50
B
A
B
AR
preliminary (GeV) extra E 0 0.1 0.2 0.3 0.4 0.5 0.6 0.7 0.8 0.9 1 Events/0.1 GeV 0 0.5 1 1.5 2 2.5 3 3.5 τ-τ+ MC uds MC MC c c MC 0 B 0 B MC -B + B Offpeak Data Onpeak Data signal MC(a)
(GeV) extra E 0 0.1 0.2 0.3 0.4 0.5 0.6 0.7 0.8 0.9 1 Events/0.1 GeV 0 10 20 30 40 50 60 70 (GeV) extra E 0 0.1 0.2 0.3 0.4 0.5 0.6 0.7 0.8 0.9 1 Events/0.1 GeV 0 10 20 30 40 50 60 70B
A
B
AR
preliminary (GeV) extra E 0 0.1 0.2 0.3 0.4 0.5 0.6 0.7 0.8 0.9 1 Events/0.1 GeV 0 0.2 0.4 0.6 0.81 1.2 1.4 1.6 1.82 2.2 2.4 MC + τ -τ uds MC MC c c MC 0 B 0 B MC -B + B Offpeak Data Onpeak Data signal MC(b)
Figure 3: Total extra energy is plotted after all cuts have been applied in the mode (a)τ+ → e+ν
eν¯τ and (b) τ+ → µ+νµν¯τ. Off-resonance data and MC have been normalized to the on-resonance luminosity. SimulatedB+ → τ+ντ signal MC is plotted (lower) for comparison.
(GeV) extra E 0 0.1 0.2 0.3 0.4 0.5 0.6 0.7 0.8 0.9 1 Events/0.1 GeV 0 10 20 30 40 50 60 70 (GeV) extra E 0 0.1 0.2 0.3 0.4 0.5 0.6 0.7 0.8 0.9 1 Events/0.1 GeV 0 10 20 30 40 50 60 70
B
A
B
AR
preliminary (GeV) extra E 0 0.1 0.2 0.3 0.4 0.5 0.6 0.7 0.8 0.9 1 Events/0.1 GeV 0 0.5 1 1.5 2 2.5 3 τ-τ+ MC uds MC MC c c MC 0 B 0 B MC -B + B Offpeak Data Onpeak Data signal MC(a)
(GeV) extra E 0 0.1 0.2 0.3 0.4 0.5 0.6 0.7 0.8 0.9 1 Events/0.1 GeV 0 10 20 30 40 50 (GeV) extra E 0 0.1 0.2 0.3 0.4 0.5 0.6 0.7 0.8 0.9 1 Events/0.1 GeV 0 10 20 30 40 50B
A
B
AR
preliminary (GeV) extra E 0 0.1 0.2 0.3 0.4 0.5 0.6 0.7 0.8 0.9 1 Events/0.1 GeV 0 0.2 0.4 0.6 0.8 1 1.2 1.4 τ-τ+ MC uds MC MC c c MC 0 B 0 B MC -B + B Offpeak Data Onpeak Data signal MC(b)
Figure 4: Total extra energy is plotted after all cuts have been applied in the mode (a)τ+ → π+ν¯τ and (b)
τ+ → π+π0ν¯τ. Off-resonance data and MC have been normalized to the on-resonance luminosity. Simu-latedB+→ τ+ν
τsignal MC is plotted (lower) for comparison.
We determine theB+ → τ+ντ branching fraction from the number of signal candidatessi in data for eachτ decay mode, according to si = NBBB(B+ → τ+ντ)εtagεi. HereNBB is the total number ofBB pairs in data,εtagis the tag reconstruction efficiency in signal MC;εiis the signal-side selection efficiency in differentτ decay modes calculated with respect to the total number of reconstructed tag B mesons. Table 7
shows the values ofNBB,εtagandεiafter applying appropriate systematic corrections (see section 5). The results from each decay mode are combined using the ratioQ = L(s + b)/L(b), where L(s + b) and L(b) are the likelihood functions for signal plus background and background-only hypotheses, respectively [13]:
L(s + b) ≡ nch Y i=1 e−(si+bi)(s i+ bi)ni ni! , L(b) ≡ nch Y i=1 e−bibni i ni! , (13)
We include the statistical and systematic uncertainties on the expected background (bi) in the likelihood definition by convolving it with a Gaussian distribution (G). The mean of G is bi, and the standard deviation (σbi) ofG is the statistical and systematic errors on biadded in quadrature [14],
L(si+ bi) → L(si+ bi) ⊗ G(bi, σbi) (14)
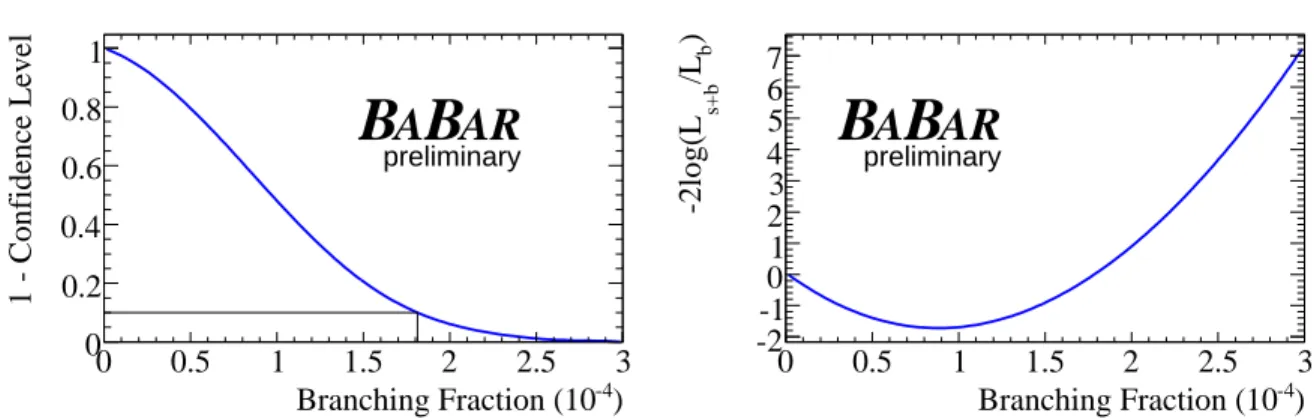
(similarly forL(bi)). The results from this procedure are illustrated in Figure 6. We determine the following branching fraction
B(B+→ τ+ντ) = (0.88+0.68−0.67(stat.) ± 0.11(syst.)) × 10−4, (15) and also set an upper limit at the 90% confidence level of
(GeV) extra E 0 0.1 0.2 0.3 0.4 0.5 0.6 0.7 0.8 0.9 1 Events/0.1 GeV 20 40 60 80 100 120 140 160 180 200 220
B
A
B
AR
preliminary (GeV) extra E 0 0.1 0.2 0.3 0.4 0.5 0.6 0.7 0.8 0.9 1 Events/0.1 GeV 1 2 3 4 5 6 7 8 9 On-resonance Data Background MC (scaled) Signal MCFigure 5: Total extra energy is plotted after all cuts have been applied with all modes combined. Off-resonance data and MC have been normalized to the on-Off-resonance luminosity. Events in this distribution are required to pass all selection criteria. In addition the background MC have been scaled according to the ratio of predicted backgrounds from data and MC as presented in section 3.3. SimulatedB+→ τ+ντsignal MC is plotted (lower) for comparison.
Figure 6 shows the distributions of confidence level vs branching fraction and the negative log likelihood curve illustrating the extracted upper limit and central value respectively.
Using the measured central value forB(B+→ τ+ντ) and taking the known values of GF,mB,mτ andτB from Ref. [11] we calculate, from equation 1, the product of theB meson decay constant and |Vub| to be
fB· |Vub| = (7.0+2.3−3.6(stat.)+0.4−0.5(syst.)) × 10−4GeV.
7
SUMMARY
We have performed a search for the decay processB+→ τ+ντ. To accomplish this a sample of semileptonic
B decays (D0ℓ−¯ν
ℓX) has been used to reconstruct one of the B mesons and the remaining information in the event is searched for evidence ofB+→ τ+ντ. A branching fraction of
B(B+→ τ+ντ) = (0.88+0.68−0.67(stat.) ± 0.11(syst.)) × 10−4, (17) is measured and we set an upper limit at the 90% confidence level of
B(B+→ τ+ντ) < 1.8 × 10⁻⁴. (18)
Using the measured central value forB(B+→ τ+ντ) and taking the known values of GF,mB,mτ andτB from Ref. [11] we calculate, from equation 1, the product of theB meson decay constant and |Vub| to be
Table 6: The observed number of on-resonance data events in the signal region are shown, together with number of expected background events. The background estimations include systematic corrections referred to in section 3.3.
Selection Expected Observed Events
Background Events in On-resonance Data
e+νeν¯τ 41.9± 5.2 51
µ+νµ¯ντ 35.4± 4.2 36
π+ν¯τ 99.1± 9.1 109
π+π0ν¯τ 15.3± 3.5 17
All modes 191.7± 11.8 213
Table 7: The corrected tag and signal efficiencies. Two errors are quoted: the first is the MC statistical uncertainty, and the second is the systematic error computed from the sources in section 5.
Efficiency Corrected Relative Systematic Error (%)
Tag (6.77 ± 0.05(stat.) ± 0.10(syst.)) × 10−3 1.5
ε(τ+→ e+νeν¯τ) (4.06 ± 0.09(stat.) ± 0.23(syst.)) × 10−2 5.6 ε(τ+→ µ+νµν¯τ) (2.16 ± 0.06(stat.) ± 0.13(syst.)) × 10−2 6.0 ε(τ+ → π+ν¯τ) (4.88 ± 0.10(stat.) ± 0.35(syst.)) × 10−2 7.3 ε(τ+→ π+π0ν¯τ) (1.16 ± 0.05(stat.) ± 0.07(syst.)) × 10−2 5.6 ) -4 Branching Fraction (10 0 0.5 1 1.5 2 2.5 3 1 - Confidence Level 0 0.2 0.4 0.6 0.8 1
B
A
B
AR
preliminary ) -4 Branching Fraction (10 0 0.5 1 1.5 2 2.5 3 )b /L s+b -2log(L -2 -1 0 1 2 3 4 5 6 7B
A
B
AR
preliminaryFigure 6: The confidence level vs branching fraction is shown (left) to illustrate the extracted upper limit. The negative log likelihood curve (right) illustrates the central value and it’s corresponding uncertainty.
8
ACKNOWLEDGMENTS
We are grateful for the extraordinary contributions of our PEP-II colleagues in achieving the excellent lu-minosity and machine conditions that have made this work possible. The success of this project also relies critically on the expertise and dedication of the computing organizations that supportBABAR. The collab-orating institutions wish to thank SLAC for its support and the kind hospitality extended to them. This work is supported by the US Department of Energy and National Science Foundation, the Natural Sciences and Engineering Research Council (Canada), Institute of High Energy Physics (China), the Commissariat `a l’Energie Atomique and Institut National de Physique Nucl´eaire et de Physique des Particules (France), the Bundesministerium f¨ur Bildung und Forschung and Deutsche Forschungsgemeinschaft (Germany), the Istituto Nazionale di Fisica Nucleare (Italy), the Foundation for Fundamental Research on Matter (The Netherlands), the Research Council of Norway, the Ministry of Science and Technology of the Russian Federation, Ministerio de Educaci´on y Ciencia (Spain), and the Particle Physics and Astronomy Research Council (United Kingdom). Individuals have received support from the Marie-Curie IEF program (European Union) and the A. P. Sloan Foundation.
References
[1] N. Cabbibo, Phys. Rev. Lett. 10, 531 (1963).
[2] M. Kobayashi and T. Maskawa, Prog. Theor. Phys. 49, 652 (1973). [3] W. S. Hou, Phys. Rev. D 48 (1993) 2342.
[4] A. Gray et al. (HPQCD Collaboration), Phys. Rev. Lett. 95, 212001 (2005). [5] E. Barberio et al. (Heavy Flavor Averaging Group), hep-ex/0603003.
[6] TheBABARCollaboration, B. Aubert et al., Phys. Rev. D. 73, 057101 (2006). [7] Belle Collaboration, K. Abe et al., hep-ex/0604018.
[8] TheBABARCollaboration, B. Aubert et al., Nucl. Instrum. Methods A479, 1-116 (2002). [9] M. R. Convery et al., Nucl. Instrum. Methods A556, 134 (2006).
[10] S. Agostinelli et al., Nucl. Instrum. and Methods A506, 250-303 (2003).
[11] S. Eidelman et al., Particle Data Group, Phys. Lett. B 592, 1 (2004) and 2005 partial update for edition 2006 (URL: http://pdg.lbl.gov).
[12] TheBABARCollaboration, B. Aubert et al., Phys. Rev. D 67, 032002 (2003). [13] A. L. Read, J. Phys G28, 2693 (2002).
![Table 1: Branching fractions for the τ decay modes used in the B + → τ + ν τ search [11].](https://thumb-eu.123doks.com/thumbv2/123doknet/13997060.455554/10.918.310.597.220.333/table-branching-fractions-τ-decay-modes-used-search.webp)