HAL Id: inserm-00858273
https://www.hal.inserm.fr/inserm-00858273
Submitted on 24 Mar 2014HAL is a multi-disciplinary open access archive for the deposit and dissemination of sci-entific research documents, whether they are pub-lished or not. The documents may come from
L’archive ouverte pluridisciplinaire HAL, est destinée au dépôt et à la diffusion de documents scientifiques de niveau recherche, publiés ou non, émanant des établissements d’enseignement et de
study
Carine Chassain, Guy Bielicki, Carole Carcenac, Anne-Claire Ronsin,
Jean-Pierre Renou, Marc Savasta, Franck Durif
To cite this version:
Carine Chassain, Guy Bielicki, Carole Carcenac, Anne-Claire Ronsin, Jean-Pierre Renou, et al.. Does MPTP intoxication in mice induce metabolite changes in the nucleus accumbens? A 1H nuclear MRS study: A severe DA denervation in VTA induces metabolite changes in the NAc. NMR in Biomedicine, Wiley, 2013, pp.336-347. �inserm-00858273�
Does MPTP intoxication in mice induce metabolite changes in the nucleus
accumbens ? A
1H nuclear magnetic resonance spectroscopy study
Carine Chassain1,4, Guy Bielicki2, Carole Carcenac3, Anne-Claire Ronsin4, Jean-Pierre Renou2, Marc Savasta3, Franck Durif1,4.
1 CHU Clermont-Ferrand, Service of Neurology, F-63001 Clermont-Ferrand, France.
2 INRA, Centre Clermont-Ferrand/Theix, platform RMSB, F-63122 Saint Genès Champanelle, France.
3 INSERM U836, Dynamic and Pathophysiology of Basal Ganglia, Grenoble Institute of
Neurosciences, BP 170, F-38042 Grenoble, Cedex 9, France.
4 Univ Clermont 1, UFR Medicine, EA 7980, F-63001 Clermont-Ferrand, France.
* Running title: A severe DA denervation in VTA induces metabolite changes in the NAc
To whom correspondence should be addressed: Carine Chassain, CHU Clermont-Ferrand, Service of Neurology, 58 rue Montalembert, F-63001 Clermont-Ferrand, France; Tel.: +33 4 73 62 48 13; Fax: +33 4 73 62 40 89; Email: carine.chassain@clermont.inra.fr
number of pages: 37; number of figures: 9
number of words: in abstract: 266; in introduction: 556; discussion: 1569.
ABSTRACT 2
Using in vivo 1H NMR spectroscopy in a mouse model of Parkinson's disease, we previously 3
showed, that glutamate concentrations in the dorsal striatum were highest after dopamine denervation 4
associated with an increase in GABA and glutamine levels. The aim of this study was to determine 5
whether the changes previously observed in the motor part of the striatum were reproduced in a ventral 6
part of the striatum, the nucleus accumbens (NAc). This study was carried out on controls and MPTP-7
intoxicated mice. In vivo spectra were acquired for a voxel (8 µl) in the dorsal striatum, and in the 8
NAc (1.56 µl). NMR acquisitions were first performed 10 days after the last MPTP injection in basal 9
condition (after saline i.p. injection) and then in the same animal the week after basal NMR 10
acquisitions, after acute levodopa administration (200mg.kg-1, i.p.). Immunohistochemistry was used 11
to determine the levels of glutamate, glutamine synthetase (GS) and GAD67 in these two structures. 12
The glutamate, glutamine and GABA concentrations obtained in the basal state were higher in the 13
NAc of MPTP-intoxicated mice which have the higher dopamine denervation in the ventral tegmental 14
area (VTA) and in the dorsal striatum. Levodopa decreased the levels of these metabolites in MPTP-15
intoxicated mice to levels similar to those in controls. In parallel immunohistochemical staining 16
showed that glutamate, GS and GAD67–immunoreactivity increased in the dorsal striatum of MPTP-17
intoxicated mice and in NAc for animals with a severe dopamine denervation in VTA. 18
These findings strongly supported a hyperactivity of the glutamatergic cortico-striatal pathway and 19
changes in glial activity when the dopaminergic denervation in the VTA and SNc was severe. 20
Keywords: MPTP-intoxicated mice, 1H NMR spectroscopy, Glu, Gln, GABA, dorsal striatum, NAc 21
INTRODUCTION
23
Parkinson’s disease (PD) is a progressive neurodegenerative disorder characterized by a severe 24
loss of dopaminergic neurons (DA neurons) close to 80% in the ventral part of the midbrain 25
corresponding principally to the substantia nigra pars compacta (SNc) (1,2). Dopamine denervation is 26
less severe (40 %), in the dorsal SNc and the contiguous ventral tegmental area (VTA) which belongs 27
to the dorsal part of the midbrain (3-5). These nuclei project to the ventral striatum, which includes 28
the nucleus accumbens (NAc) and the broad continuum between the caudate nucleus and the putamen 29
ventral to the rostral internal capsule, the limbic cortex (medial prefrontal, cingulate and entorhinal 30
areas) and other limbic structures (septum, olfactory tubercle, amygdalus, hippocampus, pyriform 31
cortex) (6). Degeneration of the DA neurons in the SNc causes a large concomitant decrease in 32
dopamine levels within the dorsolateral striatum (2). This part of the striatum is connected to the 33
premotor and motor cortices areas (7,8). Using 1H NMR spectroscopy to measured the levels of 34
GABA and glutamate (Glu) in the dorsal striatum, we previously demonstrated significant increased 35
Glu and GABA concentrations in 1-methyl-4-phenyl-1,2,3,6-tetrahydropyridine (MPTP)-intoxicated 36
C57Bl/6J mice (9,10). MPTP is a known neurotoxin which affects primarily (though not exclusively) 37
the dopamine-containing neurons of the SNc. It has subsequently been used to establish a mice model 38
of PD (11). Thus, our studies strongly suggest that the motor glutamatergic cortico-striatal pathway 39
displays hyperactivity after MPTP intoxication accompanied by an increase in striatal GABA levels. 40
DA denervation of the VTA induces a decrease in dopamine levels within the NAc depending on the 41
size of the VTA lesion (12-14). Damage to the mesocorticolimbic DA pathway may contribute to the 42
non- motor symptoms described during the progression of PD, such as apathy (15) and depression (16-43
18). However, the consequences of DA denervation in the VTA for Glu and GABA levels in the NAc 44
remain unclear. Only one study has shown an increase in levels of the mRNA for isoform 67 of 45
glutamic acid decarboxylase (GAD67), an enzyme involved in GABA-synthesis, in the anterior part 46
and core of the NAc after DA denervation (19). These results suggest that dopamine exerts a tonic 47
inhibitory control over GAD67 mRNA synthesis in the NAc, in normal conditions. 48
The objective of this study was to assess the consequences of DA denervation of the VTA and the SNc 49
after MPTP intoxication in mice for the glutamatergic and GABAergic activities in the two target 50
structures, the NAc and the dorsal striatum. In vivo 1H NMR spectroscopy was used to determine the 51
levels of Glu, GABA and Gln in the NAc and the dorsal striatum of the MPTP-intoxicated mouse 52
model of PD before and after DA replacement (intraperitoneal i.p. injection of the precursor of the 53
dopamine, the levodopa). The concentrations obtained in the NAc were compared with the 54
concentrations of Glu, GABA and Gln found in the dorsal striatum. We have chosen MRS due to its 55
ability to make repeated direct non-invasive measurements of brain metabolites in vivo. Measurement 56
of these metabolites concentrations using 1H MRS is one way to assess Glu and GABA 57
neurotransmitters release and glial-neuronal interactions (20,21). We also used immunohistochemistry 58
to determine the levels in the dorsal striatum and the NAc t of Glu, glutamine synthetase (GS), an 59
ubiquitous enzyme present in the astroglial cytoplasm and involved in the conversion of Glu to Gln 60 (22), and GAD67. 61 62 EXPERIMENTAL PROCEDURES 63
Animals - All experiments were performed according to procedures conforming to European 64
legislative, administrative and statutory regulations governing the protection of animals used for 65
experimentation or other scientific purposes (86/609/EEC). The study design was approved by the 66
Regional Experimental Care and Use Committee (Auvergne CREEA). The permit number for this 67
study was CE 8-06. 68
We used male C57Bl/6J (Charles River, L’Arbresle, France) mice aged seven weeks and weighing 19 69
to 20g at the start of experiment. They were housed at 20-22°C under a 12-hour light/12-hour dark 70
cycle. 71
Four control mice were used for specific localization of the NAc, with the aim of positioning the voxel 72
of interest (VOI) precisely on MR images for NMR spectroscopy acquisitions. These mice were 73
anesthetized and fitted with a cannula (outer diameter=0.23mm and length=4.5mm) implanted 74
unilaterally at the stereotaxic coordinates of the NAc, defined as in the Paxinos and Franklin (23) 75
mouse brain atlas (coordinates with respect to bregma: A: +1.5 mm, L=0.9 mm, V=-4.0 mm). One 76
week after surgery, MR images were acquired to visualize the trace left by the cannulae, to define 77
anatomical landmarks and thus to localize the NAc precisely, to ensure the reproducible positioning of 78
the VOI in the NAc. 79
Forty mice received i.p. injections, once daily, at 2.00 pm, for five days, of saline (0.1 ml) (20 saline-80
treated mice, controls) or an equivalent volume of 25 mg.kg-1 1-methyl-4-phenyl-1,2,3,6-81
tetrahydropyridine (MPTP; Sigma-Aldrich, St Louis, MO, USA) in saline (20 MPTP-intoxicated 82
mice), as previously described (9,24). From them, twenty mice (10 controls and 10 MPTP-intoxicated 83
mice) were assessed by behavioral tests and the other twenty mice were used for 1H NMR 84
spectroscopy and immunohistochemistry analysis. 85
Behavior - All behavior tests were carried out between 8.00 am and 1.00 pm, for both groups 86
of animals. The rotarod (25,26) and pole tests (26,27) were started the morning before the first saline 87
or MPTP injection (d-5) and were performed three days (d3) and ten days (d10) after the last injection 88
(fig 1). On d10, animals were tested 60 minutes after the i.p. administration of saline (0.2 ml) and the 89
following day (d11), 60 minutes after levodopa/benserazide i.p. administration at the dose that we 90
previously used: 200 mg.kg-1/75 mg.kg-1 in 0.2 ml saline (10). 91
Rotarod test - The animals were positioned on the rotarod (TSE systems GmbH, Bad Homburg, 92
Germany). The rotarod was programmed to rotate such that its speed increased linearly from 4 to 40 93
rpm in 300 seconds. An automatic sensor was used to determine the point at which the animals fell off 94
the rod and to calculate the total time, in seconds, spent on the rod. On the days of testing, mice were 95
trained to stay on the rod during three 60 s sessions, separated by intervals of 10 minutes. The rod did 96
not turn at all during the first training session, and it turned at a fixed of 4 rpm in the two next. The test 97
phase started 30 minutes later and consisted of four successive trials separated by 15-minute inter-trial 98
intervals. The mean total time spent on the rod in the four trials was determined and is given together 99
with the standard deviation (SD) for each group. 100
Pole test - The pole test involved the use of a 50 cm high wooden pole, 0.5 cm in diameter, wrapped in 101
gauze to prevent slipping and positioned with the base in the home cage (26,27). An eraser was glued 102
on top of the pole to help position the animals on the pole. The time at which the animal turned nose 103
down (Tturn in s) and the total time required to climb down the pole (locomotion activity time, TLA in s)
104
were measured, with a maximum value of 120 s. If the mouse failed to turn nose down and instead 105
dropped from the pole, TLA was taken as 120 s (the default value), because this was assumed to
106
indicate the maximal severity. During testing sessions at d-5, d3 and d10, each animal underwent three 107
successive trials, with a five-minute interval between trials. The data presented are the scores obtained 108
during the third trial and are expressed as the mean ± SD for each group of animals. 109
In vivo 1H NMR spectroscopy - In vivo NMR spectra were acquired at 9.4 T, on a Bruker 110
Avance DRX 400 micro-imaging system with a wide-bore vertical magnet and an actively shielded 111
gradient coil (Bruker, Ettlingen, Germany). The animals were assessed between 10 and 17 days after 112
the last MPTP or saline injection (fig 1: d10 to d17) and NMR spectra were acquired after saline 113
administration (0.2 ml; i.p.). To assess the impact of levodopa administration on the metabolites 114
amounts, one week later each animal was assessed again (fig 1: d17 to d24) after levodopa/benserazide 115
administration (i.p.; 200 mg.kg-1/75 mg.kg-1 in 0.2 ml saline). The animals were anesthetized by 116
spontaneous inhalation, through a mask, of 1-2.4 % isoflurane and air (300 ml.min-1). They were 117
carefully secured in a Bruker MicroMouse 2.5 animal handling system with their heads positioned in 118
the center of a 20 mm diameter birdcage radiofrequency coil for excitation and signal reception. The 119
air temperature surrounding the mouse chamber was maintained at 39°C by the circulation of warm 120
air, under the control of a heat sensor. The mice breathed freely during the NMR acquisition and the 121
concentration of anesthetic was adjusted to maintain respiratory rate close to 80 bpm. 122
The positions of the VOIs were determined on T2-weighted images (a single-shot multi echo -RARE
123
sequence- echo time 36 ms, recycling time 4.5 s, 19 slices 0.8 mm thick) in accordance with data from 124
the Paxinos and Franklin atlas (23). The dorsal striatum VOI was 8 µl (2×2×2 mm) in size. The 125
position of the NAc VOI was determined from anatomical landmarks defined by viewing the trace left 126
by the cannula on the magnetic resonance images in relation with the mouse brain atlas. The 127
anatomical landmarks were the end of the lateral ventricle and the anterior part of the anterior 128
commissure. The NAc VOI was 1.56 µl (1.16×1.16×1.16 mm) in size. NMR spectra were obtained for 129
both structures, for each animal. All first- and second-order shim terms were manually adjusted for the 130
VOIs. Generally, a half-height linewidth of the water signal of 12 Hz was achieved in the dorsal 131
striatum. The linewidth of the water signal was around 15 Hz in the NAc voxel. A point-resolved 132
spectroscopy sequence (PRESS) was used for located signal acquisition (TE = 8.8 ms; TR = 4000 ms; 133
spectral width = 5000 Hz). The water signal from the VOIs was suppressed by variable-power RF 134
pulses with optimized relaxation delays (VAPOR) (28). Each spectrum acquired for the dorsal 135
striatum corresponded to a mean of 512 scans whereas each spectrum acquired for the NAc 136
corresponded to a mean of 1024 scans. A spectrum was acquired in the same conditions without 137
VAPOR water suppression for the absolute quantification of metabolites. For brain 1H NMR 138
spectroscopy, resonances of low-molecular weight metabolites, such as lactate (Lac), N-acetyl 139
aspartate (NAA), total creatine (creatine and phosphocreatine; tCr), total choline 140
(glycerophosphocholine and choline; tCho), glutamate + glutamine (Glx) and myo-inositol (Myo-Ins) 141
overlapped with those of macromolecules (proteins and lipids). To minimize the contribution of 142
macromolecules to the absolute quantification of the metabolites, we acquired a macromolecules 143
spectrum applying the metabolite-nulling technique (29,30). A PRESS sequence was used with an 144
extra inversion pulse. Before this study, the inversion time recovery (TI) was adjusted to nullify the 145
metabolite signal in the dorsal striatum and NAc of four mice. A TI of 923 ms was defined. 146
To correct the metabolite concentration, the T1 and T2 relaxation times of water and NAA, tCr, tCho,
147
Glx, Tau and Myo-Ins were calculated from spectra acquired in the two voxels, as previously 148
published (9,10). Each spectrum corresponded to a mean of 4 or 128 scans for water and metabolites 149
T1 and T2 determinations, respectively. Signals were acquired with an echo time of 8.8 ms and five
150
different recycling times (TR1-5 = 1000/2000/4000/8000/10000 ms) for longitudinal relaxation time
151
(T1) measurements and with TR=4000 ms and 10 different echo times (TE1-10 =
8.8/20/30/40/60/80/100/130/180/250 ms) for transversal relaxation time (T2) measurements. The
153
relaxation times (T1 and T2) measured were in accordance with those previously published (9). 154
In vivo metabolite concentrations were determined from VOI spectra after subtraction of the 155
macromolecules spectrum with jMRUI software. The quantification method used was the time-domain 156
semi-parametric algorithm QUEST, based on signals for a basis set of simulated metabolites. This 157
basis set of metabolites included the following nine molecules: tCr, tCho, GABA, Glu, Gln, Lac, Myo-158
Ins, NAA and Tau. The intensity of the water signal obtained from non- suppressed water spectra was 159
used as an internal reference. For this purpose, we determined the brain water content for four control 160
mice and four MPTP-intoxicated mice. Animals were killed by decapitation and their brains were 161
quickly removed and dried in a drying oven. The percentage water content was calculated from the 162
difference in weight between the freshly removed whole brain and its residue after dehydration. The 163
water content of controls mouse brain was 78.6% ± 2.4%, whereas that of MPTP-intoxicated mouse 164
brain was 79.6% ± 1.8% (values similar to published data, 9,31,32). We assumed the visibility of the 165
water signal to be 100% and used a water molarity of 55.5M. Corrections were performed to take 166
account of the T2 and T1 effects of water and metabolites, as previously described (9,10). For each
167
metabolite, we applied the T1 correction factor (1/1-exp(-TR/T1)) with TR=4s and the T2 correction factor
168
(1/exp(-TE/T2)) with TE=8.8 ms. 169
The reliability of metabolite quantification was assessed from the average Cramer-Rao lower bounds 170
(CRLB) calculated by jMRUI. CRLB are estimates of the % SD of the fit for each metabolite (33,34). 171
Only results with a CRLB ≤ 30% were included in the analysis. In vivo results are expressed in mM, as 172
means ± SD. 173
Immunohistochemical labels- 174
Tissue preparation - Following the acquisition of NMR spectra, five controls and five MPTP-175
intoxicated mice chosen at random were killed 60 minutes after the i.p. injection of saline. Five 176
controls and five MPTP-intoxicated mice, also chosen at random were killed 60 minutes after the i.p. 177
injection of levodopa/benserazide (i.p.; 200 mg.kg-1/75 mg.kg-1 in 0.2 ml saline). These animals were 178
deeply anesthetized with sodium pentobarbital (180 mg.kg-1; i.p.) and then transcardially perfused with 179
4% paraformaldehyde in 0.1 M phosphate buffer (pH 7.4). Their brains were removed, post-fixed by 180
incubation in the same buffer for 1 h at 4°C and included in paraffin. We prepared 7 µm coronal 181
sections from the substantia nigra (SNc) and the ventral tegmental area (VTA) for tyrosine 182
hydroxylase (TH) immunohistochemistry, to validate the DA loss after MPTP intoxication. We also 183
prepared 7 µm coronal sections from the dorsal striatum and the NAc for glutamate (Glu), glutamate 184
decarboxylase (GAD) isoform GAD67 and glutamine synthetase (GS) analyses. 185
Immunohistochemical staining - Tissue sections were deparaffinized by incubation with xylene and 186
were then rehydrated. Antigen retrieval was performed by bringing slides to the boil in 10 mM sodium 187
citrate, pH 6.0, maintaining them just below boiling point for 20 minutes, and then cooling them at 188
20°C for 20 minutes. The sections were then washed for five minutes in distilled water and 10 minutes 189
in wash buffer [0.1% Tween 20, 50 mM NaF in 1X Tris-buffer saline (TBS)], then incubated for 10 190
minutes in buffer containing 3% H2O2 (Peroxidase blocking solution DAKOCytomation, Carpinteria,
191
CA, USA). They were then washed again in the wash buffer for 10 minutes. The SNc and VTA 192
sections were incubated overnight at 4°C with a rabbit polyclonal anti-TH antibody (1:500; Chemicon 193
International, Temecula, CA, USA). The dorsal striatum and NAc sections were incubated overnight 194
at 4°C with a rabbit polyclonal anti-Glu antibody (1:5; Chemicon International), a mouse monoclonal 195
anti-GAD67 antibody (1:500; Chemicon International), or a mouse monoclonal anti-GS antibody 196
(1:300; Chemicon International). The slides were washed and treated with biotinylated secondary 197
antibody (Kit LSAB + System-HRP, DAKOCytomation) for 30 minutes at 20°C. The slides were then 198
washed in 0.1% Tween 20 in 1X TBS, incubated for 30 minutes at 20°C with streptavidine-HRP 199
complex (DAKOCytomation) and washed again in 0.1% Tween 20 in 1X TBS. Diaminobenzidine 200
substrate (DAKOCytomation) was added and the slices were incubated at 20°C. The reaction was 201
stopped by immersing the slides in distilled water, and the slides were sealed for visualization by light 202
microscopy. 203
Quantitative analysis of immunostained cells - The immunostained cells were counted automatically 204
on recorded images, with IPS 32 software (SAMBA 2005, SAMBA Technologies, Meylan, France). 205
For each group of animals, we show the total number of positive cells, expressed as mean ± SD. 206
Statistical analysis - NMR data were compared by two-way analysis of variance (ANOVA) with 207
repeated measures for one factor (treatment: saline and levodopa). A Dunnett post-hoc test was carried 208
out if the ANOVA was significant. Behavioral data were compared by repeated measures ANOVA, 209
followed by a Newman-Keuls post-hoc test if the ANOVA was significant. The numbers of 210
immunostained cells in the four groups of mice were compared in a two-way ANOVA, which was 211
followed by a Dunnett post-hoc test if the ANOVA was significant. Analyses were performed with 212
SAS V.8.1 statistical software (Cary, NC, USA). The concentrations of GABA, Glu and Gln in the 213
NAc, as determined by NMR spectroscopy, are expressed as a function of the number of TH-214
immunoreactive cells in the VTA. Linearity was assessed by calculating the correlation coefficient r. 215
216
RESULTS 217
Number of dopaminergic neurons in the SNc and VTA - MPTP intoxication significantly 218
decreased (by 85 %) the mean number of TH-immunoreactive neurons in the SNc, as shown by 219
comparison with control values (fig 2; 66 ± 13 vs 428 ± 36 TH-immunoreactive positive cells, 220
respectively; p < 0.001). Levodopa administration had no impact on the number of TH-221
immunoreactive neurons in the SNc of controls (428 ± 36 vs. 417 ± 54) or of MPTP-intoxicated mice 222
(66 ± 13 vs. 63 ± 17). The mean number of TH-immunoreactive neurons in the VTA decreased by 44 223
% after MPTP intoxication (fig 2; 88 ± 13 TH-immunoreactive positive cells for controls vs 49 ± 10 224
TH-immunoreactive positive cells for MPTP-intoxicated mice; p < 0.05). Levodopa administration 225
also had no effect on the number of TH-immunoreactive neurons in the VTA of controls (88 ± 13 vs 226
90 ± 8) or of MPTP-intoxicated mice (49 ± 10 vs 43 ± 12). DA denervation was homogeneous in the 227
SNc, while there was a large interindividual variation of the lesion in the VTA (see below). 228
Behavior changes after MPTP intoxication - The performance of control and MPTP-229
intoxicated animals in the rotarod test (fig 3) was assessed as the total time spent on the rod, expressed 230
in seconds. The animals in the control group spent significantly more time on the rod in the third trial 231
session (d10) than at d-5 and d0 (d10: 164 ± 9 s vs d-5: 103 ± 10 s and vs d3: 114 ± 10 s; **p<0.01). 232
Significantly more time was spent on the rod on d10, than on the following day, after levodopa 233
administration (200 mg.kg-1; i.p.) (d10: 164 ± 9 s vs d11: 127 ± 15 s; **p<0.01). Whereas controls 234
performed significantly better in the third assessment than during the first two assessments, MPTP-235
intoxicated mice spent similar amounts of time on the rod at d-5, d3 and d10. Levodopa administration 236
significantly improved rotarod performance in MPTP-intoxicated mice (d11: 157 s ± 14 s vs d10: 116 237
± 9 s; **p<0.01). Thus, controls spent more time on the rod than MPTP-intoxicated mice at d10 (164 s 238
± 9 s vs 116 s ± 9 s; #p<0.05) but less time than MPTP-intoxicated mice on day 11, after levodopa 239
administration (127 s ± 15 s vs 157 s ± 14 s; #p<0.05). 240
In the pole test, MPTP-intoxicated mice needed significantly more time to turn completely than 241
controls at d10 (fig 4A: MPTP-intoxicated mice: 7.1 ± 2.6 s vs controls: 2.2 ± 0.4 s; ##p<0.01). 242
Furthermore MPTP-intoxicated mice required significantly longer to turn at d10 than before MPTP 243
injection (d10: 7.1 ± 2.6 s vs d-5: 1.9 ± 0.2 s; **p<0.01). Levodopa administration (200 mg.kg-1; i.p.) 244
at d11 tended to decrease the amount of time required for turning, but this difference was not 245
significant (d10: 7.1 ± 2.6 s vs d11 (+Ldopa): 4.4 ± 1.1 s; p=0.13). The time required for the control 246
mice to turn did not differ between the three testing sessions, but these mice tended to take longer to 247
reach the floor after levodopa administration (200 mg.kg-1; i.p.). At d10, MPTP-intoxicated mice 248
required significantly longer to reach the floor than control mice (fig 4B: MPTP-intoxicated mice: 249
13.7 ± 2.9 s vs controls: 8.2 ± 0.9 s; #p<0.05). Furthermore, the time required for MPTP-intoxicated 250
mice to reach the floor at d10 was significantly greater than that before MPTP injection (d10: 13.7 ± 251
2.9 s vs d-5: 7.6 ± 0.7 s; **p<0.01). Levodopa administration at d11 significantly decreased this time 252
(d10: 13.7 ± 2.9 s vs d11 (+Ldopa): 9.7 ± 1.5 s; *p<0.05). 253
Metabolite levels in the dorsal striatum and NAc, as assessed in vivo by 1H-NMR spectroscopy 254
- In vivo 1H NMR spectra for the corresponding brain regions are shown in figure 5. The spectra 255
shown in figure 5A were acquired from the dorsal striatum of a control mouse and a MPTP-256
intoxicated mouse after saline injection and levodopa (200 mg.kg-1) administration. Those in figure 5B 257
were from the NAc. The resulting high degree of spectral resolution permitted unequivocal signal 258
assignment. In addition to the usual signals for NAA (2.008 ppm), tCr (3.022 ppm) and tCho (3.22 259
ppm), the resonances of several brain metabolites Glu (2.34 ppm), Gln (2.42 ppm), GABA (2.28 ppm), 260
Lac (1.33 ppm), Tau (3.24-3.42 ppm) and Myo-Ins (3.48-3.52 ppm) were clearly resolved. Thus, nine 261
brain metabolites were reliably quantified. NAA, tCr, Tau and Glu were quantified in the two brain 262
regions with Cramer-Rao lower bounds (CRLB, defined by the jMRUI software) ≤ 12% (data not 263
shown). Gln, GABA, tCho, Myo-Ins and Lac were quantified with CRLB between 15 and 30%. 264
For controls, the metabolites profile obtained for the NAc and dorsal striatum were similar in the basal 265
state (fig 5). 266
The Glu, Gln and GABA concentrations obtained in vivo in the basal state were significantly higher in 267
the dorsal striatum of MPTP-intoxicated mice than in that of controls (fig 6A; Glu: 19.1 ± 1.5 vs. 10.6 268
± 2.3 mM, ***p < 0.001; Gln: 5.9 ± 1.6 vs. 2.6 ± 1.1 mM, *p < 0.05; GABA: 3.9 ± 0.9 vs. 2.1 ± 0.5 269
mM, *p < 0.05). Levodopa decreased metabolite levels in the dorsal striatum of MPTP-intoxicated 270
mice (Glu: 19.1 ± 1.5 vs. 10.2 ± 3.4 mM, ###p < 0.001; Gln: 5.9 ± 1.6 vs. 2.5 ± 0.9 mM, #p < 0.05; 271
GABA: 3.9 ± 0.9 vs. 2.0 ± 0.8 mM, #p < 0.05). Metabolite levels in the dorsal striatum of MPTP-272
intoxicated mice treated with levodopa did not differ significantly from those in the dorsal striatum of 273
controls. DA denervation in VTA and replacement with levodopa had no effect on the mean 274
metabolite levels the NAc (fig 6B). 275
While individual data for MPTP-intoxicated mice obtained in the striatum and the percentage of DA 276
denervation of the SNc were homogeneous (fig 7A), those measured in the NAc showed that GABA, 277
Glu and Gln levels were the higher for animals which had a severe DA denervation, which were 278
decreased after levodopa administration (fig 7B). A DA denervation of 59% in the VTA (mean 279
denervation for the three animals which have the more severe DA denervation in the VTA) was 280
necessary to induce changes in metabolites levels. Furthermore, the concentrations of GABA, Glu and 281
Gln in the NAc were significantly and inversely correlated with the number of TH-immunoreactive 282
neurons in the VTA (respectively r = -0.7834, p<0.05; r = -0.9896, p<0.01 and r = -0.8403, p<0.05). 283
GAD67, Glu and GS labeling in the dorsal striatum and NAc - Immnuohistochemical labeling 284
of GABAergic neurons with a monoclonal GAD67 antibody revealed a high density of intensely 285
stained neurons throughout all parts of the dorsal striatum and the NAc (fig 8A). Labeling with the 286
anti-Glu antibody revealed the presence of a high density of Glu-positive granules in the dorsal 287
striatum and NAc, corresponding to the intra- and extracellular pool of Glu. GS immunoreactivity was 288
demonstrated in the cytoplasm and processes of glial cells in the two areas of the brain studied. 289
In the dorsal part of the striatum, MPTP intoxication increased the number GAD67-positive neurons to 290
levels significantly higher than those for controls (fig 8B; 2883 ± 238 vs 1501 ± 64; p<0.001). The 291
number of Glu-positive granules was also higher in the dorsal striatum of MPTP-intoxicated mice than 292
controls (11455 ± 1560 vs 5399 ± 446; p<0.01). Furthermore, the number of GS-positive astrocytes 293
was significantly higher in the dorsal striatum of MPTP-intoxicated mice than in that of controls (7283 294
± 585 vs 3440 ± 454; p<0.01). Levodopa administration had no impact on the number of GAD-295
immunoreactive neurons, Glu-positive granules and GS-positive astrocytes in the dorsal striatum of 296
controls and MPTP-intoxicated mice. DA denervation or replacement with levodopa had no impact on 297
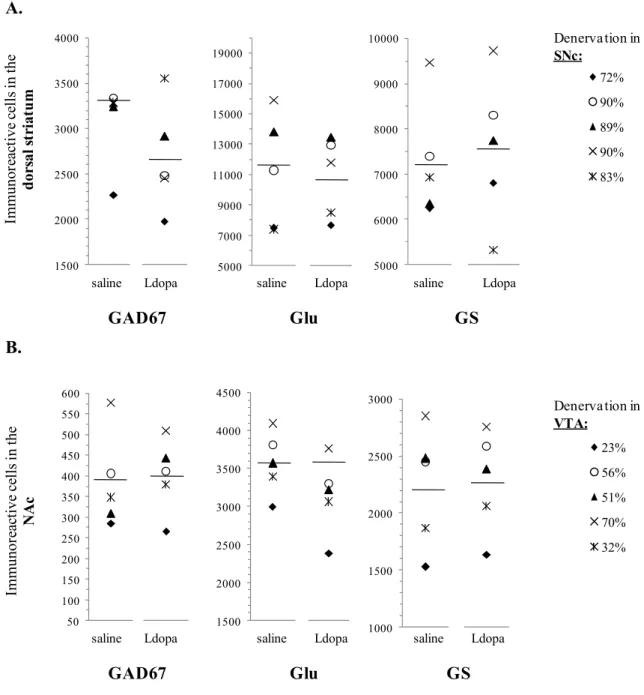
the mean number of positive neurons, granules and astrocytes in the NAc (fig 8B). However, 298
individual data showed that GAD67, Glu and GS positive cells assessed in the NAc were higher for 299
animals which had a severe DA denervation in the VTA (fig 9B). 300
301
DISCUSSION 302
This work illustrated the possibility to follow in vivo, using short-echo PRESS NMR localized 303
spectroscopy, the metabolites levels in a small volume (1.56 µl) encompassing the NAc. We first 304
showed that the metabolic profile of this structure was identical to this obtained in the dorsal striatum. 305
Secondly, the MPTP intoxication of the mice increased GABA, Glu and Gln concentrations in the 306
dorsal striatum and in the NAc showing that the DA denervation was sufficient in the VTA (>59%). 307
Thirdly, levodopa decreased metabolite levels in the dorsal striatum of MPTP-intoxicated mice and in 308
the NAc for MPTP-intoxicated animals which showed the highest levels of GABA, Glu and Gln. 309
Finally, changes in metabolites concentrations in the dorsal striatum and in the NAc were associated 310
with changes in Glu metabolism, as shown by immunohistochemistry and characterized by an increase 311
in the number of GAD67-reactive-neurons, Glu-positive granules and GS-positive astrocytes. 312
313
In this study, jMRUI fitting to the spectra acquired for the NAc yielded the same 314
neurochemical profile as obtained for the dorsal striatum. Anatomically, the NAc is a major part of the 315
ventral striatum and the cell types present are similar to those in the dorsal striatum. Indeed, 90% of 316
the neurons in the NAc are GABAergic medium spiny neurons and the axon terminals in the NAc are 317
mainly DA terminals from the VTA and glutamatergic neurons from the prefrontal cortex (35). It is 318
therefore not particularly surprising that the metabolic profiles of these two structures are similar. 319
Glu and GABA levels in the dorsal striatum, as assessed by 1H NMR spectroscopy were 320
dramatically increased after MPTP intoxication. Changes were also observed in the NAc for animals 321
which had the most severe VTA denervation (>59%). In fact, change in metabolites levels in the 322
striatum depends on the severity of the dopaminergic lesion of the SNc and the VTA, which induces in 323
turn a dramatic decrease of dopamine level in the dorsal and ventral striatum. Indeed, all studies which 324
reported changes in glutamatergic cortico-striatal and GABAergic activity in the dorsal striatum have 325
been shown in animal models to display a decrease of more than 60% in the number of DA neurons in 326
SNc (9,10,36). Furthermore, Retaux et al. (19), showed that a bilateral total electrolytic lesion of the 327
VTA in the rat induced an increase in GAD67 mRNA levels in the anterior and core part of the NAc. 328
In our study, MPTP intoxication decreased the number of DA neurons by a mean of 85% in the SNc, 329
and 44% in the VTA which may explain why no significant change of mean metabolites levels was 330
observed in the NAc. The different profile of dopaminergic denervation in the SNc and the VTA could 331
be due to a specific sensivity of dopaminergic neurons to MPTP. A more severe dopaminergic 332
denervation in the SNc than in the VTA is commonly observed in other studies using MPTP (37-39). 333
Furthermore, in PD, highly vulnerable DA subpopulations within the SNc and their axonal projections 334
to dorsal parts of the striatum are almost completely lost, whereas neighboring DA subpopulations 335
within the VTA and their projections to the NAc have much higher survival rates (1,40). The 336
dopamine deficiency is thus much greater in the dorsal striatal than in the NAc (12). 337
Taken together, these results suggest that changes in metabolites levels in the NAc and the dorsal 338
striatum may be linked to the severity of DA denervation in the VTA and the SNc and could be used 339
as marker of the severity of the disease. Other studies assessing the relationship between the severity 340
of the dopaminergic lesion in SNc and VTA and the change in striatal metabolite levels are mandatory 341
to confirm this hypothesis. 342
The increase in Glu levels observed after MPTP intoxication was consistent with the increase 343
in the number of Glu-positive granules observed on immunohistolabeling. It confirmed our previous 344
results (9,10) and it was in accordance with several other studies showing long-term changes in 345
excitatory striatal inputs after dopamine depletion, such as an increase in striatal Glu release, in mean 346
percentage of asymmetrical synapses and phosphorylation, and in the abundance of Glu receptor 347
subunits (36,41-44). The high levels of GABA after MPTP intoxication were consistent with the 348
increase in the number of GAD67-immunoreactive neurons in the dorsal striatum and the NAc of 349
dopamine-depleted mice. These changes were due to an increase in the basal activity of striatal 350
neurons following DA denervation, because GAD67 expression is considered to be an index of 351
GABAergic striatal efferent neuron activity (45,46). And several other studies showed an increased in 352
the electrical activity of GABAergic neurons (47), the enhanced release of GABA (48) and an increase 353
in GAD67 mRNA levels (49). 354
Finally, the increase in Gln levels after MPTP intoxication was associated with higher GS 355
immunolabeling in the dorsal striatum and in the NAc of MPTP-intoxicated mice. These results 356
suggested that DA denervation modifies glial activity. Similarly, a recent study clearly demonstrated a 357
relationship between GLT-1, a glial high-affinity Na+/K+-dependent Glu transporter, and changes in 358
extracellular Glu levels in the dorsal striatum of hemi-parkinsonian rat (50). The authors showed an 359
upregulation of both the production and function of striatal GLT-1 after unilateral 6-OHDA lesioning. 360
They hypothesized that an interplay between several glial and vesicular Glu transporter families might 361
underlie abnormal glutamatergic neurotransmission in PD. There are several possible reasons for the 362
increase in glial activity in the dopamine-depleted dorsal striatum. Firstly, the DA denervation may 363
directly induce an increase in GS activity and, thus, glial hyperactivity. Secondly, the increase in Gln 364
levels in the neuronal and/or the glial in the striatum of MPTP-intoxicated mice may be related to an 365
increase in the Glu/Gln cycling and, by inference, synaptic glutamatergic transmission. Glu released 366
by glutamatergic neurons has been shown to be taken up from the synapses rapidly by glia, through 367
high-affinity Glu transporters, and converted into Gln by GS (51) Gln is subsequently released by 368
astrocytes and taken up by neuronal terminals, in which it is converted enzymatically (glutaminase) 369
back into Glu, thereby replenishing the neurotransmitter pool of Glu. This Glu/Gln cycle between 370
neurons and astrocytes predominantly reflects the rates of Glu release and reuptake, thus providing an 371
indication of synaptic glutamatergic activity (52-55). 372
The present investigation did not show changes in other amino acids absolute levels after MPTP 373
intoxication in the dorsal striatum and the NAc. Our results could be consistent with the absence of 374
neuronal death in the striatum of PD. Furthermore, abundant NAA levels in unaffected GABAergic 375
cells within the striatum may be masking its depletion, as dopaminergic nerve terminals affected by 376
MPTP represent only 9% of all synapses in the striatum (56). 377
A single challenge dose of levodopa (200 mg.kg-1) normalizes Glu, Gln and GABA levels in 378
the dorsal striatum of MPTP-intoxicated mice, and also in the NAc for mice which had high GABA, 379
Glu and Gln levels following severe dopaminergic denervation in VTA. This high dose of levodopa 380
induced a decrease in the motor performance of controls probably related to the sedative effect of 381
levodopa (57), but we nonetheless chose to use this dose, which is known to induce behavioral 382
changes (58) and changes in levels of striatal metabolites (59) in MPTP-intoxicated mice. This high 383
dose of levodopa may attenuate hyperactivity of the glutamatergic cortico-striatal pathway, thereby 384
decreasing the levels of Glu and, subsequently, Gln and GABA. Changes in Glu, Gln and GABA 385
levels were not associated with changes in the intensity of immunolabelings performed 60 minutes 386
after acute levodopa administration. Carta et al. (60) showed that, three days after priming, a single 387
administration of levodopa yielded changes in GAD67 mRNA levels in all striatal neurons not 388
observed in drug-naïve 6-OHDA-lesioned rats. We suggest that the short time interval between 389
levodopa administration and immunolabelings (60 minutes) might account for the lack of change in 390
the staining observed. 391
In this study, we chose to use the rotarod and pole tests to assess the motor behavior of mice. 392
The rotarod test is widely used in the evaluation of MPTP models (61). We observed significant 393
differences in performance between MPTP-intoxicated mice and controls. In general, the results 394
obtained depended strongly on the dose of the toxin administered. Low and moderate MPTP doses 395
produced no measurable impairment, whereas higher doses, such as that used here, have been shown 396
to trigger performance deficiencies in the rotarod test (62). The pole test was used to assess the agility 397
of the animals (27,61,62). This task involved skilled grasping by the forelimbs and maneuvering 398
requiring the basal ganglia to be intact. The decrease in pole test performance described here was 399
consistent with that reported in previous studies (26) and reflected a nigrostriatal dysfunction. 400
Levodopa administration improved the rotarod performance and also the results to the pole test of 401
MPTP-intoxicated mice. Taken together, these behavior results reflect a dysfunction of the basal 402
ganglia that was improved by levodopa administration and thus confirms a striatal dopaminergic 403
deficit following the dopaminergic lesion induced by MPTP in the SNc and the VTA. 404
In conclusion, localized 1H NMR spectroscopy assessed the metabolic profile longitudinally in 405
vivo according to the animal model and the therapeutic strategy in the dorsal striatum and NAc of the 406
mice. A sufficient DA denervation in the VTA and the SNc induced increased levels of Glu, Gln and 407
GABA in the NAc and the dorsal striatal nerve cell terminals. 408
ACKNOWLEDGEMENTS
This work was supported by a France Parkinson Foundation grant. The funders had no role in study design, data collection and analysis, decision to publish, or preparation of the manuscript.
REFERENCES
1. Damier P, Hirsch EC, Agid Y, Graybiel AM. The substantia nigra of the human brain. II. Patterns of loss of dopamine-containing neurons in Parkinson's disease. Brain 1999; 122: 1437-1448.
2. Nagatsu T, Sawada M. Biochemistry of postmortem brains in Parkinson’s disease: historical overview and future prospects. J. Neural. Transm. Suppl. 2007; 72: 113-120.
3. Haber SN. The primate basal ganglia: parallel and integrative networks. J. Chem. Neuroanatomy. 2003; 26: 317-330.
4. Liss B, Haeckel O, Wildmann J, Miki T, Seino S, Roeper J. K-ATP channels promote the differential degeneration of dopaminergic midbrain neurons. Nat. Neurosci. 2005; 8: 1742-1751.
5. Lees AJ. The Parkinson chimera. Neurology. 2009; 72: S2-11.
6. Fudge JL, Kunishio K, Walsh C, Richard D, Haber SN. Amygdaloid projections to ventromedial striatal subterritories in the primate. Neuroscience. 2002; 110: 257-275.
7. Flaherty AW, Graybiel AM. Input-output organization of the sensorimotor striatum in the squirrel monkey. J. Neurosci. 1994; 14: 599-610.
8. McFarland NR, Haber SN. Convergent inputs from thalamic motor nuclei and frontal cortical areas to the dorsal striatum in the primate. J. Neurosci. 2000; 20: 3798-3813.
9. Chassain C, Bielicki G, Durand E, Lolignier S, Essafi F, Renou JP, Traore A, Durif F. Metabolic changes detected by proton magnetic resonance spectroscopy in vivo and in vitro in a murin model of Parkinson's disease, the MPTP-intoxicated mouse. J. Neurochem. 2008; 105: 874-882.
10. Chassain C, Bielicki G, Keller C, Renou JP, Durif F. Metabolic changes detected in vivo by
1H MRS in the MPTP-intoxicated mouse. NMR in Biomed. 2010; 23: 547-563.
11. Heikkila R, Hess A, Duvoisin R. Dopaminergic neurotoxicity of 1-methyl-4phenyl-1,2,3,6-tetrahydropyridine in mice. Science. 1984; 224: 1451-1453.
12. Hornykiewicz O. Biochemical aspects of Parkinson’s disease. Neurology.1998; 51: S2-9. 13. Cilia R, Ko JH, Cho SS, van Eimeren T, Marotta G, Pellecchia G, Pezzoli G, Antonini A,
Strafella AP. Reduced dopamine transporter density in the ventral striatum of patients with Parkinson’s disease and pathological gambling. Neurobiol. of Disease. 2010; 39: 98-104. 14. Yagi S, Yoshikawa E, Futatsubashi M, Yokokura M, Yoshihara Y, Torizuka T, Ouchi Y.
Progression from unilateral to bilateral parkinsonism in early Parkinson disease: implication of mesocortical dopamine dysfunction by PET. J Nuclear Medicine. 2010; 51: 1250-1257.
15. Thobois S, Ardouin C, Lhommée E, Klinger H, Lagrange C, Lagrange C, Xie J, Fraix V, Coelho Braga MC, Hassani R, Kistner A, Juphard A, Seigneuret E, Chabardes S, Mertens P,
Polo G, Reilhac A, Costes N, LeBars D, Savasta M, Tremblay L, Quesada JL, Bosson JL, Benabid AL, Broussolle E, Pollak P, Krack P. Non-motor dopamine withdrawal syndrome after surgery for Parkinson’s disease: predictors and underlying mesolimbic denervation.Brain. 2010; 133: 1111-1127.
16. Aarsland D, Bronnick K, Alves G, Tysnes OB, Pedersen KF, Ehrt U, Larsen JP. The spectrum of neuropsychiatric symptoms in patients with early untreated Parkinson's disease. J. Neurol. Neurosurg. Psychiatry. 2009; 80: 928-30.
17. Chaudhuri KR, Schapira AH. Non-motor symptoms of Parkinson's disease: dopaminergic pathophysiology and treatment. Lancet Neurol. 2009; 8: 464-474.
18. Rodriguez-Oroz MC, Jahanshahi M, Krack P, Litvan I, Macias R, Bezard E, Obeso JA. Initial clinical manifestations of Parkinson's disease: features and pathophysiological mechanisms. Lancet Neurol. 2009; 8: 1128-1139.
19. Retaux S, Trovero F, Besson M J. Role of dopamine in the plasticity of glutamic acid decarboxylase messenger RNA in the rat frontal cortex and the nucleus accumbens. Eur. J. Neurosci. 1994; 6: 1782-1791.
20. Mangia S, Tkac I, Gruetter R, Van de Moortele PF, Maraviglia B, Ugurbil K. Sustained neuronal activation raises oxidative metabolism to a new steady-state level: evidence from 1H NMR Spectroscopy in the human visual cortex. J. Cereb. Blood Flow Metab. 2006; 27: 1055-1063.
21. Mangia S, Giove F, Tkac I, Logethetis NK, Henry PG, Olman CA, Maraviglia B, Di Salle F, Ugurbil K. Metabolic and hemodynamic events after changes in neuronal activity: current hypothesis, theoretical predictions and in vivo NME experimental findings. J. Cereb. Blood Flow Metab. 2009; 29: 441-463.
22. Van den Berg C. Glutamate and Glutamine. Pp. 355-376 In: Handbook of Neurochemistry 1970; vol 3 (Lajha A, ed), New York, Plenum.
23. Paxinos G, Franklin KBJ. The mouse brain in stereotaxic coordinates. Academic Press. 2001. 2nd edition.
24. Monaca C, Laloux C, Jacquesson JM, Gele P, Marechal X, Bordet R, Destée A, Derambure P. Vigilance states in a parkinsonian model, the MPTP mouse.Eur. J. Neurosci. 2004; 20: 2474-2478.
25. Rozas G, Labandeira Garcia JL. Drug-free evaluation of rat models of parkinsonism and nigral grafts using a new automated rotarod test. Brain Res. 1997; 749: 188-199.
26. Luchtman DW, Shao D, Song C. Behavior, neurotransmitters and inflammation in three regimens of the MPTP mouse model of Parkinson’s disease. Physiol. Behav. 2009; 98:
130- 27. Ogawa N, Hirose Y, Ohara S, Ono T, Watanabe Y. A simple quantitative bradykinesia test in
MPTP-treated mice. Res. Comm. Chem. Pathol. Pharmacol. 1985; 50: 435-441.
28. Tkac I, Henry PG, Andersen P, Keene CD, Low WC, Gruetter R. Highly resolved in vivo 1H spectroscopy of the mouse brain at 9.4T. MRM. 2004; 52: 478-484.
29. Behar KL, Ogino T. Characterization of macromolecule resonances in the 1H NMR spectrum of rat brain. Magn. Reson. Med. 1993; 30: 38-44.
30. Pfeuffer J, Tkác I, Provencher SW, Gruetter R. Toward an in vivo neurochemical profile: quantification of 18 metabolites in short-echo-time (1)H NMR spectra of the rat brain. J. Magn. Reson. 1999; 141: 104-120.
31. Agrawal HC, Davis JM, Himwich WA. Develop mental changes in mouse brain: weight, water content, and free amino acids. J. Neurochem. 1968; 15: 917-923.
32. Papadopoulos MC, Manley GT, Krishna S, Verkman AS. Aquaporin-4 facilitates reabsorption of excess fluid in vasogenic brain edema. The FASEB. 2004; 18: 1291-1293.
33. Provencher SW. Estimation of metabolite concentrations from localized in vivo proton NMR spectra. Magn. Reson. Med. 1993; 30: 672-679.
34. Cavassila S, Deval S, Huegen C, van Ormondt D, Graveron-Demilly D. Cramer-Rao bounds: an evaluation tool for quantification. NMR Biomed. 2001; 14: 278-283.
35. Zahm D.S. Functional-anatomical implications of the nucleus accumbens core and shell subterritories. Ann. NY Acad. Sci. 1999; 877: 113-28.
36. Jonkers N, Sarre S, Ebinger G, Michotte Y. MK801 suppresses the L-DOPA-induced increase of glutamate striatum of hemi-parkinson rats. Brain Res. 2002; 926: 149-155.
37. Lavoie B, Parent A, Bedard PJ. Effects of dopamine denervation on striatal peptide expression in parkinsonian monkeys. Can J Neurol Sci. 1991; 18: 373-375.
38. Gnanalingham KK, Smith LA, Hunter AJ, Jenner P, Marsden CD. Alterations in striatal and extrastriatal D-1 and D-2 dopamine receptors in the MPTP-treated common marmoset: an autoradiographic study. Synapse. 1993; 14: 184-194.
39. Phani s, Gonye G, Iacovitti L. VTA neurons show a potentially protective transcriptional response to MPTP. Brain Res. 2010; 1343: 1-13.
40. Gonzalez-Hernandez T, Cruz-Muros I, Afonso-Oramas D, Salas-Hernandez J, Castro-Hernandez J. Vulnerability of mesostriatal dopaminergic neurons in Parkinson’s disease. Front. Neuroanat. 2010; 4: 140-154.
41. Anglade P, Mouatt-Prigent A, Agid Y, Hirsch E. Synaptic plasticity in the caudate nucleus of patients with Parkinson's disease. Neurodegeneration. 1996; 5: 121-128.
42. Ingham CA, Hood SH, Taggart P, Arbuthnott GW. Plasticity of synapses in the rat neostriatum after unilateral lesion of the nigrostriatal dopaminergic pathway. J. Neurosci.
1998; 18: 4732-4743.
43. Meshul CK, Emre N, Nakamura CM, Allen C, Donohue MK, Buckman JF. Time-dependent changes in striatal glutamate synspases following 6-hydroxydopamine lesion. Neuroscience. 1999; 88: 1-16.
44. Walker RH, Koch RJ, Sweeney JE, Moore C, Meshul CK. Effects of subthalamic nucleus lesions and stimulation upon glutamate levels in the dopamine-depleted rat striatum. NeuroReport. 2009; 20: 770-775.
45. Litwak J, Mercugliano M, Chesselet MF, Olman G. Increased glutamic acid decarboxylase (GAD) mRNA and GAD activity in cerebellar Purkinje cells following lesion-induced increases in cell firing. Neurosci. Lett. 1990; 116: 179-183.
46. Soghomonian JJ, Martin DL. Two isoforms of glutamate decarboxylase: why? Trends Pharmacol. Sci. 1998; 19: 500-505.
47. Calabresi P, Mercuri NB, Sancesario G, Bemardi G. Electrophysiology of dopamine-denervated striatal neurons. Implication for Parkinson’s disease. Brain. 1993; 11: 433-452. 48. Lindefors N, Brodin E, Tossman U, Segovia H, Ungerstedt U. Tissue levels and in vivo
release of tachychinins and GABA in striatum and substantia nigra of rat brain after unilateral striatal dopamine denervation. Exp. Brain. Res. 2003; 74: 527-534.
49. Carta AR, Fenu S, Pala P, Tronci E, Morelli M. Selective modifications in GAD67 mRNA levels in striatonigral and striatopallidal pathways correlate to dopamine agonist priming in 6-hydroxydopamine-lesioned rats. Eur. J. Neurosci. 2003; 18: 2563–2572.
50. Massie A, Goursaud S, Schallier A, Vermoesen K, Meshul CK, Hermans E, Michotte Y. Time-dependent changes in GLT-1 functionning in striatum of hemi-parkinsonn rats. Neurochem. Int. 2010; 57: 572-578.
51. Bergles DE, Jahr CE. Synaptic activation of glutamate transportes in hippocampla astrocytes. Neuron. 1997; 19: 1297-1308.
52. Sibson NR, Dhankhar A, Mason GF, Rothman DL, Behar KL, Schulman RG. Stoichiometric coupling of brain glucose metabolism and glutamatergic neuronal activity. Proc. Natl. Acad. Sci. USA. 1998; 95: 316–321.
53. Magistretti PJ, Pellerin L, Rothman DL, Shulman RG. Energy on demand. Science. 1999; 283: 496–497.
54. Gruetter R. In vivo 13C NMR studies of compartmentalized cerebral carbohydrate metabolism. Neurochem Int. 2002; 41: 143–154.
55. Yang J, Shen J. In vivo evidence for reduced cortical glutamate-glutamine cycling in rats treated with the antidepressant/antipanic drug phenelzine. Neuroscience. 2005; 135: 927–937.
56. Groves PM, Linder JC, Young SJ. 5-hydroxydopaminelabeled dopaminergic axons:
three-dimensional reconstructions of axons, synapses and postsynaptic targets in rat neostriatum. Neuroscience. 1994; 58: 593–604.
57. Andreu N, Chale JJ, Senard JM, Thalamas G, Montastruc JM, Rascol O. L-Dopa-induced sedation a double-link cross-over controlled study versus trizolam and placebo in healthy volunteers. Clinical Neuropharmacol. 1999; 22: 15-23.
58. Nicholas AP. Levodopa-induced hyperactivity in mice treated with 1-methyl-4-phenyl-1,2,3,6-tetrahydroxypyridine. Mov. Disord. 2006; 22: 99–104.
59. Nicholas AP, Buck K, Ferger B. Effect of levodopa on striatal monoamines in mice with levodopa-induced hyperactivity. Neurosci. Lett. 2008; 443: 204–208.
60. Carta AR, Fenu S, Pala P, Tronci E, Morelli M. Selective modifications in GAD67 mRNA levels in striatonigral and striatopallidal pathways correlate to dopamine agonist priming in 6-hydroxydopamine-lesioned rats. Eur. J. Neurosci. 2003; 18: 2563–2572.
61. Meredith GE, Kang UJ. Behavioral models of Parkinson’s disease in rodents: a new look at an old problem. Mov Desord. 2006; 21: 1595-1606.
62. Tillerson JL, Caudle WM, Reveron ME, Miller GW. Detection of behavioral impairments correlated to neurochemical deficits in mice treated with moderate doses of 1-methyl-4-phenyl-1,2,3,6-tetrahydropyridine. Exp. Neurol. 2002; 178: 80-90.
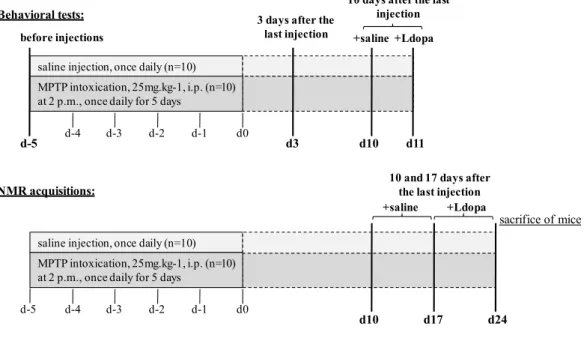
FIGURE 1. Experimental design.
All behavior tests were performed between 8.00 am and 1.00 pm, for both groups of animals (n=10 controls and n=10 MPTP-intoxicated mice). The first rotarod and pole tests were carried out the morning before the first saline or MPTP injection (d-5) and further tests were performed three days (d3) and ten days (d10) after the last injection. Animals were tested 60 minutes after the intraperitoneal administration of saline (0.2 ml) on d10 and 60 minutes after the administration of levodopa (200 mg.kg-1 in 0.2 ml saline) on d11.
NMR acquisitions were performed for both other groups of animals (n=10 controls and n=10 MPTP-intoxicated mice) and begun ten days following the last MPTP injection, on d10. Spectra were acquired after the i.p. administration of saline (d10). One week later (d17), each animal was assessed again after the i.p. administration of levodopa. Animals were killed humanely once all the NMR acquisitions had been acquired (d24), 60 minutes after the i.p. administration of saline (n=5 controls and n=5 MPTP-intoxicated mice) and 60 minutes after the i.p. administration of levodopa (200 mg.kg
-1 in 0.2 ml saline; n=5 controls and n=5 MPTP-intoxicated mice).
Behavioral tests:
saline injection, once daily (n=10) MPTP intoxication, 25mg.kg-1, i.p. (n=10) at 2 p.m., once daily for 5 days
d-4 d-3 d-2 d-1 d0
d-5 d3 d10 d11
before injections
3 days after the last injection
10 days after the last injection +saline +Ldopa
saline injection, once daily (n=10) MPTP intoxication, 25mg.kg-1, i.p. (n=10) at 2 p.m., once daily for 5 days
d-4 d-3 d-2 d-1 d0
d10 d17
NMR acquisitions:
d-5
d24
10 and 17 days after the last injection +saline +Ldopa
FIGURE 2. Effect of MPTP treatment on TH-immunoreactivity in SNc and VTA coronal sections.
A. Photomicrographs of representative posterior SNc and VTA sections stained with an antibody against TH. The tissues were collected 10 days after the last MPTP injection. The MPTP-intoxicated mice (5 × 25 mg.kg-1, once daily for 5 days, i.p.) have fewer TH-positive neurons than the controls.
Scale bar, 1 mm
B. MPTP administration led to a significant decrease (85%) in the mean number of TH-immunoreactive neurons in the SNc, as shown by comparison with control values. A decrease of 44% was observed in the VTA. Means ± SD of five mice per group are presented, ***p < 0.001 and *p < 0.05 versus controls, in a two-way ANOVA followed by a Dunnett post-hoc test.
Control MPTP-intoxicated mouse
SNc VTA
Control MPTP-intoxicated mouse
0 100 200 300 400 500 N u m b er o f p o sit iv e ce lls *** *** 0 50 100 150 N u m b er o f p o si ti v e cel ls * * Controls (n=5) Controls + Ldopa (n=5) MPTP-intoxicated mice (n=5)
MPTP-intoxicated mice + Ldopa (n=5)
A.
FIGURE 3. Time (s) spent on the rotarod for control mice (n=10) and MPTP-intoxicated mice (n=10).
Saline or MPTP was injected once daily for 5 days. Animals were tested on the rotarod before saline or MPTP injection (d-5), and 3 days (d3) and 10 days (d10) after the last saline or MPTP injection. On d11, they were also assessed after levodopa (200 mg.kg-1; i.p.) administration. In the testing session, animals underwent four successive trials and the data presented are the means for these four trials. Results are presented as means ± SD (for 10 animals in each group). Within each group (controls or MPTP-intoxicated mice), asterisks (**) indicate a significant difference (p<0.01) with respect to the values obtained for the other trial sessions. #p<0.05 versus the corresponding control mean in repeated measures ANOVA followed by a Newman-Keuls post-hoc test.
0 20 40 60 80 100 120 140 160 180 200
Controls (n=10) MPTP-intoxicated mice (n=10)
Ti m e o n r o d ( s)
**
**
#
#
d-5 d3 d10 d11+Ldopa d-5 d3 d10 d11+Ldopa
FIGURE 4. Effect of MPTP on the pole test performances.
Saline or MPTP was injected into the mice once daily for 5 days. The pole test was performed before saline or MPTP injection (d-5), 3 days (d3) and 10 days (d10) after the last saline or MPTP injection. On d11, the test was performed after levodopa (200 mg.kg-1; i.p.) administration. A mouse was placed head upwards close to the top of a rough-surfaced pole. The times required for the animal to turn completely (Tturn) and to reach the floor (TLA) were measured and are shown in A and in B,
respectively. In the testing session, animals underwent three successive trials and the data presented are those obtained in the third trial. Results are presented as means ± SD (for 10 animals in each group).
A. Tturn. In the control group, the mean obtained after levodopa administration on d11 was significantly
higher than the other values (*p<0.05). In the MPTP-treated group, there was a significant difference between d10 on the one hand and d-5 and d3 on the other (**p<0.01). ##p<0.01 versus the corresponding control mean in a repeated measures ANOVA followed by a Newman-Keuls post-hoc test.
B. TLA. Within the MPTP-treated group, there was a significant difference between the results obtained
on d10 and those obtained on d-5 and d3 (**p<0.01). There was also a significant difference between the results obtained on d10 and d11 (+Ldopa) (*p<0.05). ##p<0.01 versus the corresponding control mean in a repeated measures ANOVA followed by a Newman-Keuls post-hoc test.
6 8 10 12 14 16 18 d-5 d3 d10 d11+Ldopa TLA (s ) 0 2 4 6 8 10 12 d-5 d3 d10 d11+Ldopa Ttu rn (s) Controls (n=10) MPTP-intoxicated mice (n=10) ** * ** * ## #
A. B.
FIGURE 5. Coronal MR images of the mouse brain with the volumes of interest (VOIs) centered on the dorsal striatum (A) and NAc (B) and NMR spectra for the corresponding brain regions in a control and an MPTP-intoxicated mouse, after the administration of saline and levodopa.
The NMR images were acquired with a T2-weighted sequence, RARE (in-plane resolution 100 × 100
µm/pixel, slice thickness 1 mm, TE = 36 ms, TR = 4.5 s).
The NMR spectra were acquired with PRESS localization, with TE = 8.8ms, TR = 4000 ms, NS = 512 for acquisition in the dorsal striatum and NS = 1024 for acquisition in the NAc; acquisition times were 34 min and 68 min respectively. Spectra were line-broadened (5 Hz), and resonances were assigned as N-acetyl aspartate (NAA) at 2.008 ppm; γ-aminobutyric acid (GABA) at 2.27 ppm, glutamate (Glu) at 2.34 ppm, glutamine (Gln) at 2.42 ppm; total creatine (tCr) at 3.022 ppm and 3.98 ppm, total choline (tCho) at 3.22 ppm; taurine (Tau) at 3.24-3.42 ppm; myoinositol (Myo-Ins) at 3.48-3.52 ppm; Glu + Gln complex (Glx) at 3.75 ppm.
A. Spectra acquired for a VOI (2.0 × 2.0 × 2.0 mm) located on the dorsal part of the striatum, for a control mouse and an MPTP-intoxicated mouse, after the administration of saline and levodopa (200 mg.kg-1) injection.
B. Spectra acquired in a VOI (1.16 × 1.16 × 1.16 mm) located in the NAc, for a control mouse and an MPTP-intoxicated mouse, after the administration of saline and levodopa (200 mg.kg-1) injection.
4.5 4.0 3.5 3.0 2.5 2.0 1.5 1.0 0.5 ppm 4.5 4.0 3.5 3.0 2.5 2.0 1.5 1.0 0.5 ppm + saline + levodopa Lac NAA GA B A Glu Gln tCr tCho Tau Myo-Ins Glx tCr Lac NAA Glu Gln tCr tCho Myo-Ins Glx tCr Tau GAB A NAc VOI = 1.16 × 1.16 × 1.16 mm3 1.56µL Lac NAA GAB A Glu Gln tCr tCho Tau Myo-Ins Glx tCr VOI = 2 × 2 × 2 mm3 8.0µL STRIATUM Lac NAA GA B A Glu Gln tCr tCho Tau Myo-Ins Glx tCr + saline 4.5 4.0 3.5 3.0 2.5 2.0 1.5 1.0 0.5 ppm 4.5 4.0 3.5 3.0 2.5 2.0 1.5 1.0 0.5 ppm + levodopa
A.
B.
FIGURE 6. Absolute metabolite concentrations (mM) quantified in the dorsal striatum (A) and NAc (B) of controls and MPTP-intoxicated mice, determinated by in vivo 1H NMR after saline and levodopa administration (200 mg.kg-1).
Data are the means ± SD for 10 animals in the two controls groups and 10 animals in the two MPTP-intoxicated mouse groups. Statistically significant differences are indicated for comparisons between the metabolite concentrations of controls and MPTP-intoxicated mice after the administration of saline and levodopa (200 mg.kg-1), for repeated measures analysis of variance followed by a Dunnett post-hoc test. Significant differences were observed only in the dorsal part of the striatum and are indicated as: *p < 0.05; ***p < 0.001 controls + saline vs. MPTP-intoxicated mice + saline and #p < 0.05; ###p < 0.001 MPTP-intoxicated mice + saline vs. MPTP-intoxicated mice + levodopa.
0 5 10 15 20 25
tCho GABA Glu Gln Lac m-Ins NAA Tau tCr
C o nc e nt r a ti o n ( m M )
STRIATUM controls (n=10) controls + Ldopa ( n=10)
MPTP (n=10) MPTP + Ldopa (n=10) *** * * ### # # 0 2 4 6 8 10 12 14
tCho GABA Glu Gln Lac m-Ins NAA Tau tCr
C o nc e nt r a ti o n ( m M )
NAc controls (n=10) controls + Ldopa ( n=10)
MPTP (n=10) MPTP + Ldopa (n=10)
A.
FIGURE 7. Individual data measured in the dorsal striatum and the NAc in relation to DA denervation of the SNc (A) and the VTA (B), respectively.
Plotted are the GABA, Glu and Gln concentrations assessed by NMR spectroscopy in the dorsal striatum (A) and the NAc (B). Individual data points represent individual measures for the MPTP-intoxicated mice, which have been sacrified for TH immunohistochemical staining, after saline and levodopa administration (n=5). The percentages of DA denervation in the SNc and the VTA are indicated on the right.
Horizontal bars are the mean value for each group of subjects.
9 10 11 12 13 14 15 16 17 18 19 20 21 22 saline Ldopa 0 1 2 3 4 5 6 7 8 9 10 saline Ldopa 0 1 2 3 4 5 6 7 8 9 10 saline Ldopa 72% 90% 89% 90% 83% M eta bo lite s le v el s (mM ) in th e d o rs a l s tri a tu m Glu GABA Gln Denerva tion in SNc: 8 9 10 11 12 13
saline Ldopa saline Ldopa
saline Ldopa M eta bo lite s le v el s (mM ) in th e NAc Glu GABA Gln 0 0,5 1 1,5 2 2,5 3 3,5 0 0,5 1 1,5 2 2,5 3 3,5 23% 56% 51% 70% 32% Denerva tion in VTA:
A.
B.
FIGURE 8. Effect of MPTP intoxication on GAD67, Glu and GS labeling in the dorsal striatum and NAc.
A. Visualization of GAD67, Glu and GS immunolabeling in coronal slices of the dorsal part of the dorsal striatum and the NAc. The lines delimit the dorsal striatum and the area of the NAc in which immunoreactive cells were counted. Typical labeling for GAD67, Glu and GS is shown (arrows) in the insets (×20).
Scale bar, 1 mm.
B. Quantitative analysis of the effect of DA denervation and DA replacement on the same markers in the dorsal striatum and the NAc (n=5 animals from each of the 4 experimental groups). Data are expressed as the mean number of immunoreactive cells ± SD. Statistical comparisons were performed by two-way ANOVA, followed by Dunnett’s test. **p < 0.01 and ***p < 0.001 versus the control group.
GAD 67
Glu
GS
S
TRIATUMNA
C 1mm Controls (n=5) Controls + Ldopa (n=5) MPTP-intoxicated mice (n=5)MPTP-intoxicated mice + Ldopa (n=5) 0 5000 10000 15000 ** ** 0 1000 2000 3000 4000 N u m b er o f p o si ti v e cel ls *** *** 0 2000 4000 6000 8000 10000 ** ** 0 100 200 300 400 500 N u m b e r of p os it ive c e ll s 0 1000 2000 3000 4000 5000 0 500 1000 1500 2000 2500
D
ORSALS
TRIATUMNA
CA.
B.
1mmGAD67
GAD67 Glu GS
GAD67 Glu GS
× 20 × 20 × 20FIGURE 9. Individual data measured in the dorsal striatum and the NAc in relation to DA denervation of the SNc (A) and the VTA (B), respectively.
Plotted are the immunoreactive cells counted in the dorsal striatum and the NAc. Individual data points represent individual measures for the MPTP-intoxicated mice, which have been sacrified for TH immunohistochemical staining, after saline and levodopa administration (n=5). The percentages of DA denervation in the SNc and the VTA are indicated on the right.
Horizontal bars are the mean value for each group of subjects. 1500 2000 2500 3000 3500 4000
saline Ldopa saline Ldopa saline Ldopa
Glu GAD67 GS 5000 7000 9000 11000 13000 15000 17000 19000 5000 6000 7000 8000 9000 10000 Im mu n o re ac tiv e ce lls in th e d o rs a l s tri a tu m 72% 90% 89% 90% 83% Denerva tion in SNc: 50 100 150 200 250 300 350 400 450 500 550 600
saline Ldopa saline Ldopa saline Ldopa
1500 2000 2500 3000 3500 4000 4500 1000 1500 2000 2500 3000 Im munor ea ct iv e ce ll s in t h e NA c 23% 56% 51% 70% 32% Denerva tion in VTA: