HAL Id: hal-02926097
https://hal.archives-ouvertes.fr/hal-02926097
Submitted on 27 Nov 2020
HAL is a multi-disciplinary open access archive for the deposit and dissemination of sci-entific research documents, whether they are pub-lished or not. The documents may come from teaching and research institutions in France or
L’archive ouverte pluridisciplinaire HAL, est destinée au dépôt et à la diffusion de documents scientifiques de niveau recherche, publiés ou non, émanant des établissements d’enseignement et de recherche français ou étrangers, des laboratoires
In situ 4D mechanical testing of structural materials:
The data challenge
Henry Proudhon, Maxime Pelerin, Andrew King, Wolfgang Ludwig
To cite this version:
Henry Proudhon, Maxime Pelerin, Andrew King, Wolfgang Ludwig. In situ 4D mechanical testing of structural materials: The data challenge. Current Opinion in Solid State and Materials Science, Elsevier, 2020, pp.100834. �10.1016/j.cossms.2020.100834�. �hal-02926097�
In situ 4D mechanical testing of structural materials:
the data challenge
Henry Proudhona,∗, Maxime Pelerina,b, Andrew Kingb, Wolfgang Ludwigc,d
aMINES ParisTech, PSL University, MAT – Centre des mat´eriaux, CNRS UMR 7633, BP 87 91003 Evry, France
bSynchrotron SOLEIL, L’Orme des Merisiers, BP 48, 91192 Gif-sur-Yvette, France cESRF, The European Synchrotron, CS 40220, 38043 Grenoble, France dINSA Lyon, MATEIS, University of Lyon, UMR 5510 CNRS, F-69621 Lyon, France
Abstract
This papers presents recent progress with materials investigations via in situ mechanical testing at the synchrotron, so called 4D experiments. More auto-mated and more integrated stress rigs now allow to produce new kind of data sets to study deformation and fracture of structural materials. Two recent examples are presented, one with a polymer material and another one with a polycrystalline metallic alloy. Challenges with data organisation and storage and automatic analysis are discussed in the view of the upgrade of the main synchrotron sources which will greatly increase the number and size of the future data sets.
Keywords: X-ray tomography, X-ray diffraction, 4D experiments,
mechanical testing, microstructure, material deformation, data management
1. Introduction
The mechanical properties of structural materials are intimately linked to their internal microstructure and from that perspective determining microstructure-property relationships is directly linked to our ability to observe both the microstructure and the deformation/failure mechanisms concurrently. With the advent of 3rdgeneration synchrotrons, X-ray computed tomography (CT)
has become routine to study many kind of materials at the micron scale. The
∗Corresponding author
non-destructive nature of this type of observation, except for biological ma-terial that are very sensitive to radiation, allows mama-terial inspection directly under mechanical testing. In situ 3D imaging has been used in many cases to improve our understanding of damage and failure mechanisms in many kinds of structural materials [1–6]. With synchrotron tomography techniques ma-turing, measurements that previously required tens of minutes are now rou-tinely performed in tens of seconds, and in many cases, in much less than 1 s [7].
Although CT imaging relies on absorption and phase contrasts and re-mains blind to crystal orientation, accessing crystallographic information in the bulk of polycrystalline specimens was subsequently achieved by using the high penetration power of hard X-rays and leveraging diffraction contrast. After pioneering work by Poulsen [8] with 3DXRD, variants of the technique emerge with the particular cases of Near Field High Energy Diffraction Mi-croscopy (NF-HEDM) [9, 10] and Diffraction Contrast Tomography (DCT) which resolve the grain shapes by near-field imaging [11, 12]. The concept has also been extended to polychromatic beam and is therefore available with laboratory setups [13, 14].
With digital representation of the microstructure (phases, grains or par-ticles for instances) in 3D, another key challenge is to link 3D microstructure characterisation tools with computational models in order to predict engi-neering properties such as strength, fatigue resistance or fracture toughness [15]. This is a vivid field of research where both synthetically generated [16, 17] and experimental 3D images may be used [18, 19]. One advantage of the latter route is to directly compare experiment and mechanical simula-tion at the scale of the microstructure. Regarding computasimula-tional methods, two main approaches exist to solve the mechanical equilibrium. The spectral method [20] uses FFT and works directly on the 3D image and is particularly suited to predict homogenized properties of materials. The second route uses finite elements which, not being restricted to uniform grids, is much more tunable regarding the geometrical features to be modeled.
With experimentally driven simulation of the material response, a new approach where experimental data can be supplemented by simulated data arise [21]. This may be used to identify or validate material models against the experimental observation of deformation and failure [22]. The large in-crease of the generated data sets pushes to change the data analysis strategy. While done mostly manually on selected examples in the past, it has to be more and more automatic and statistically representative in the future. A
better data organisation should allow to use the rising machine learning tools that are now widely available to mine the data sets for correlations with the microstructure. Recent examples show that this type of analysis is indeed relevant [23].
The progress in 3D material science does not reduce to microstructure characterization. If lattice strains have long been measured (and still are) in whole grain families using X-ray diffraction [24], the pursuit of local strains have seen a number of recent developments. The first level of refinement comes from 3DXRD or far-field HEDM that allow to retrieve the average elastic strain tensor of each grain during 4D experiments [25, 26]. The sec-ond level is to reach truly intragranular strain. This is particularly crucial regarding the understanding of local deformation and fracture mechanisms as mean values may not the right variables to look at. Point scanning tech-niques using a focused X-ray beam such as DAXM [27] have been the most capable technique to perform elastic strains mapping [28] but remain limited to small volume close to the specimen surface. More recently, the scanning 3DXRD modality, first introduced by Hayashi [29], allowed to characterize local strains at sub-micrometre length scales [30, 31]. The method was fur-ther refined by Hektor et al. [32] using forward simulation to improve its sensitivity. By using rapid lateral translations and vertical rotation of the specimen, this method can achieve greater volumes than DAXM with spatial resolution down to 200 nm in a few hours, a time that could be dramatically reduced in the near future with 4th generation synchrotron sources.
In this paper, recent development regarding in situ 4D mechanical testing at the synchrotron are reviewed and a new data organisation strategy is proposed. Two examples are further discussed to show the potential of more automated and integrated 4D material testing.
2. In situ 4D mechanical testing at the synchrotron 2.1. Presentation of two different stress rigs
Over the last few years, several mechanical loading stages have been de-veloped at Mines ParisTech, as in other institutes investing efforts in 4D investigations [10, 33–35]. The last decade has also seen a larger availability of stress rigs at the beamline [36]. This usually comes with a better integra-tion of the machine at the beamline but not having it tailored to a particular material or loading case. So at present it is not clear which route is the best, and the answer certainly depends on the beamline. The two stress rigs,
1 cm
(a) Nanox
5 cm
(b) Bulky
Figure 1: Examples of mechanical stress rigs to carry out 4D experiments [37, 38].
Nanox and Bulky, used in the examples presented hereafter (see sections 3 and 4) are briefly shown here, more details can been found in dedicated papers [37, 38].
While Nanox is a specialized rig dedicated to near-field X-ray diffraction imaging experiments like X-ray diffraction contrast tomography (DCT) and Topotomography [39] (see section 4 for more details on this technique), Bulky is a rather versatile rig more suited to regular X-ray tomography and which can accommodate many sample geometries and different load frames (tension, compression, low cycle fatigue). For their main use (ID11 for Nanox and Psich´e for Bulky), all wire connections go through slip rings to prevent any motion artifacts during the rotation. Both stress rigs are currently being upgraded for high temperature testing.
Weighting only 400 grams and with a working distance of 60 mm from its base, Nanox fits within the high resolution 4 circle gonionmeter of ID11 at ESRF. This allows to carry out a DCT characterization followed by topoto-mography observations of selected grains of interest. This is now done with-out any manual intervention and rather automatically using a set of matlab scripts generating the required commands to align the different grains and load the specimen up to 600 N by the piezoelectric actuator (see section 4 for an example).
On the other hand Bulky is a 5 kN rig primarily used for X-ray tomog-raphy under continuous loading. The high torque stepper motor moves a crosshead with an adjustable speed ranging from 50 nm/s to 0.5 mm/s. The
load frame part is removable which allows to change load configuration within minutes.
2.2. Data management
After reviewing various options to handle 4D data sets, a consensus has emerged with the following aspects:
• A single file per sample;
• the file should be self descriptive using metadata;
• the file may contain several imaging modalities, possibly at different resolutions;
• a chunk data layout using block compression should be used to maxi-mize access time to any portion of the 4D data set;
• lossy compression may be used but with a controlled error to carry out data reduction [40].
HDF5 format [41] has been chosen, as it allows all these aspects, it is very well supported by several programming languages and is also used by related attempts such as the DREAM3D file format [42] and the Nexus format [43]. Originally developed by the National Center for Supercomputing Applica-tions in the US, HDF5 is an open format supported by the HDF Group, a non profit organization dedicated to maintain this specification.
Noting that different types of data analysis do not require the same spatial resolution nor data precision, it is also useful and not very expensive to store lower resolution versions of the data in the same fashion than image thumbnails to be displayed rapidly.
To further reduce the disk space footprint, unnecessary data (for instance voxels outside the specimens) are filled with a constant value (eg 0) which is efficiently reduced by the compression algorithms. A mask of the sample is stored as well.
The structure adopted follows this global vision. As an example we present here how this works on a complete in situ tension test (see section 3 for analysis of the results). The raw data set is comprised by 44 volumes of size 2048x2048x1024 encoded in 32 bits float numbers; this corresponds to 16 Gb per volume and more than 700 Gb for this single test.
• registration on the reference state, crop to remove air regions outside the sample;
• application of a mask to remove voxels outside the sample (gain in compressed file size)
• truncation of the floating representation to 2−4 which produced a mean
error of 2−6=0.015 which is much smaller than the noise level;
• data storage using chunks and global compression (Zstandard level 1 [44], with bit shuffling which increase performances with binary floating-point representation);
• reduced volumes using (binning, dynamic) = (2x2, 4 bits) and (4x4, 8 bits) denoted as level 1 and 2 respectively.
This complete data [45] set has a disk footprint of only 47 Gb and has been made available on Zenodo [46]. The gain is 93% with an apparent compression ratio of 15 to 1. All the data is stored into a single HDF5 file with the following structure:
> root node
> |---> tomography data group > |
> | |---> reconstruction metadata table > | |---> load increment group
> | | |---> increment 1
> | | | |---> reference volume > | | | |---> mask
> | | | |---> reduce volume level 1 > | | | |---> reduce volume level 2 > | | |
> | | [43 other load increment groups] > |
> | |---> initial static tomography
> | | [same hierarchy as for a load increment] > |
> | |---> final static tomography (2 fracture surfaces) > | | [same hierarchy as for a load increment]
> |---> time signals group > | |---> meta data table
> | |---> time signals (time, load, displacement) > |
> |---> other data modalities groups
Using this approach, the data analysis becomes much more computation-ally efficient, and sometimes just doable. It is demonstrated in section 3 with particle tracking in each tomographic volume made possible by using the reduced volume to locate the particles and then loading them at full resolution advantageously thanks to the chunk representation of the data. The compression also greatly lowers the size of the data to be read from the disk which also improves the performance. A balance has to be found here as decompression of the data has a cost but appeared in our tests with Zstandard to perform approximately at the same throughput as the reading speed which is the best compromise. A Dell T7910 workstation with a dual Intel Xeon E5-2640 CPU and 64 Gb RAM was used.
Note that for this approach to develop its full potential, it is necessary to carry out this containerisation/reduction as early as possible in the data processing workflow. Many beamlines are currently working on the imple-mentation of this type of strategy in order to integrate this kind of approaches as early as possible in the data acquisition process [47, 48].
A side effect of packaging the data into a single self-descripting file is that it is much easier to share on the emerging scientific data platforms like Zenodo [49] following the OpenAire European initiative. This is probably one of the most important aspect our community should now work on, as these data are very expensive, complicated to obtained and should be shared as widely as possible.
3. Mechanical behaviour of a polymer material studied by 4D in situ testing
3.1. In situ tensile test
The sample used in this experiment is from a series machined in a 2-mm-thick injected-molded plate of polymer material. A flat specimen geometry with pin mounting and a notch radius of 1 mm in the middle of the gauge length has been used (see top of Fig. 2 for a schematics).
The measurements were made on the PSICHE beamline of the SOLEIL synchrotron using a pink beam with its maximum of intensity at 25 keV. A classical setup comprising a scintillator coupled to a x5 eye piece and a CMOS Hamamatsu camera, gave us an effective pixel size of 1.3 µm for a field of view 2.6 mm wide by 1.3 mm in height [50]. In-line phase contrast and Paganin filtering of the radiographs [51] were used to enhance image contrast by placing the camera 65 mm downstream from the sample.
A continuous tensile test was carried out using a displacement speed of 0.4 µm/s and online height correction to keep the notched region within the field of view. For tomography acquisitions, the machine was set to rotate continuously while tomography data sets were acquired in 6 seconds. Each tomogram is composed by a thousand radiographs equally distributed over a half turn (only half of the detector height was used to speed up the data collection).
A Python script, running in a beamline control terminal, automatically executes the progress of a mechanical test, coordinating all motor movements, acquiring the relevant signals, managing the tomography acquisitions and stopping when the sample breaks. The data acquisition strategy can be different depending on the application: equispaced tomograms in time or load levels, or user controlled as here. This allows direct control of the tomography frequency (up to 1 every 6 seconds) and in our case to record more data sets close the nucleation and growth of voids in the specimen (after the maximum load has been reached). Just like the test presented here, mechanical tensile tests typically lasted 20 minutes with 50 tomograms recorded during the course of the test. Tomographic reconstruction was carried out using the PyHST software [52] and further processed to create the data structure presented earlier (see section 2.2).
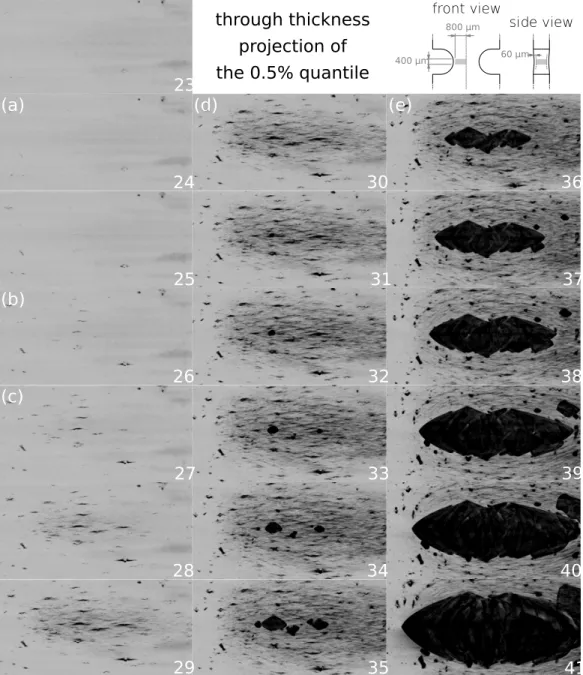
The 3D analysis of the reconstructed volumes makes it possible to visual-ize and quantify the damage mechanisms: nucleation, growth and coalescence of voids for this notch radius of 1 mm (see Fig. 2). The location of the nu-cleation of the first cavities can readily be detected (it occurs at a certain distance from the notch root and is therefore not available from surface ob-servation) and the data can be further processed by computing local void volume fraction. This can be used for direct comparison with Finite Element simulations of the material response as done previously on different materials [53].
23 24 25 26 27 28 29 35 33 34 40 41 39 38 32 31 37 36 30 800 µm 400 µm 60 µm (a) (b) (c) (d) (e) front view side view through thickness projection of the 0.5% quantile
Figure 2: Projections through registered volume showing the nucleation ond growth of damage during the tensile test (refer to Fig. 3a for loading curve).
3.2. Particle tracking
First results of the in situ tensile test showed that the main degradation mechanism is due to void growth and coalescence from initial defects and in particular rigid particles embedded within the matrix. With this geometry and detector size, the limit of the notch is not visible in the reconstructed data, but small particles embedded in the matrix can be used as virtual extensometers [54–56].
Using the digital representation presented earlier (see section 2.2), all the data is accessible through compressed chunks with an appreciable efficiency. Hence, a simple particle tracking algorithm can be written:
• By thresholding the first reconstructed volume, the initial position of the particles are determined;
• For each particle and for each deformed volume, the updated position is estimated using an approximation of the local deformation;
• The particle in the vicinity of this position in the deformed volume is read at full resolution from the corresponding volume (a very fast operation thanks to the chunk layout of the data);
• A series of sanity checks are carried out to filter out wrongly detected particles.
Once a particle is found, its precise position is determined by a weighted average of the intensities. Here it is important to have kept a large dynamical range with a controlled error in contrast to the usual truncation and rescaling of the entire histogram onto integer values. Thanks to the data structure, this method only needs about a hundred Mb of RAM compared to the total 700 Gb of data manipulated. About 200 particles could be followed during the entire tensile test and the evolution of their position is used as virtual extensometer as plotted in Fig. 3.
In general, these results demonstrate the importance of this technique to asses the deformation mechanisms of structural materials. The first conclu-sion is that cavities start from the small embedded particles in the matrix which is a well known fact available from fracture surfaces. Here, the precise particles that led to cavities growth and coalescence are known (and can be also related to fracture surface observations after the test). It appears that the proximity of 3 particles almost aligned in a plane in the critical zone
Loading displacement (mm) Load (N) virtual extensometer (mm) V ertical p osition (mm) (a) (b)
Figure 3: Fully automated in situ tensile test with Bulky (a) loading curve recorded during the test (b) particle tracking to serve as a virtual extensometer.
where damage develops, triggered coalescence and failure. In this case this superseded the particle size parameter usually invoked and highlights the importance of the spatial distribution of such particles, as in another test (not reported here), no such alignment was observed and the largest particle led to cavity growth and failure.
4. Incipient plasticity studied by X-ray DCT and Topotomography 4.1. Combined DCT and Topotomograph in situ experiment
Today, the adoption of new alloys in the industry is still limited by our ability to model their microstructure-properties relationships. A critical question is the collective process behind crystal plasticity (the same holds true for twinning or phase transformation induced plasticity) which, if it is rather well understood theoretically, the detail of the onset of plasticity, the location of plastic localization and the transmission from one grain to the next are far from being completely understood. The few grain to grain comparisons show that models fail to predict local behaviour precisely [57]. This mechanical response of polycrystalline materials is controlled by their three-dimensional grain microstructure. Elastic anisotropy and crystal plas-ticity of the individual grains in metallic alloys lead to very heterogeneous distributions of strains and stresses which directly control their deformation and fracture behaviour.
To study the local mechanical behaviour both from a collective point of view and at the grain level in the bulk of the material, experiments combining
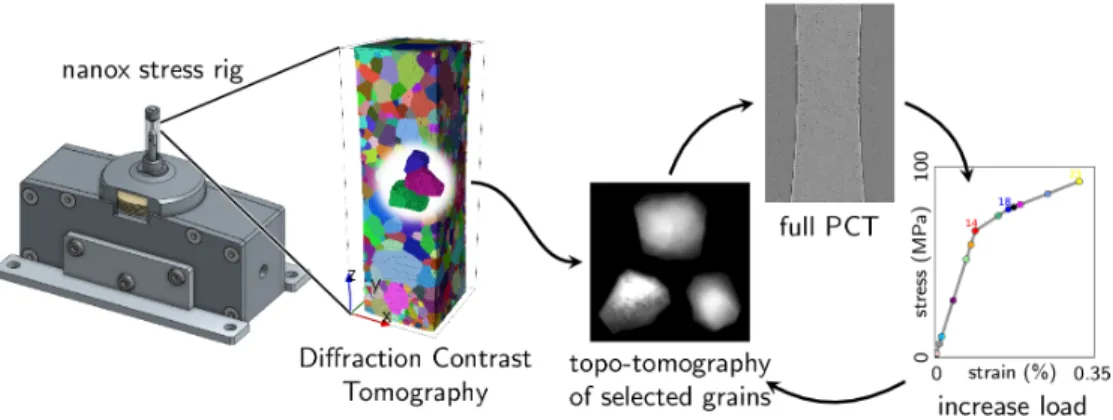
Diffraction Contrast Tomography (DCT) [11, 58] and Topo-tomography [39] have been performed [59]. Miniature tensile samples for the Nanox tensile rig have been prepared from a plate of recrystallized AlLi 2.5 wt% alloy with a grain size of approximately 100 µm. A sample, virgin from any deformation, was mounted into Nanox and a DCT scan (3600 images with 0.1 degree integration) with a detector pixel size of 1.4 µm was acquired. The DCT indexing output was then used to perform a series of topotomography scans on a cluster of 3 neighboring grains embedded in the bulk.
A second detector system with an effective pixel size of 0.7 µm was used for topotomographic scan acquisition. The angular range of the rocking curve scans was automatically adjusted after each load increment in order to cover the entire width of the crystal reflection curve for any ω rotation position of the sample. For each value of ω, a continuous motion acquisition procedure with a fixed integration range of 0.1◦ and 0.5 s exposure time per image was used. This procedure was repeated every 4◦ and a complete topotomographic acquisition comprising 90 such rocking scans per grain typically lasted from 10 minutes up to an hour as the Θ integration range increased during loading. From the beginning to the end of the experiment, the integration range has been multiplied by a factor of 10 (from 0.05◦ to 0.5◦). Incremental loading was applied after each series of TT scans to reach 0.34% total strain in 23 steps and covering the elastoplastic transition.
The complete experimental procedure is summarized in Fig. 4 and fully automated from the DCT output information by a set of Matlab scripts generating the different alignment commands (see [59] for more details). It is important to note that automation is key for such an experiment to be successful. The experimental DCT data is available online [60].
4.2. Results
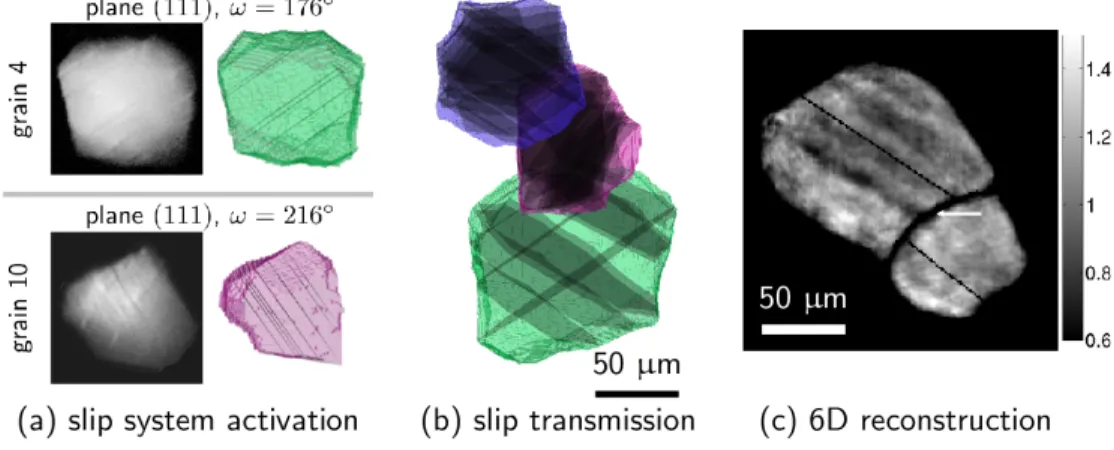
Visual inspection of integrated topographs show the appearance of thin bands as deformation proceeds (see Fig. 5a). These sets of bands have all been correlated to active slip planes in each grain (using the crystal orienta-tion and tilt geometry for each grain). They are parallel, most of the time they extend through the whole grain and their number increases as the de-formation increases. Going through the whole projection set for each grain shows that 2 sets of bands are visible at different ω values. These bands appear well separated (∼ 10 µm) in the topographs which is wider than in typical TEM observations. It is possible that several bands (not resolved at
Figure 4: Summary of the in-situ topotomography experiment: the initial microstructure is characterized by DCT and analyzed to monitor the topotomography experiments on three grain cluster embedded in the bulk.
this resolution) contribute to the diffraction signal to form the band contrast observed on the detector.
Further analysis of the active slip systems was carried out both using Schmid factor and a full field Finite Element simulation on the digital clone of the specimen (see [59] for more details). For grain 4 and 18, the two observed slip planes correspond to the two highest Schmid factors whereas for grain 10, they correspond to the first and third highest Schmid factors. The slip system corresponding to the second highest Schmid is not observed to be active in this grain. The reason for this discrepancy could be attributed to neighboring effects. Indeed the activation of the third highest Schmid factor slip system could be due to favorable slip transmission from the grain neighbor.
Unfortunately, after putting together all the detected slip localization events (see Fig. 5b), no evidence can be found regarding the slip transmis-sion through the two grain boundaries that are available from the topo-tomography scans. As each bulk grain has on average 12 neighbors, no strong conclusion can be further drawn apart that larger connected grain clusters should be measured in the future. Note that by processing further the initial DCT output, a smart selection of grains can be imagined based on the two highest Schmid factors slip systems.
In addition to the qualitative analysis of slip localization, it was shown re-cently that complete orientation field reconstructions are possible (see Fig. 5c
Figure 5: Summary of the typical results of a combined DCT+TT 4D experiment. (a) Integrated topograph showing the appearance of bands of contrast correlated to active slip planes. (b) Slip transmission can be studied by putting all the observation together in the reference state. (c) Band contrast can also be reconstructed quantitatively using the 6D reconstruction framework (relative misorientation shown here in degrees).
for an example using DCT data [61]) using the 6D reconstruction framework [62]. The orientation map shows band-like structures that are aligned with the active slip plane, with typical misorientation around 0.5◦ (this particular reconstruction is from a different data set). It is also possible to combine at the same time DCT and several TT reflections (after a careful alignment of the data sets) to push the spatial and angular resolution of the reconstruction (see dedicated paper by Vigano et al. in this issue of the journal). Further work and cross validation with other methods are needed to confirm these promising results.
Finally, the post-processing of the CPFEM results showed that the exper-imental 3D rocking curves can be very accurately simulated using the elastic tensor (bearing both the rotation and the distortion of the crystal lattice) in each element. This is true provided the right combination of slip system can be predicted (i.e. in 2 of the 3 studied grains).
The experimental setup described in this section enables bulk observa-tions of the formation of individual slip bands in a complete polycrystalline microstructure. However to move forward, the mapping of larger grain neigh-borhoods will be required. With the increase in X-ray flux due to the EBS upgrade of the ESRF, it can be anticipated that much more complete 4D
time-lapse studies will soon become possible and will enable to study bulk deformation mechanisms under various external loading. Again this will re-sult in really massive data sets (think of hundreds of grains scanned many times during loading) which cannot been analyzed manually, as it is the case today. In this regard, the new data management strategy presented earlier (see section 2.2) is needed to move beyond the state of the art.
Another promising route lies in the one to one comparison with crystal plasticity simulations of the material response. Though classical continuum finite element models fail to predict detailed localization events, this can be achieved by recent advances in CP-FFT [63] or using coupled Discrete-Continuum approaches [64].
5. Outlook
More and more automated and integrated 4D mechanical testing at the synchrotron is about to produce unmatched quantity of important data sets to study deformation, damage and fracture of structural materials. With the increased brilliance of diffraction limited storage rings that are being powered up, a new data paradigm needs to be adopted. The convergence of experimental and simulated data through the digital twin approach has also a great potential [21] as missing data can be filled in using state of the art modelling tools. These data sets are to be shared, and for this our community need to agree on an open standard. At the very least, a self-descriptive hierarchical structure should be used, but this would considerable undermine the usefulness of the data itself. Sharing our data would not only promote open science (today without access to the data, it is almost impossible to reproduce scientific results in a paper), it would also recognize the value in the data itself as these data sets are very often, expensive and difficult to obtain. In the near future, rising machine learning tools can be used to automate data reduction and analysis to correlation of material degradation with microstructural features.
6. Acknowledgments
The authors would like to thank ESRF for beam time allocation ma2285 and Soleil for beam time allocation 20170058. HP and MP thank L. Laiari-nandrasana for helpful discussion on damage mechanisms in polymer mate-rials.
References
[1] J.-Y. Buffi`ere, H. Proudhon, E. Ferri´e, W. Ludwig, E. Maire, P. Cloetens, Three dimensional imaging of damage in structural materials using high resolution micro-tomography, Nuclear Instru-ments and Methods in Physics Research Section B: Beam Interac-tions with Materials and Atoms 238 (1-4) (2005) 75–82 (Aug. 2005). doi:10.1016/j.nimb.2005.06.021.
[2] A. Scott, M. Mavrogordato, P. Wright, I. Sinclair, S. Spearing, In situ fibre fracture measurement in carbon-epoxy laminates using high resolu-tion computed tomography, Composites Science and Technology 71 (12) (2011) 1471–1477 (2011). doi:10.1016/j.compscitech.2011.06.004. [3] P. J. Withers, M. Preuss, Fatigue and damage in structural
mate-rials studied by X-ray tomography, Annual Review of Matemate-rials Re-search 42 (1) (2012) 81–103 (2012). doi:10.1146/annurev-matsci-070511-155111.
[4] T. F. Morgeneyer, T. Taillandier-Thomas, L. Helfen, T. Baumbach, I. Sinclair, S. Roux, F. Hild, In situ 3-d observation of early strain localization during failure of thin al alloy (2198) sheet, Acta Materialia 69 (2014) 78–91 (2014). doi:10.1016/j.actamat.2014.01.033.
[5] K. Chatterjee, A. Venkataraman, T. Garbaciak, J. Rotella, M. Sangid, A. Beaudoin, P. Kenesei, J.-S. Park, A. Pilchak, Study of grain-level deformation and residual stresses in ti-7al under combined bending and tension using high energy diffraction microscopy (hedm), Inter-national Journal of Solids and Structures 94-95 (2016) 35–49 (2016). doi:j.ijsolstr.2016.05.010.
[6] Y. Madi, J.-M. Garcia, H. Proudhon, Y. Shinohara, L. Helfen, J. Besson, T. F. Morgeneyer, On the origin of the anisotropic damage of X100 line pipe steel – part i: In-situ synchrotron tomography experiments, Integrating Materials and Manufacturing Innovation 8 (4) (2019) 570– 596 (2019). doi:10.1007/s40192-019-00165-0.
[7] E. Maire, C. Le Bourlot, J. Adrien, A. Mortensen, R. Mokso, 20 hz x-ray tomography during an in situ tensile test, International Journal of Fracture 200 (2016) 3–12 (2016). doi:10.1007/s10704-016-0077-y.
[8] H. F. Poulsen, Three-Dimensional X-ray Diffraction Microscopy – Map-ping Polycrystals and Their Dynamics, Vol. 205 of Springer Tracts in Modern Physics, Springer, Berlin, 2004 (2004).
[9] U. Lienert, S. F. Li, C. M. Hefferan, J. Lind, R. M. Suter, J. V. Bernier, N. R. Barton, M. C. Brandes, M. J. Mills, M. P. Miller, B. Jakob-sen, W. Pantleon, High-energy diffraction microscopy at the advanced photon source, JOM 63 (7) (2011) 70–77 (2011). doi:10.1007/s11837-011-0116-0.
[10] J. C. Schuren, P. A. Shade, J. V. Bernier, S. F. Li, B. Blank, J. Lind, P. Kenesei, U. Lienert, R. M. Suter, T. J. Turner, D. M. Dimiduk, J. Almer, New opportunities for quantitative tracking of polycrystal responses in three dimensions, Current Opinion in Solid State and Materials Science 19 (4) (2015) 235–244 (2015). doi:10.1016/j.cossms.2014.11.003.
[11] P. Reischig, A. King, L. Nervo, N. Vigan´o, Y. Guilhem, W. J. Palenstijn, K. J. Batenburg, M. Preuss, W. Ludwig, Advances in X-ray diffrac-tion contrast tomography: flexibility in the setup geometry and applica-tion to multiphase materials, Journal of Applied Crystallography 46 (2) (2013) 297–311 (Apr 2013). doi:10.1107/S0021889813002604.
[12] W. Ludwig, P. Cloetens, J. H¨artwig, J. Baruchel, B. Hamelin, P. Bastie, Three-dimensional imaging of crystal defects by topo-tomography, JAC 34 (5) (2001) 602–607 (Oct 2001). doi:10.1107/S002188980101086X. [13] A. King, P. Reischig, J. Adrien, S. Peetermans, W. Ludwig,
Polychro-matic diffraction contrast tomography, Materials Characterization 97 (2014) 1–10 (2014). doi:10.1016/j.matchar.2014.07.026.
[14] F. Bachmann, H. Bale, N. Gueninchault, C. Holzner, E. M. Lauridsen, 3D grain reconstruction from laboratory diffraction contrast tomogra-phy, Journal of Applied Crystallography 52 (3) (2019) 643–651 (Jun 2019). doi:10.1107/S1600576719005442.
[15] E. Maire, T. Morgeneyer, C. Landron, J. Adrien, L. Helfen, Bulk eval-uation of ductile damage development using high resolution tomogra-phy and laminogratomogra-phy, Comptes Rendus Physique 13 (3) (2012) 328– 336, use of large scale facilities for research in metallurgy /
Utilisa-tion des grands instruments pour la recherche en m´etallurgie (2012). doi:10.1016/j.crhy.2011.12.009.
[16] M. P. Miller, P. R. Dawson, Understanding local deformation in metallic polycrystals using high energy X-rays and finite elements, Current Opin-ion in Solid State and Materials Science 18 (5) (2014) 286–299 (2014). doi:10.1016/j.cossms.2014.09.001.
[17] M. Pinz, G. Weber, W. Lenthe, M. Uchic, T. Pollock, S. Ghosh, Mi-crostructure and property based statistically equivalent RVEs for intra-granular γ-γ0 microstructures of Ni-based superalloys, Acta Materialia 157 (2018) 245–258 (2018). doi:10.1016/j.actamat.2018.07.034.
[18] H. Proudhon, J. Li, P. Reischig, N. Gu´eninchault, S. Forest, W. Lud-wig, Coupling diffraction contrast tomography with the finite element method, Advanced Engineering Materials 18 (6) (2016) 903–912 (2016). doi:10.1002/adem.201500414.
[19] A. D. Spear, J. D. Hochhalter, A. R. Cerrone, S. F. Li, J. F. Lind, R. M. Suter, A. R. Ingraffea, A method to generate conformal finite-element meshes from 3D measurements of microstructurally small fatigue-crack propagation, Fatigue & Fracture of Engineering Materials & Structures 39 (6) (2016) 737–751 (2016). doi:10.1111/ffe.12449.
[20] H. Moulinec, P. Suquet, A numerical method for computing the overall response of nonlinear composites with complex microstructure, Com-puter methods in applied mechanics and engineering 157 (1) (1998) 69– 94 (1998). doi:10.1016/S0045-7825(97)00218-1.
[21] A. D. Spear, S. R. Kalidindi, B. Meredig, A. Kontsos, J.-B. le Graverend, Data-driven materials investigations: The next frontier in understand-ing and predictunderstand-ing fatigue behavior, JOM 70 (7) (2018) 1143–1146 (Jul 2018). doi:10.1007/s11837-018-2894-0.
[22] A. J. Beaudoin, M. Obstalecki, R. Storer, W. Tayon, J. Mach, P. Kene-sei, U. Lienert, Validation of a crystal plasticity model using high energy diffraction microscopy, Modelling and Simulation in Materials Science and Engineering 20 (2) (2012) 024006 (feb 2012). doi:10.1088/0965-0393/20/2/024006.
[23] A. Rovinelli, M. Sangid, H. Proudhon, W. Ludwig, Using machine learn-ing and a data-driven approach to identify the small fatigue crack driv-ing force in polycrystalline materials, Nature Computational Materials 4 (35) (2018). doi:10.1038/s41524-018-0094-7.
[24] B. E. Warren, X-Ray Diffraction, Dover Publication, Inc., New York, 1969 (1969).
[25] J. Oddershede, S. Schmidt, H. F. Poulsen, H. O. Sørensen, J. Wright, W. Reimers, Determining grain resolved stresses in poly-crystalline materials using three-dimensional X-ray diffraction, Jour-nal of Applied Crystallography 43 (3) (2010) 539–549 (Jun 2010). doi:10.1107/S0021889810012963.
[26] H. Abdolvand, J. P. Wright, A. J. Wilkinson, On the state of defor-mation in a polycrystalline material in three-dimension: Elastic strains, lattice rotations, and deformation mechanisms, International Journal of Plasticity 106 (2018) 145–163 (2018). doi:10.1016/j.ijplas.2018.03.006. [27] B. C. Larson, W. Yang, G. E. Ice, J. D. Budai, J. Z. Tischler,
Three-dimensional x-ray structural microscopy with submicrometre resolution, Nature 415 (2002). doi:10.1038/415887a.
[28] O. Robach, J.-S. Micha, O. Ulrich, P. Gergaud, Full local elastic strain tensor from Laue microdiffraction: simultaneous Laue pattern and spot energy measurement, Journal of Applied Crystallography 44 (4) (2011) 688–696 (Aug 2011). doi:10.1107/S002188981102320X.
[29] Y. Hayashi, Y. Hirose, Y. Seno, Polycrystal orientation mapping us-ing scannus-ing three-dimensional X-ray diffraction microscopy, Jour-nal of Applied Crystallography 48 (4) (2015) 1094–1101 (Aug 2015). doi:10.1107/S1600576715009899.
[30] J. Hektor, S. Hall, N. Henningsson, J. Engqvist, M. Ristinmaa, F. Lenrick, J. Wright, Scanning 3DXRD measurement of grain growth, stress, and formation of Cu6Sn5 around a tin whisker during heat
treat-ment, Materials 12 (2019) 446 (2019). doi:10.3390/ma12030446.
[31] Y. Hayashi, D. Setoyama, Y. Hirose, T. Yoshida, H. Kimura, In-tragranular three-dimensional stress tensor fields in plastically
de-formed polycrystals, Science 366 (6472) (2019) 1492–1496 (2019). doi:10.1126/science.aax9167.
[32] N. A. Henningsson, S. A. Hall, J. P. Wright, J. Hektor, Reconstruct-ing intragranular strain fields in polycrystalline materials from scannReconstruct-ing 3DXRD data, Journal of Applied Crystallography 53 (2) (2020) 314–325 (Apr 2020). doi:10.1107/S1600576720001016.
[33] E. Maire, P. Withers, Quantitative x-ray tomography, In-ternational Materials Reviews 59 (1) (2014) 1–43 (2014). doi:10.1179/1743280413Y.0000000023.
[34] S. S. Singh, J. J. Williams, P. Hruby, X. Xiao, F. De Carlo, N. Chawla, In situ experimental techniques to study the mechanical behavior of ma-terials using x-ray synchrotron tomography, Integrating Mama-terials and Manufacturing Innovation 3 (2014) 109–122 (2014). doi:10.1186/2193-9772-3-9.
[35] E. Boulard, A. King, N. Guignot, P. Deslandes, Y. Le Godec, J.-P. Perrillat, A. Clark, G. Morard, J.-J.-P. Iti´e, High-speed tomogra-phy under extreme conditions at the psiche beamline of the soleil synchrotron, Journal of Synchrotron Radiation 25 (3) (2018) 818–825 (2018). doi:10.1107/S1600577518004861.
[36] M. Drakopoulos, Engineering science at the i12 beamline at diamond light source, Synchrotron Radiation News 30 (2017) 41–47 (05 2017). doi:10.1080/08940886.2017.1316131.
[37] N. Gu´eninchault, H. Proudhon, W. Ludwig, Nanox, a miniature me-chanical stress rig designed for near-field X-ray diffraction imaging techniques, Journal of Synchrotron Radiation 23 (6) (2016) 1474–1483 (2016). doi:10.1107/S1600577516013850.
[38] M. Pelerin, L. Laiarinandrasana, A. King, H. Proudhon, Development of a versatile mechanical testing device for in situ synchrotron tomography and diffraction experiments, Integrating Materials and Manufacturing Innovation 8 (3) (2019) 378–387 (2019). doi:10.1007/s40192-019-00143-6.
[39] W. Ludwig, E. M. Lauridsen, S. Schmidt, H. F. Poulsen, J. Baruchel, High-resolution three-dimensional mapping of individual grains in poly-crystals by topotomography, Journal of Applied Crystallography 40 (5) (2007) 905–911 (Oct. 2007). doi:10.1107/S002188980703035X.
[40] X. Liang, S. Di, D. Tao, Z. Chen, F. Cappello, An efficient transfor-mation scheme for lossy data compression with point-wise relative er-ror bound, 2018 IEEE International Conference on Cluster Computing (2018). doi:10.1109/CLUSTER.2018.00036.
[41] M. Folk, G. Heber, Q. Koziol, D. Robinson, An overview of the hdf5 tech-nology suite and its applications, ACM International Conference Pro-ceeding Series ProPro-ceedings of the 2011 EDBT/ICDT Workshop on Ar-ray Databases, Uppsala, Sweden, March 25, 2011. Pages 36–47. (2011). doi:10.1145/1966895.1966900.
[42] A. Groeber, A. Jackson, DREAM.3D: A digital representation environ-ment for the analysis of microstructure in 3D, Integrating Materials and Manufacturing Innovation 3 (2014) 5 (2014).
[43] M. K¨onnecke, F. A. Akeroyd, H. J. Bernstein, A. S. Brewster, S. I. Campbell, B. Clausen, S. Cottrell, J. U. Hoffmann, P. R. Jemian, D. M¨annicke, R. Osborn, P. F. Peterson, T. Richter, J. Suzuki, B. Watts, E. Wintersberger, J. Wuttke, The nexus data format, Jour-nal of Applied Crystallography 48 (1) (2015) 301–305 (Feb 2015). doi:10.1107/S1600576714027575.
[44] Zstandard – real-time data compression algorithm, https://facebook.github.io/zstd/, accessed: 2020-01-09.
[45] M. Pelerin, H. Proudhon, A. King, Data reduction for in situ synchrotron tomography experiments (1 2020). doi:10.5281/zenodo.3603537.
[46] L. H. Nielsen, Sharing your data and software on zenodo (May 2017). doi:10.5281/zenodo.802100.
[47] F. Marone, A. Studer, H. Billich, L. Sala, M. Stampanoni, Towards on-the-fly data post-processing for real-time tomographic imaging at tom-cat, Advanced Structural and Chemical Imaging 3 (1) (2017) 1 (2017). doi:10.1186/s40679-016-0035-9.
[48] J. Kieffer, S. Petitdemange, T. Vincent, Real-time diffraction computed tomography data reduction, Journal of Synchrotron Radiation 25 (2) (2018) 612–617 (Mar 2018). doi:10.1107/S1600577518000607.
[49] Zenodo – research. shared., https://zenodo.org/, accessed: 2020-01-09.
[50] A. King, N. Guignot, P. Zerbino, E. Boulard, K. Desjardins, M. Bor-dessoule, N. Leclerq, S. Le, G. Renaud, M. Cerato, M. Bornert, N. Lenoir, S. Delzon, J.-P. Perrillat, Y. Legodec, J.-P. Iti´e, To-mography and imaging at the psiche beam line of the soleil syn-chrotron, Review of Scientific Instruments 87 (9) (2016) 093704 (2016). doi:10.1063/1.4961365.
[51] D. Paganin, S. C. Mayo, T. E. Gureyev, P. R. Miller, S. W. Wilkins, Simultaneous phase and amplitude extraction from a single defocused image of a homogeneous object, Journal of Microscopy 206 (1) (2002) 33–40 (2002). doi:10.1046/j.1365-2818.2002.01010.x.
[52] A. Mirone, E. Brun, E. Gouillart, P. Tafforeau, J. Kieffer, The PyHST2 hybrid distributed code for high speed tomographic reconstruction with iterative reconstruction and a priori knowledge capabilities, Nuclear Instruments and Methods in Physics Research Section B: Beam In-teractions with Materials and Atoms 324 (0) (2014) 41–48 (2014). doi:10.1016/j.nimb.2013.09.030.
[53] N. Selles, N. Saintier, A. King, H. Proudhon, L. Laiarinandrasana, Time dependent voiding mechanisms in polyamide 6 submitted to high stress triaxiality: experimental characterization and finite element modelling, Mechanics of Time-Dependent Materials 22 (3) (2018) 351–371 (2018). doi:10.1007/s11043-017-9360-1.
[54] M. Kobayashi, H. Toda, Y. Kawai, T. Ohgaki, K. Uesugi, D. S. Wilkinson, T. Kobayashi, Y. Aoki, M. Nakazawa, High-density three-dimensional mapping of internal strain by tracking microstruc-tural features, Acta Materialia 56 (10) (2008) 2167–2181 (2008). doi:10.1016/j.actamat.2007.12.058.
[55] N. Li, M. Sutton, H. Schreier, J. L. Turner, N. Mani, Strain mea-surements through optimized particle tracking in volumetric images:
Methodology and error assessment, Experimental Mechanics 56 (2016) 1281–1291 (2016). doi:10.1007/s11340-016-0146-1.
[56] M. Patel, S. E. Leggett, A. K. Landauer, I. Y. Wong, C. Franck, Rapid, topology-based particle tracking for high-resolution measurements of large complex 3D motion fields., Scientific Reports 8 (2018) 5581 (2018). doi:10.1038/s41598-018-23488-y.
[57] Y. S. Choi, M. A. Groeber, P. A. Shade, T. J. Turner, J. C. Schuren, D. M. Dimiduk, M. D. Uchic, A. D. Rollett, Crystal plasticity finite element method simulations for a polycrystalline ni micro-specimen de-formed in tension, Metallurgical and Materials Transactions A 45 (13) (2014) 6352–6359 (2014). doi:10.1007/s11661-014-2556-y.
[58] W. Ludwig, A. King, M. Herbig, P. Reischig, J. Marrow, L. Babout, E. M. Lauridsen, H. Proudhon, J. Y. Buffi`ere, Characterization of poly-crystalline materials using synchrotron X-ray imaging and diffraction techniques, JOM 62 (12) (2010) 22–28 (Dec. 2010). doi:10.1007/s11837-010-0176-6.
[59] H. Proudhon, N. Gu´eninchault, S. Forest, W. Ludwig, Incipient bulk polycrystal plasticity observed by synchrotron in-situ topotomography, Materials 11 (10) (2018). doi:10.3390/ma11102018.
[60] H. Proudhon, N. Gueninchault, S. Forest, W. Ludwig, Diffraction Contrast Tomography reconstruction of an Aluminium-Lithium tension specimen (Sep. 2018). doi:10.5281/zenodo.1412401.
[61] W. Ludwig, N. Vigano, H. Proudhon, Observation of slip bands in the bulk of polycrystals using a combination of DCT and Topotomography, in: 40th Risø International Symposium : Metal Microstructures in 2D, 3D and 4D, Risoe, Denmark, 2019 (Sep. 2019).
[62] N. Vigan`o, W. Ludwig, K. J. Batenburg, Reconstruction of local ori-entation in grains using a discrete represori-entation of oriori-entation space, Journal of Applied Crystallography 47 (6) (2014) 1826–1840 (Dec 2014). doi:10.1107/S1600576714020147.
[63] A. Marano, L. G´el´ebart, S. Forest, Intragranular localization induced by softening crystal plasticity: Analysis of slip and kink bands localization
modes from high resolution FFT-simulations results, Acta Materialia 175 (2019) 262–275 (Aug. 2019). doi:10.1016/j.actamat.2019.06.010. [64] O. Jamond, R. Gatti, A. Roos, B. Devincre, Consistent formulation for
the discrete-continuous model: Improving complex dislocation dynamics simulations, International Journal of Plasticity 80 (2016) 19–37 (2016). doi:10.1016/j.ijplas.2015.12.011.
![Figure 1: Examples of mechanical stress rigs to carry out 4D experiments [37, 38].](https://thumb-eu.123doks.com/thumbv2/123doknet/11635808.306532/5.918.176.707.196.429/figure-examples-mechanical-stress-rigs-carry-d-experiments.webp)