INTRODUCTION
Emissions of carbon dioxide (CO2) and methane (CH4) by mangrove sediments are potential sources of greenhouse gas to the atmosphere and as such may contribute to global climate change (Purvaja & Ramesh
2001, Borges et al. 2003, Biswas et al. 2004, Barnes et al. 2006). On the other hand, the high primary produc-tion by mangrove trees, accreproduc-tion and permanent stor-age of organic carbon in sediments point to the fact that many mangrove environments are actually sinks of atmospheric CO2(Alongi 2007, Tateda et al. 2007,
© Inter-Research 2008 · www.int-res.com *Email: ebk@biology.sdu.dk
Emission of CO
2
and CH
4
to the atmosphere by
sediments and open waters in two Tanzanian
mangrove forests
Erik Kristensen
1,*, Mogens R. Flindt
1, Shadrack Ulomi
1, 2, Alberto V. Borges
3,
Gwenaël Abril
4, Steven Bouillon
5, 61Institute of Biology, University of Southern Denmark, 5230 Odense M, Denmark
2Faculty of Aquatic Sciences and Technology, University of Dar es Salaam, PO Box 35064, Tanzania
3Unité d’Océanographie Chimique, Interfacultary Center for Marine Research, Université de Liège, Institut de Physique (B5), 4000 Liège, Belgium
4Laboratoire Environnement et Paléoenvironnement OCéaniques (EPOC), Université Bordeaux 1, CNRS-UMR 5805, Avenue des Facultés, 33405 Talence, France
5Department of Analytical and Environmental Chemistry, Vrije Universiteit Brussel, Pleinlaan 2, 1050 Brussels, Belgium 6Netherlands Institute of Ecology, Centre for Estuarine and Marine Ecology (NIOO-KNAW), Korringaweg 7, 4401 Yerseke,
The Netherlands
ABSTRACT: Carbon gas balance was evaluated in an anthropogenically impacted (Mtoni) and a pris-tine (Ras Dege) mangrove forest in Tanzania. Exchange of carbon dioxide (CO2) was measured for inundated and air-exposed sediments during day and night using in situ and laboratory incubations.
In situ methane (CH4) emissions were measured in the dark during air exposure only. Emission of
CO2and CH4from open waters (e.g. creeks) was estimated from diurnal measurements of CO2, par-tial pressure (pCO2) and CH4concentrations. CO2emission from darkened sediments devoid of bio-genic structures was comparable during inundation and air exposure (28 to 115 mmol m–2d–1) with no differences between mangrove forests. Benthic primary production was low with only occasional net uptake of CO2by the sediments. Emissions of CH4from air-exposed sediment were generally 3 orders of magnitude lower than for CO2. Presence of pneumatophores and crab burrows increased low tide emissions several fold. Emissions from open waters were dependent on tidal level and wind speed. Lowest emission occurred during high tide (1 to 6 mmol CO2m–2d–1; 10 to 80 µmol CH4m–2 d–1) and highest during low tide (30 to 80 mmol CO
2m–2d–1; 100 to 350 µmol CH4m–2d–1) when supersaturated runoff from the forest floor and porewater seepage reached the creek water. Based on global average primary production and measured gas emissions, the carbon gas balance of the 2 mangrove forests was estimated. The densely vegetated Ras Dege forest appears to be an efficient sink of greenhouse carbon gases, while extensive clear-cutting at the Mtoni forest apparently has reduced its capacity to absorb CO2, although it is seemingly still a net sink for atmospheric CO2. KEY WORDS: Mangrove · Pneumatophore · Burrow · Carbon dioxide · Methane · Emission
Bouillon et al. 2008). There are, however, large geo-graphical differences in published attempts to estimate mangrove carbon gas balance caused by variations in factors such as geomorphology, freshwater input and degree of eutrophication (Sotomayor et al. 1994, Pur-vaja & Ramesh 2001, Alongi et al. 2005). Furthermore, it is important not only to consider the carbon balance in terms of CO2 because CH4 has about 20 times greater global warming potential than CO2. CH4 can be a major product of sediment carbon mineralization (Canfield et al. 2005) and as such a potential green-house gas emitted from mangrove ecosystems (Barnes et al. 2006, Upstill-Goddard et al. 2007).
Heterotrophic activity in mangrove sediments is usu-ally determined as the uptake of O2or release of CO2 under inundated or air-exposed conditions (e.g. Alongi et al. 2000, Kristensen et al. 2008). In many cases the rates obtained are not fully representative because biogenic irregularities, such as pneumatophores and burrows, have been deliberately avoided during mea-surements. Benthic fluxes obtained from heteroge-neous mangrove environments are highly variable in time and space, and by including biogenic structures during incubations the results become even more vari-able and much less consistent (Kristensen 2007a). Nev-ertheless, the impact of biogenic structures on carbon gas exchange between mangrove sediments and the atmosphere appears to be so important that they must be included to obtain reliable carbon budgets (Kitaya et al. 2002, Purvaja et al. 2004). However, our knowl-edge on their quantitative importance is limited and warrants more studies.
Carbon gases produced in mangrove sediments are not entirely lost by upward diffusion through the sedi-ment or via biogenic structures. A fraction is instead drained by density-driven tidal exchange of porewater through channels in the sediment and washed into tidal creeks during low tide (Borges et al. 2003, Bouil-lon et al. 2007a). From here the gases can be emitted directly to the atmosphere or transported by tidal action to adjacent waters. Recent studies have noticed such an excess CO2emission from waters in mangrove creeks and the surrounding coastal waters (Borges et al. 2003, Bouillon et al. 2003, 2007a,b,c, Koné & Borges 2007), but only few, if any, have measured the emission from mangrove sediments and creek waters simultane-ously.
The objectives of the present study were to identify and quantify CO2 and CH4 emissions to the atmos-phere in an anthropogenically impacted (Mtoni) and a pristine (Ras Dege) mangrove forest in Tanzania. The partitioning between sediment –air and water–air emissions was addressed with focus on the role of bio-genic structures (pneumatophores and crab burrows) and tidal action. Finally, we provide rough net budgets
of carbon gas emission for the entire Mtoni and Ras Dege mangrove systems based on the estimated emis-sions from vegetated and fauna-inhabited sediments, clear-cut areas and creek tidal waters.
MATERIALS AND METHODS
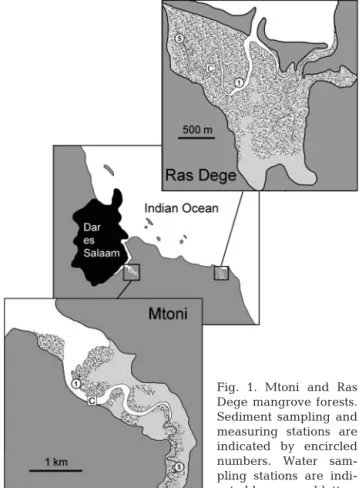
Study area. The study was conducted in 2 mangrove locations, Mtoni and Ras Dege, near the city of Dar es Salaam, Tanzania (Fig. 1) during several sampling campaigns in September 2005, April 2006 and Febru-ary 2007. The climate in the Dar es Salaam area is humid tropical with average day and night tempera-tures of 28 to 31°C and 19 to 25°C, respectively, warmest from October to February. The annual precip-itation is ca. 1100 mm with 2 rainy seasons from March to May and October to November.
The Mtoni mangrove forest covers an area of ca. 3 km2and is drained by a 6 km long tidal creek, which comprises a side branch of Mzinga Creek that forms Dar es Salaam harbor. The creek receives freshwater particularly during wet seasons from streams entering at the head. There is also considerable diffuse ground-water seepage from the surrounding hills. The man-grove forest is impacted indirectly by sewage
dis-Fig. 1. Mtoni and Ras Dege mangrove forests. Sediment sampling and measuring stations are indicated by encircled numbers. Water sam-pling stations are indi-cated by squared letters
charges in the harbor area and suffers from extensive cutting of trees for charcoal production. The vegetation is mixed with dominance of Sonneratia alba, Avicennia
marina, Ceriops tagal and Rhizophora mucronata. The
shallow area outside the mangrove forest is covered by extensive growth of drifting macroalgae during dry seasons.
The Ras Dege mangrove area covers ca. 2 km2and is dominated by Avicennia marina, Rhizophora
mucro-nata, Sonneratia alba and Ceriops tagal. The system is
drained by 2 tidal creeks which open directly into the Indian Ocean. There are no major freshwater inputs except for surface drainage during the wet seasons. Ras Dege does not experience any anthropogenic influence and there is only limited cutting. The mouth of the creeks and the zone adjacent to the mouth are covered by seagrass beds.
Sampling sites. For sediment sampling and flux measurements, 2 stations were selected along the main creek at Mtoni and 2 stations along the western creek at Ras Dege (Fig. 1). The low intertidal M1 (06° 52.760’ S, 39° 17.961’ E) at Mtoni was located near the outer boundary and the high intertidal M5 (06° 53.513’ S, 39° 18.959’ E) near the upper reaches of the main creek. M1 was dominated by Sonneratia alba growing in sandy-mud sediment, while the muddy-sand at M5 had mixed vegetation dominated by
Ceriops tagal. The low intertidal R1 (06° 52.667’ S,
39° 27.596’ E) at Ras Dege was located near the outer boundary and the mid to high intertidal R5 (06° 52.347’ S, 39° 27.169’ E) in the upper reaches of the forest. The sediment at R1 consisted of fine sand and the vegetation was dominated by Avicennia marina, whereas the muddy R5 had a vegetation of primarily
Rhizophora mucronata mixed with few C. tagal. All 4
stations were populated by ocypodid and grapsid crabs that dug numerous burrows in the sediment.
For open water tidal samplings, 1 station (MC) was selected in the main creek at Mtoni (ca. 0.5 km inside M1) and 1 station (RC) in the western creek at Ras Dege (midway between R1 and R5) (Fig. 1).
Pneumatophore and burrow abundance. The abun-dance of pneumatophores and crab burrows at each sediment station was enumerated from digital photos taken in September 2005. Four photos each covering 0.2 m2(0.4 × 0.5 m) were taken perpendicular to the sediment surface at each station. All visible pneu-matophores and burrow openings (irrespective of size) were counted from the photos without differentiating among species of trees and crabs. This poses no prob-lem for pneumatophores because only 1 tree species forming these structures was present at each station. Burrows could not be identified to crab family, and the results represent the combined abundance of ocypodid and grapsid burrows. It is likely that not all crab
bur-rows were inhabited. Based on the results of Skov et al. (2002) from Kenya, we assume that ~81% of the bur-rows in Mtoni and Ras Dege were inhabited.
Sediment characteristics. Triplicate sediment cores (5 cm i.d.) from each station were analyzed for organic content (loss on ignition, LOI) and chlorophyll a (chl a) concentration in September 2005. Cores were sliced into the following depth intervals: 0–1, 1–2, 2–3, 3–4, 4–6, 6–8, 10–12 and 14–16 cm. Organic content was determined as weight loss of dried sediment after com-bustion in a muffle furnace for 6 h at 520°C. Chl a con-tent was analyzed by the standard spectrophotometric method (Parsons et al. 1984) on the 0 to 1 cm slice only. Subsamples of sediment were extracted overnight in 5 ml of 90% ethanol in darkness at 5°C. The extract was centrifuged at 1200 × g, and absorbance of the supernatant was measured at 665 nm and 750 nm before and after acidification.
Sediment –water CO2 exchange. Exchange of CO2 across the sediment –water interface in light and dark-ness was determined by the core-incubation technique in September 2005 and April 2006. Triplicate sediment cores (8 cm i.d. and 20 cm long) without any visible bio-genic structures (pneumatophores and burrow open-ings) were carefully collected at the sampling stations during low tide. The air-exposed cores were immedi-ately transported to the laboratory and submerged into tanks containing creek water from the sampling sites, such that the water surface was at least 2 cm above the upper edge of the core liners. The water column inside the core tubes was ca. 10 cm. The cores were main-tained in the dark overnight under continuous aeration before initiating flux measurements. Water tempera-ture was kept constant at 27 to 29°C, and salinity varied from 2 to 45 depending on season and station.
The cores were sealed gas tight with a transparent lid during flux incubations, and a magnetic stirrer dri-ven by an external rotating magnet maintained a con-tinuous water circulation at a rate below the resuspen-sion limit. Incubations of 3 to 5 h were first performed in darkness. Water samples for total carbon dioxide (TCO2) were taken from the water phase inside each core at the start (before inserting lids) and end (after removing lids). Subsequently, a greenhouse lamp was placed 50 cm above the sediment (light intensity at the sediment surface: ~300 µmol m–2s–1), and the incuba-tion as menincuba-tioned above was repeated. Light measure-ments were only conducted in April 2006.
Samples for TCO2 analysis were preserved with HgCl2and analyzed as soon as possible on a flow injec-tion/diffusion cell analyzer (Hall & Aller 1992).
Sediment –air CO2 and CH4emissions. In
Septem-ber 2005, primary production and respiration by air-exposed sediments were determined on sediment cores in the laboratory by measuring CO2exchange by
a flow-through technique using a Li-Cor LI-820 in-frared CO2analyzer. In April 2006 and February 2007, CO2 exchange measurements were conducted in situ using a Li-Cor LI-6400 Portable Photosynthesis System equipped with a custom-made CO2flux chamber.
For the September 2005 laboratory measurements, triplicate sediment cores without any visible biogenic structures were taken during low tide with 8 cm i.d. core liners at the 4 stations. After return to the labora-tory, the depth of sediment cores was adjusted to allow 2 to 3 cm of air space above the sediment surface (100 to 150 ml headspace). The core tubes were then wrapped in aluminum foil below the sediment surface to protect the deeper sediment from light. CO2 exchange was measured using a flow-through system. The cores were sealed with a lid containing 2 ports and serially con-nected to a peristaltic pump and the LI-820 infrared gas analyzer via gas-tight nylon tubing. The pump pulled ambient air into the headspace of the cores at a rate of 44 ml min–1(equivalent to a turnover time of 1 to 3 min) and out through the gas analyzer. CO2exchange was calculated as the steady state concentration difference between excurrent gas and atmospheric air after main-taining the flow system for 1 to 2 h. Measurements were first done in the dark with cores covered completely with aluminum foil and subsequently under continuous daylight (at least 300 µmol m–2s–1).
For in situ CO2exchange measurements, the sensor-head of the LI-6400 was mounted on a transparent Plexiglas chamber (8 cm i.d. and 18 cm long). The chamber was open at the bottom and sealed perma-nently at the top by a transparent plexiglas lid through which a 0.5 cm equilibration hole was drilled. The equi-libration hole was sealed with a rubber stopper during measurements. The chamber was deployed by care-fully pushing the open end ca. 5 cm into the sediment while the equilibration hole was open. The measure-ment started immediately after the equilibration hole was sealed. The LI-6400 was set for closed-chamber measurement, while the circulation pump in the sensor-head assured a homogeneous gas phase in the cham-ber. Chamber CO2was allowed to change linearly for 5 to 10 min according to the net outcome of production and consumption processes within the sediment. At regular intervals, chamber CO2was scrubbed down be-low the ambient air concentration by soda lime or raised above this level using a CO2cartridge before a new measurement was initiated. Typically 2 or 3 of such repeated measurements were done in light (inci-dent light was typically > 500 µmol m–2s–1) and dark-ness (chamber wrapped in aluminum foil) during each deployment. The exchange of CO2was calculated from the slope of CO2concentration change and related to the volume and area of the chamber. Several deploy-ments were conducted on sediment without biogenic
structures at each station in the 2 mangrove forests fol-lowed by deployments on sediment with crab burrows at M1 and R5 and sediment with pneumatophores of
Sonneratia alba at M1 and Avicennia marina at R1.
Sediment –air methane emission was determined simultaneously with the in situ CO2 exchange mea-surements by inserting 8 cm i.d. and 12 cm long core tubes into the sediment. After 10 min equilibration, the core tubes were sealed gas tight with rubber stoppers equipped with sampling ports, leaving a 6 to 8 cm headspace. Three 4 ml air samples for CH4were taken at 30 min intervals using 5 ml syringes. The CH4 sam-ples were injected into 5 ml evacuated Exetainer glass vials and stored cool until analysis on a gas chromato-graph within 1 mo.
The height and diameter of pneumatophores en-trapped inside the LI-6400 chamber and methane chambers were measured to the nearest mm.
CO2 exchange of crabs. The respiratory CO2 ex-change of fiddler crabs Uca spp. was determined from laboratory incubations at in situ temperature using the LI-6400 equipment. A group of 34 live fiddler crabs of different sex and size (0.4 to 8 g wet weight, wet wt) were caught randomly at M1 and R1 and immediately brought to the laboratory. The Plexiglas chamber con-nected to the sensor-head of the LI-6400 was fitted gas tight with a removable bottom. Individuals were placed in the bottom part, which was mounted to the chamber while the equilibration hole was open. The measure-ment started immediately after the equilibration hole was sealed as described in ‘Sediment –air CO2and CH4 emissions’ section above. Respiratory CO2 release by individual crabs was repeated 3 times in the dark with the chamber covered with aluminum foil.
Creek water CO2and CH4emissions. Tidal variation
of carbon gas concentrations (partial pressure, pCO2, and CH4) and associated parameters in creek water from the Mtoni and Ras Dege mangrove forests (Fig. 1) were determined from hourly water samplings over a 24 h cycle at MC (9 to 10 September 2005) and RC (16 to 17 September 2005; Bouillon et al. 2007a). Tidal range was similar at ~2.5 m during both sampling occasions. Surface water for field measurements of pH, temper-ature and salinity were taken with a 1.7 l Niskin bottle ~0.5 m below the surface. Water pH was measured using a Ross type combination electrode (Orion) cali-brated on the NBS (US National Bureau of Standards) scale, as described by Frankignoulle & Borges (2001). Samples for determination of total alkalinity (TA) were obtained by filtering 100 ml of water through precom-busted Whatman GF/F filters, followed by filtration through 0.2 µm Acrodisc syringe filters, and stored in high density polyethylene (HDPE) bottles until analy-sis by automated electro-titration on 50 ml samples with 0.1 M HCl as titrant. TCO2and pCO2
concentra-tions were computed from pH and TA measurements with the thermodynamic constants described in Frankignoulle & Borges (2001). Water samples for the determination of CH4 concentrations were taken directly from the Niskin bottle into 40 ml headspace vials, preserved with HgCl2and capped with a butyl rubber plug. CH4concentrations were determined by gas chromatography, after creating a headspace with N2, as described in Abril & Iversen (2002). Dissolved CH4concentration was calculated using the solubility coefficient of Yamamoto et al. (1976). Wind speed was measured during each sampling with a handheld anemometer.
The exchange of CO2and CH4(F) across the water– air interface was calculated according to
F = kα ΔC (1)
where k is the gas transfer velocity, α the solubility coefficient for CO2and CH4and ΔC represents the dif-ference in pCO2and CH4between water and air. Val-ues of k in coastal environments are to a large extent determined by wind stress and other site-specific factors such as water currents and fetch-limitation (Borges et al. 2004). We used the k-wind parameteriza-tion proposed by Raymond & Cole (2001) for estuarine environments.
Statistical analysis. Differences in organic content were tested using repeated measures ANOVA, while chl a, gas fluxes and faunal abundance were tested using 2-way ANOVA. When relevant, the ANOVAs were followed by a Bonferroni adjusted Fishers’ Least Significant Difference test to resolve which stations differed. A significance level of α = 0.05 was used in all ANOVA tests, unless otherwise stated. Data were ana-lyzed using SAS (version 9.1).
System-integrated gas emissions were determined as the sum of involved components upscaled by the appropriate abundances and areas. Standard errors of the system-integrated emissions were derived by the approach of Bevington (1969) as described by Stutes et al. (2007). The df of each standard error was calculated using the procedure of Welch (1947), and the 95% con-fidence intervals for determination of significant differ-ences at α = 0.05 was calculated according to Sokal & Rohlf (1981).
RESULTS
Vegetation mapping and tidal coverage The exact area cover of Mtoni and Ras Dege was determined from GIS mapping using high resolution satellite images (European Space Imaging). The Mtoni mangrove forest system covers an area of 3.05 km2
(Fig. 1). Only 0.74 km2(25%) was contiguous patches of mature mangrove tree vegetation in 2006, particu-larly along the main creek. The creek itself covers 0.44 km2 (15%), while the remaining 60% in 2006 stood as deforested intertidal sediment scattered with mangrove tree stubs after years of extensive cutting. Only occasional young trees and saplings were present in the denuded area. The Mtoni area is completely covered by water during spring high tides, and only the creek contains water during low tides. Although the Ras Dege mangrove area (1.90 km2) is smaller than Mtoni, as much as 1.51 km2 (79%) consisted of con-tiguous and pristine mature forest in 2006 (Fig. 1). Only ca. 12% of the entire area was affected by cutting, mostly in the inland part. The creeks are relatively small and cover only 0.17 km2(9%), which is equiva-lent to the low tide open water area. The entire forested area is inundated during spring high tides.
Sediment and water characteristics
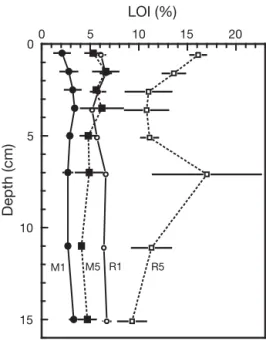
Organic content did not vary significantly with depth in the upper 15 cm of the sediment at any station (Fig. 2). Values were significantly lower at M1 (2.1 to 3.3%) than at R5 (9.3 to 17.0%) (p < 0.001), while the levels were intermediate (p < 0.001) and similar to each other at M5 (4.1 to 6.6%) and R1 (5.2 to 6.7%). Chl a content in the upper cm was similar at M1 (2.9 ± 1.3 µg g–1), M5 (2.5 ± 0.4 µg g–1) and R1 (3.3 ± 0.9 µg g–1), while R5 was significantly lower (0.4 ± 0.2 µg g–1).
Water temperature ranged from 24°C in the early morning to 31°C in the afternoon at both locations dur-ing the September 2005 sampldur-ing. At the same time, salinity near M1 in Mtoni was 35 and 28 during high and low tide, respectively. A freshwater source at the upper reaches reduced salinity near M5 to 25 and 13 during high and low tide, respectively. Near the mouth at Ras Dege (R1), the salinity was 34 and 37 during high and low tide, respectively, while evaporation increased salinity at R5 to 36 and 39, respectively.
Pneumatophore and burrow abundance M1 and R1 had high and continuous abundance of pneumatophores, while these structures were only of scattered occurrence at M5 and R5. The abundance of
Sonneratia alba pneumatophores at M1 and Avicennia marina pneumatophores at R1 were similar at ca.
140 m–2(Table 1). Ocypodid and grapsid crab burrows were ca. 9 times more abundant at M1 than at M5 (p < 0.001). The abundance of crab burrows at the 2 Ras Dege stations was similar at a level of one-third to half of that observed at M1 (p < 0.001).
CO2exchange across the sediment –water interface
The dark CO2efflux (respiration: RSP) by inundated sediment without biogenic structures in Mtoni and Ras Dege ranged from 28 to 115 mmol m–2d–1with no over-all difference between the 2 mangrove forests (Fig. 3). RSP at M1 was 1.9 to 2.0 times higher (p < 0.01) than at M5 and 2.0 to 2.2 times higher (p < 0.01) for both sta-tions in the wet than the dry season. R1 had 1.5 times higher RSP in the wet than the dry season (p < 0.01), while R5 behaved opposite with 2.2 times higher rates in the dry than the wet season (p < 0.01). As a conse-quence, the 2 Ras Dege stations showed similar RSP in the dry season, while R1 exceeded R5 by a factor of 2.9 in the wet season (p < 0.01).
Benthic net primary production (NPP) during inunda-tion was low in the wet season and net uptake of CO2 was never detected (Fig. 3). Unfortunately, no light measurements were conducted in the dry season. Gross
primary production (GPP = RSP – NPP) was similar at the Mtoni stations in the wet season showing rates of 56 to 63 mmol m–2d–1. These were almost twice (p < 0.01) the rates found in Ras Dege (29 to 36 mmol m–2d–1).
CO2and CH4exchange across the sediment –air
interface
CO2emission from exposed and darkened sediment to the atmosphere (RSP) showed no specific pattern among stations and mangrove forests, except for slightly higher release at M1 than M5 (p < 0.05 only for the dry season; Fig. 3). RSP was consistently higher (p < 0.01) in the dry (47 to 88 mmol m–2d–1) than the wet season (38 to 46 mmol m–2d–1). In general, RSP of air-exposed sediment was similar to or lower (p < 0.01 for R1 and R5 in the dry season and M1 and R1 in the wet season) than that of inundated sediment.
NPP varied among stations and net CO2uptake was only registered at R1 in the dry season and M5 in the wet 0 5 10 15 Depth (cm) 0 5 10 15 20 LOI (%) M1 M5 R1 R5
Fig. 2. Vertical profiles of organic matter (loss on ignition, LOI) at Stns M1 and M5 in Mtoni and Stns R1 and R5 in
Ras Dege. Values are given as mean ± SE (n = 3)
M1 M5 R1 R5
Pneumatophores 143 ± 14 ~0 138 ± 15 ~0 Burrow openings 626 ± 65 68 ± 17 313 ± 20 237 ± 53 Table 1. Estimated abundance of pneumatophores and bur-row openings at Stns M1 and M5 in Mtoni and R1 and R5 in Ras Dege (m–2). Pneumatophores originate from Sonneratia
alba at M1 and from Avicennia marina at R1. Burrow open-ings belong to both Ocypodid and Grapsid crabs. Results are
given as mean ± SE (n = 4) – 50 0 a b 50 100 150 CO 2 exchange (mmol m –2 d –1) M1 M5 R1 R5 M1 M5 R1 R5 M1 M5 R1 R5 M1 M5 R1 R5 Inundated Exposed RSP NPP No NPP data Dry season (09/2005) Wet season (04/2006) –100 – 50 0 50 100 150 –100
Fig. 3. Exchange of CO2across the surface of sediment
with-out biogenic structures at Stns M1 and M5 in Mtoni and R1 and R5 in Ras Dege. Measurements were made under inun-dated (left) and air-exposed (right) conditions during the (a) dry and (b) wet seasons. Filled bars: dark measurements (= benthic respiration, RSP); open bars: light measurements (= benthic net primary production, NPP). No measurements were made in the light under inundated conditions during the dry season. Values are given as mean ± SE (n = 3, except for
season (Fig. 3). Despite the inter-station variability in RSP and NPP, GPP at the 2 exposed Mtoni stations and R1 in Ras Dege was similar in the dry (26 to 64 mmol m–2 d–1) and wet (35 to 67 mmol m–2d–1) seasons, at the same level as found during inundation in the wet season. The low GPP of exposed sediment at R5 in Ras Dege (10 to 20 mmol m–2d–1) was also consistent with the low rate observed at this station during inundation.
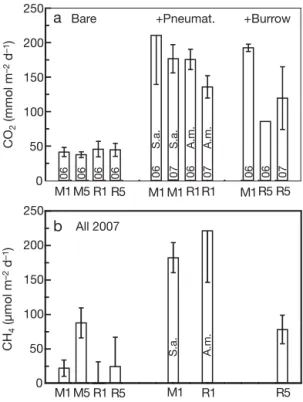
The emission of CH4at low tide from sediments with-out biogenic structures varied both within and among stations (Fig. 4). In general, the emission of CH4was 3 or-ders of magnitude lower than CO2emissions. The high-est (p < 0.01) release of CH4occurred at M5 (87.6 ± 21.1 µmol m–2 d–1). Emissions at the other 3 stations did not differ significantly and ranged from 0 to 25 µmol m–2d–1.
CO2and CH4emissions by pneumatophores,
burrows and crabs
Emission of CO2was enhanced considerably by the presence of pneumatophores and burrows. The
mea-sured rates of CO2release from chamber deployments with Sonneratia alba pneumatophores at M1 and
Avi-cennia marina pneumatophores at R1 were 4.3 to 5.1
and 3 to 3.9 times higher, respectively, than across the sediment surface (p < 0.001; Fig. 4). The enhancement of CO2emission in deployments with burrows was of the same magnitude, i.e. a factor of 4.7 at M1 and 1.9 to 2.7 at R5 (p < 0.001). It is important to note here that the number of pneumatophores and burrows trapped inside the measuring chamber (1 to 2 or equivalent to 200 to 400 m–2) was not identical to the natural abun-dance of these biogenic structures (see Table 1). Fur-thermore, the size of pneumatophores was probably in the low range of the natural size distribution because they were selected to fit inside the chamber (max. length of 13 cm).
The estimated emission of CO2from individual Son-neratia alba pneumatophores after subtraction of the
sediment contribution was 58% higher than that of
Avicennia marina pneumatophores (Table 2), which
corresponds well to the overall difference in pneu-matophore size of the 2 tree species. Thus, based on the height and diameter it was calculated that the examined S. alba and A. marina pneumatophores had an average individual surface area of 38.2 ± 6.0 and 16.7 ± 7.9 cm2, respectively.
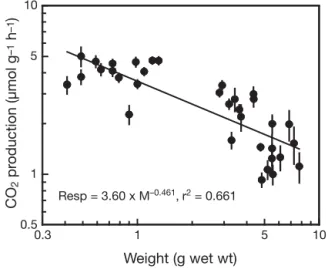
The average CO2emission from individual crab bur-rows was lower than the emission from pneumato-phores (p < 0.01; Table 2). Most burrows contained one crab, but this could not be documented since crabs rapidly retreated to their burrows when disturbed. No attempts were made to recover the inhabitants, but in many cases, they were visible in the burrow opening. We therefore must rely on the estimate of Skov et al, (2002) that 81% of all burrows are inhabited. Part of the CO2emission from burrows must therefore originate from their inhabitants. The measured weight-specific respiration of Uca sp. decreased with increasing body weight according to a power function with a slope of –0.461 (Fig. 5). Thus, an average sized Uca individual of 3.2 g wet wt from M1 respired 161 ± 38 µmol CO2d–1.
CH4 emission was also strongly enhanced by the presence of pneumatophores and burrows. Sonneratia
alba pneumatophores at M1 increased the measured
total CH4emission 8.2 times (p < 0.001), while for Avi-cennia marina pneumatophores at R1 the effect was
greater showing an increase from 0 for the sediment alone to 221 µmol m–2d–1(Fig. 4). CH
4emission from burrows was only measured at R5 where these struc-tures increased the release 3.2 times. The concern about unrealistic abundance of pneumatophores and burrows are also valid for CH4measurements because the chambers used were of identical diameter to the LI-6400 chamber. In addition, only relatively small and similar-sized pneumatophores of both species could be 0 50 100 150 200 250
a
b
0 50 100 150 200 250 CO 2 (mmol m –2 d –1) CH 4 (µmol m –2 d –1) S.a. S.a. S.a. A.m. A.m. A.m. Bare All 2007 06 06 06 06 06 07 06 07 06 06 07 +Pneumat. +Burrow M1 M5 R1 R5 M1 R1 R5 M1 M5 R1 R5 M1M1R1R1 M1R5R5Fig. 4. (a) Emission of CO2and (b) CH4from air-exposed
sed-iment in the dark at Stns M1 and M5 in Mtoni and R1 and R5 in Ras Dege. Rates are shown for sediment without biogenic structures (Bare), for sediment with 200 Sonneratia alba and 400 Avicennia marina pneumatphores m–2(+Pneumat.) and
for sediment with 200 crab burrows m–2 (+Burrow). CO 2
fluxes obtained in April 2006 and February 2007 are indicated with 06 and 07, respectively. All CH4fluxes were obtained in
trapped inside the 4 to 6 cm air space of the chambers. The CH4 emission by these young pneumatophores was probably lower than that of 2 to 3 times taller mature structures. The impact of pneumatophores on CH4emission as shown here must therefore be consid-ered a minimum estimate.
The calculated emission of CH4 from individual Avicennia marina pneumatophores after subtraction of
the sediment contribution was 38% higher than that from Sonneratia alba pneumatophores (Table 2). The release of CH4from an individual crab burrow from R5 was lower and only accounted for 24% of that released from a single A. marina pneumatophore (p < 0.01).
CO2and CH4emissions from open water in creeks
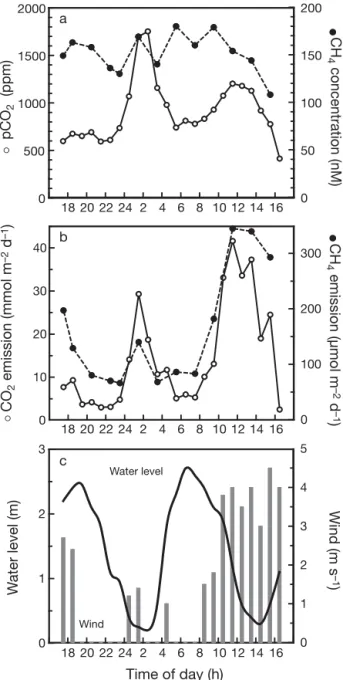
The tidal behavior of pCO2and CH4concentrations in creek water varied between the 2 mangrove environ-ments in September 2005 (Figs. 6 & 7). Tides caused pCO2 to increase from ca. 500 ppm at high tide to
1700 ppm at low tide in MC, while CH4concentrations remained constantly high (ca. 150 nM) with no clear tidal pattern. The carbon gas concentrations in RC were also lowest during high tide when creeks received oceanic water in near-equilibrium with the atmosphere and were ca. 10 times higher (pCO2~5000 ppm, CH4~100 nM) when drainage water enriched with CO2and CH4from the mangrove forest dominated during low tide.
Emissions of CO2and CH4from open waters were ob-viously dependent on the tidal level, but wind speed ex-erted a strong secondary control. CO2emission from the Mtoni creek water to the atmosphere showed a mini-mum at high tide of 3 to 9 mmol m–2d–1, while only 1 to 2 mmol m–2 d–1 was released during high tide in Ras Dege, which corresponds well to the difference in pCO2 at this time. At low tide, the creek water CO2emissions were very dependent on the wind and varied between 20 and 40 mmol m–2d–1in Mtoni and 50 and 80 mmol m–2 d–1in Ras Dege. CH
4emissions showed a tidal pattern similar to that of CO2. The apparent tidal pattern of CH4 emissions in the Mtoni creek was caused by changes in wind, resulting in 2 to 8 times higher rates than in the more tidally controlled Ras Dege creek. Lowest high tide CH4rates were estimated to be 70 to 90 µmol m–2d–1and 10 to 15 µmol m–2d–1in Mtoni and Ras Dege, respec-tively, while the highest rates at low tide were 150 to 350 µmol m–2d–1and 50 to 70 µmol m–2d–1, respectively.
DISCUSSION
Sediment –water/air exchange
Exchange of CO2 across mangrove sediment sur-faces devoid of biogenic structures (pneumatophores and burrows) represents the net outcome of near sur-face microheterotrophic carbon mineralization (e.g. aerobic respiration, iron reduction and sulfate reduc-tion) and carbon fixation by microphytobenthic pri-mary production (Kristensen & Alongi 2006). However, the heterotrophic activity within these sediments is not only dependent on the microphytobenthic production,
Stn (yr) S. alba A. marina Burrow
CO2 CH4 CO2 CH4 CO2 CH43 M1 (2006) 650 ± 154 na na nd 445 ± 80 na M1 (2007) 678 ± 54 0.800 ± 0.066 na nd na nd R1 (2006) na nd 390 ± 22 na na nd R1 (2007) na nd 451 ± 36 1.107 ± 0.105 na nd R5 (2006) na nd nd nd 207 ± na na R5 (2007) na nd nd nd 281 ± 74 0.268 ± 0.049
Table 2. Calculated CO2and CH4emissions from individual pneumatophores of Sonneratia alba and Avicennia marina and
open-ing of crab burrows duropen-ing air exposure at low tide. Values were obtained as the difference between directly measured fluxes from sediment with and without pneumatophores/burrows. Values are given as mean µmol pneu–1d–1or µmol burrow–1d–1± SE
(n = 6). na: not applicable; nd: no data
0.3 1 5 10 Weight (g wet wt) 0.5 1 5 10 CO 2 pr oduction (µmol g –1 h –1) Resp = 3.60 x M–0.461, r2 = 0.661
Fig. 5. Respiratory CO2production by fiddler crabs (Uca spp.)
as a function of live body weight (M). The data include both males and females. Values are given as mean ± SE (n = 100 sequential 10 s measuring intervals). The regression equation
but also on the delivery and burial of reactive organic carbon from other sources (litterfall, root production and tidal import) (Kristensen et al. 2008).
The consistently higher near-surface microhetero-trophic activity observed at M1 than M5, as indicated by higher CO2release in the dark during both inunda-tion and air exposure (Fig. 3), is probably caused by im-port of reactive detritus at the outer reaches in Mtoni. Floating macroalgae from the shallow eutrophic area outside the mangrove forest are transported into the
forest via tides, trapped by pneumatophores and low branches and buried into the sediment by crabs (Kris-tensen 2007b). As these processes primarily occur in the outer part of the forest (M1), more reactive detritus is available here for microheterotrophs. The rapid degradation of reactive detritus deposited at M1 causes the sediment organic content to be low compared with M5 where mangrove detritus of low reactivity accumu-lates (Fig. 2). A similar inconsistency between hetero-trophic activity and bulk sediment organic content has been observed previously in other mangrove
environ-0 10 20 30 40 CO 2 emission (mmol m –2 d –1) 0 100 200 300 CH 4 emission (µmol m –2 d –1 ) a b c Time of day (h) 0 1 2 3 W a ter level (m) 0 1 2 3 4 5 Wind (m s –1 ) Water level Wind 0 500 1000 1500 2000 pCO 2 (ppm) 0 50 100 150 200 CH 4 concentration (nM) 18 20 22 24 2 4 6 8 10 12 14 16 18 20 22 24 2 4 6 8 10 12 14 16 18 20 22 24 2 4 6 8 10 12 14 16 s s d d
Fig. 6. (a) pCO2 and CH4 concentrations in creek water,
(b) emission of CO2and CH4from creek water and (c) water
level and wind speed at Stn MC in Mtoni. Measurements were conducted at hourly intervals for 24 h and covers 2 tidal
periods, 1 in the dark and 1 in the light
CO 2 emission (mmol m –2 d –1) CH4 emission (µmol m –2 d –1 ) 0 20 40 60 80 100 0 50 100 150 200 a b c W ater level (m) Wind (m s –1 ) Wind Water level Time of day (h) 0 1 2 3 0 1 2 3 0 1000 2000 3000 4000 5000 pCO 2 (ppm) 0 50 100 150 CH 4 concentration (nM) d d 18 20 22 24 2 4 6 8 10 12 14 16 18 20 22 24 2 4 6 8 10 12 14 16 18 20 22 24 2 4 6 8 10 12 14 16 s s
Fig. 7. (a) pCO2 and CH4 concentrations in creek water,
(b) emission of CO2and CH4from creek water and (c) water
level and wind speed at Stn RC in Ras Dege. Measurements were conducted at hourly intervals for 24 h and covers 2 tidal
ments (Holmer et al. 1999, Alongi et al. 2000), and it is also clearly evident at Ras Dege. Here the 3 times higher organic content at R5 than R1 is not reflected in the heterotrophic activity. Dark CO2release is similar at the 2 stations, except during inundation in the wet sea-son where R1 actually exhibited 3 times higher rates. R5 deep in the Ras Dege mangrove forest seems to be a deposition area for refractory mangrove detritus due to slow currents, while the strong currents at the outer R1 resuspend mangrove detritus. Since the oligotrophic waters entering Ras Dege with tides do not carry large amounts of algal detritus, microheterotrophic activity in R1 sediments must be supported primarily by auto-chthonously derived microphytobenthic production. In fact, benthic primary production is several times higher at R1 than at R5.
Several studies have shown that CO2 exchange across the sediment –water/air interface measured selectively at sites devoid of biogenic structures may seriously underestimate the true rates (Holmer et al. 1999, Kitaya et al. 2002). The results from Mtoni and Ras Dege indeed show that pneumatophores and bur-rows increase sediment –air release of CO2in the dark several fold (Table 3), particularly at M1 and R1 where these structures are abundant (Table 1). The impact is most pronounced during air exposure because gas exchange is prohibited when lenticels of pneumato-phores are closed and burrows are plugged by their inhabitants during inundation (De la Iglesia et al. 1994, Skelton & Allaway 1996, Allaway et al. 2001). Trans-port of gases is then largely limited to diffusion across the horizontal sediment –water interface. Open lenti-cels during air exposure allow for rapid diffusion of CO2 from the air-filled aerenchyma tissue of roots to the atmosphere (Purnobasuki & Suzuki 2004, 2005). The CO2is generated by root respiration (Kitaya et al. 2002, Lovelock et al. 2006) or derived from micro-heterotrophic production in the surrounding deep sediments via transport across the root
epidermis (Scholander et al. 1955). Also crab burrows, which are opened by their inhabitants at low tide, will augment the gas exchange by providing a much larger surface area available for diffusive trans-port of CO2to the atmosphere (Table 3). In this case the emitted CO2will originate from respiration of the crab inhabitant (if present) and from microheterotrophic production in the deep sediments (Pinder & Smits 1993, Datta 2005).
The estimated emission of CO2 from examined pneumatophores of Sonneratia
alba (0.65 to 0.68 mmol d–1) and
Avicen-nia marina (0.39 to 0.45 mmol d–1) in
Mtoni and Ras Dege (Table 2) is similar to
the rates found by Kitaya et al. (2002) in Japan for 30 to 50% taller pneumatophores of the same 2 species (0.66 and 0.26 mmol d–1, respectively). The CO
2 budget in the dark at M1 and R1 (Table 3) indicates that pneu-matophores of the size examined are responsible for 29% of the total emission from air-exposed sediment. This is probably an underestimate of the true emission from larger pneumatophores that did not fit into the measuring chamber. It is uncertain, however, how the emission is partitioned into root respiration and microheterotrophic sediment respiration. Emission of CO2 from mangrove sediments is usually considered an integrated measure of heterotrophic activity by the decomposer food chain (Canfield et al. 2005) and as such represents degradation of the forest net produc-tion and imported organic sources. The fracproduc-tion of pneumatophore CO2emission that is derived from root respiration, on the other hand, should be considered a part of tree GPP and in reality can not be included in the decomposer contribution. We cannot differentiate between the 2 sources here because no knowledge is available on the origin of CO2emitted from pneumato-phores.
The contribution of crab burrows to the total CO2 emission from sediments is significant, but varies con-siderably depending on burrow abundance. At M1, R1 and R2, where crabs were abundant, 49 to 62% of the total emission occurs through burrow openings, while the contribution is only 36% at the less-populated M5 (Table 3). Most of the total burrow emission is due to CO2diffusing from the surrounding sediment (58%), while the remainder is due to crab respiration when the ~0.81 crabs present per burrow are fiddler crabs or species that respire similarly. In contrast to root respi-ration, the contribution of crabs must be considered an integrated part of the decomposer food chain as they consume and metabolize microphytobenthic and bac-terial net production (Kristensen & Alongi 2006).
M1 M5 R1 R5 Sediment 41 ± 6 (12) 38 ± 4 (64) 46 ± 11 (23) 45 ± 9 (38) Pneumatophores 95 ± 25 (29) na00 58 ± 9 (29) na00 Burrows 113 ± 52 (34) 12 ± 6 (20) 58 ± 26 (23) 43 ± 22 (30) Crabs 81 ± 21 (25) 9 ± 3 (16) 41 ± 10 (25) 31 ± 10 (32) Total 330 ± 63000 59 ± 80000203 ± 310000 119 ± 26 Table 3. CO2emission budget in the dark during low tide for Stns M1, M5,
R1 and R5. Rates are shown for sediment supplemented with the contribu-tion of pneumatophores, burrows and crabs. Rates for sediment are from Fig. 4. Individual rates of the biogenic structures are given in Table 2 and in the text, while the abundance of pneumatophores as well as the abun-dance of burrows at each station is given in Table 1. It is assumed that 0.81 crabs were present inside each burrow. Rates are given as mean ± SE (mmol m–2 d–1). Numbers in parenthesis are the % contribution of each
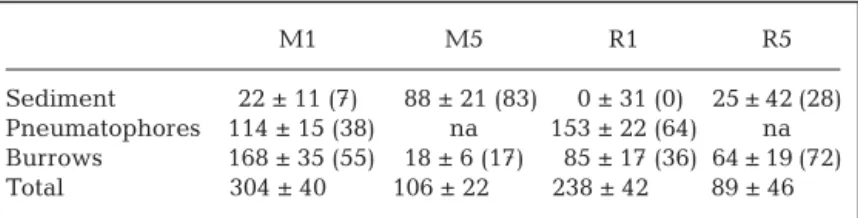
Methanogenesis is usually considered a minor pathway for diagenetic organic car-bon degradation in marine sediments, and it occurs only where all electron ac-ceptors (O2, NO3–, Fe(III) and SO42 –) are depleted. Efflux from sediments rarely occurs because CH4 is oxidized by methanotrophs before reaching the sedi-ment surface (Canfield et al. 2005). The low diffusive emission of CH4across the sediment –air interface in Mtoni and Ras Dege agrees well with previous reports of undetectable or low CH4emissions from a variety of pristine mangrove sediments
(Alongi et al. 2000, Kreuzwieser et al. 2003, Barnes et al. 2006, Allen et al. 2007). In fact, the emission of 31 to 48 µmol CH4m–2d–1found by Lyimo et al. (2002) from sediments adjacent to Sonneratia alba vegetation in Mtoni compares very well with the rate of 22 µmol CH4 m–2d–1obtained here from M1 (Fig. 4). Low emissions do not reflect the rates of methanogenesis within man-grove sediments, which can be orders of magnitude higher (Sotomayor et al. 1994, Giani et al. 1996, Lyimo et al. 2002). High CH4emissions from mangrove sedi-ments are primarily found in eutrophic areas where large inputs of labile organic matter increase sediment metabolism and cause depletion of sulfate near the surface (Sotomayor et al. 1994, Purvaja & Ramesh 2001). High rates of methanogenesis and CH4 emis-sions can also occur in mangrove environments influ-enced by freshwater (e.g. rivers and precipitation) because SO42 – is diluted and competitive sulfate re-duction is diminished (Lu et al. 1999). These mecha-nisms are probably driving the generally higher diffu-sive CH4 emission in Mtoni than Ras Dege and, in particular, the 4 times higher rates at the low saline M5 compared with the much more saline M1, R1 and R5 (Fig. 4).
Pneumatophores and burrows serve as conduits for not only CO2 but also for CH4 emission. They act as channels through which CH4from deep sediment lay-ers can escape oxidation and rapidly diffuse to the atmosphere. The emission of CH4from the sediment is extensive when pneumatophores and burrows are abundant, such as M1 and R1 where these structures are responsible for 93 to 100% of the total emission (Table 4). In areas devoid of pneumatophores and less densely populated by crabs, like M5, the total system emission diminishes significantly to only 30 to 40% of that in populated areas (M1 and R1). A similar large impact of pneumatophores on CH4 emissions have been reported previously (Sotomayor et al. 1994, Kreuzwieser et al. 2003, Bauza 2007), while there are to our knowledge no such reports on the role of burrow structures. The individual rates found here for
rela-tively small pneumatophores (Table 2) agree well with values ca. 1 µmol CH4pneu–1d–1found by Sotomayor et al. (1994), but are low compared with rates from eutrophic mangrove environments (Purvaja et al. 2004). It must be emphasized that CH4 emitted from pneumatophores and burrows originate solely from methanogenesis in the surrounding sediment because plant roots and crabs residing inside burrows do not generate CH4.
Water–air exchange
The emission of CO2and CH4from open water in the creeks of Mtoni and Ras Dege mangrove forests is very dynamic and depends on both tidal level and wind (Figs. 6 & 7). The tidal influence is evident as a strong inverse relationship between creek water concentra-tions of CO2and CH4 and water level (Borges et al. 2003, Bouillon et al. 2007a). Tides therefore seem to be the primary controlling factor, but variable winds superimpose an unpredictable and at times important secondary control (Mukhopadhyay et al. 2002). The range of emissions observed in the present mangrove environment agrees well with those for CO2, reported by Borges et al. (2003) and Ramesh et al. (2007), and for CH4, reported by Barnes et al. (2006) and Upstill-Goddard et al. (2007). In accordance with observations of Barnes et al. (2006), creek water emissions of both CO2and CH4in Mtoni and Ras Dege are within the same order of magnitude as emissions from air-exposed sediments.
Emitted CO2and CH4from creek water have several possible sources. While subtidal creek sediments con-tribute continuously, the rapidly increasing emission of both gases after high tide slack coincides with the arrival in the creek of runoff from the forest. During inundation of the forest floor at high tide, the water col-umn receives CO2and CH4via diffusive flux from the sediment in sufficient amounts to supersaturate creek water during receding tides (Bouillon et al. 2007a). The
M1 M5 R1 R5
Sediment 22 ± 11 (7) 88 ± 21 (83) 0 ± 31 (0) 25 ± 42 (28) Pneumatophores 114 ± 15 (38) na 153 ± 22 (64) na Burrows 168 ± 35 (55) 18 ± 6 (17) 85 ± 17 (36) 64 ± 19 (72) Total 304 ± 40 106 ± 22 238 ± 42 89 ± 46 Table 4. CH4emission budget in the dark during low tide for Stns M1, M5,
R1 and R5. Rates are shown for sediment supplemented with the contribu-tion of pneumatophores and burrows. Individual rates of the biogenic struc-tures are given in Table 2, while the abundance of pneumatophores as well as the abundance of burrows at each station is given in Table 1. Rates are given as mean ± SE (µmol m–2 d–1). Numbers in parenthesis are the %
subsequent emission peak occurring at low tide slack indicates that porewater seepage from creek banks provides an additional source of dissolved CO2 and CH4 to the shallow creeks (Kristensen & Suraswadi 2002, Bouillon et al. 2007a). Thus, crab burrows and large pores remaining after decay of dead roots increase the hydraulic conductivity along creek banks at ebb tides and function as conduits for rapid porewa-ter seepage (Ridd 1996, McKee 2001, Susilo et al. 2005). CO2 is also produced within the creeks by heterotrophic microbial oxidation of dissolved organic carbon (DOC) that is delivered by surface runoff, pore-water seepage and excretion by creek pore-water phyto-plankton (Kristensen & Suraswadi 2002, Bouillon et al. 2003, 2007a). No such internal creek water source is active for CH4 because anaerobic methanogenesis cannot occur in oxic creek water (Reeburgh 2007).
Carbon gas balance in Mtoni and Ras Dege mangrove areas
The carbon gas balance of any ecosystem is the out-come of net CO2 fixation by primary producers and release of CO2 and CH4 by heterotrophic processes. The major primary producers in mangrove environ-ments are the trees, while algae usually accounts for less than 20% of total primary production (Kristensen et al. 2008). Unfortunately, there are no data available on primary production in Mtoni and Ras Dege. Reported rates of net tree primary production in a
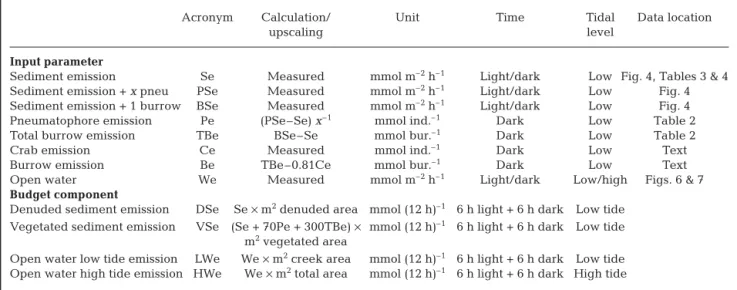
vari-ety of mangrove forests vary considerably with values ranging from 50 to 1300 mmol C m–2d–1(Clough et al. 1997, Clough 1998, Alongi 2002, Okimoto et al. 2007), but most estimates are close to the global average of ~311 ± 103 mmol C m–2d–1(mean ± SE) (Bouillon et al. 2008). A rough estimate of total emissions of the carbon gases, CO2and CH4, by the Mtoni and Ras Dege man-grove systems can be provided by upscaling the presently measured contribution by the various man-grove compartments to the geomorphology and vege-tation distribution (Table 5). Since the exact water cover is defined best at low and high tides, we have chosen only to provide estimates during these ex-tremes. Still a number of assumptions are required for the calculations to be valid: (1) the open water cover is confined to creeks during low tide and covers the entire mangrove area at high tide; (2) the emission from open water throughout the systems is similar to the rate measured at low and high tide in the creeks; (3) the area vegetated by trees has a median of 70 pneumatophores m–2 and 300 inhabited crab bur-rows m–2; (4) the measured emissions from a limited number of pneumatophores and burrows are repre-sentative for all these structures in both areas; (5) the denuded areas are devoid of pneumatophores and crabs; and (6) microphytobenthic primary production is included in net benthic respiration by averaging sediment –air exchange of CO2during day and night. We are aware that some of these assumptions may not be entirely fulfilled, but at present it is the best approach available.
Acronym Calculation/ Unit Time Tidal Data location
upscaling level
Input parameter
Sediment emission Se Measured mmol m–2h–1 Light/dark Low Fig. 4, Tables 3 & 4
Sediment emission + x pneu PSe Measured mmol m–2h–1 Light/dark Low Fig. 4
Sediment emission + 1 burrow BSe Measured mmol m–2h–1 Light/dark Low Fig. 4
Pneumatophore emission Pe (PSe–Se) x–1 mmol ind.–1 Dark Low Table 2
Total burrow emission TBe BSe–Se mmol bur.–1 Dark Low Table 2
Crab emission Ce Measured mmol ind.–1 Dark Low Text
Burrow emission Be TBe–0.81Ce mmol bur.–1 Dark Low Text
Open water We Measured mmol m–2h–1 Light/dark Low/high Figs. 6 & 7
Budget component
Denuded sediment emission DSe Se × m2denuded area mmol (12 h)–1 6 h light + 6 h dark Low tide
Vegetated sediment emission VSe (Se + 70Pe + 300TBe) × mmol (12 h)–1 6 h light + 6 h dark Low tide
m2vegetated area
Open water low tide emission LWe We × m2creek area mmol (12 h)–1 6 h light + 6 h dark Low tide
Open water high tide emission HWe We × m2total area mmol (12 h)–1 6 h light + 6 h dark High tide
Table 5. Calculation overview of daily (24 h) total system carbon gas emission budgets. The table is separated into measured input parameters and calculated budget components. The latter contains upscaling procedures to obtain results given in Table 6. Basic assumptions: (a) 1 d has 12 h light and 12 h dark periods; (b) sediment is covered by water (high tide) during half of each 12 h period; (c) high tides cover the entire mangrove area with water, while only creeks contain water at low tide; (d) abundance of pneumatophores (pneu)and crab burrows is equal to a crude median of all examined stations: 70 and 300 m–2, respectively;
(e) burrows contain on average 0.81 crab inhabitants (Skov et al. 2002); (f) the area of denuded flats, vegetated forest and creeks are specific for each mangrove environment. Input parameter: time = time of day; budget component: time = timing per day
The calculations show that emission of CO2and CH4 is significantly larger during low tide than high tide primarily due to the facilitated emission via pneu-matophores and burrows in air-exposed sediment (Table 6). The total CO2emission (TCE) at low tide is 10 (Mtoni) to 80 (Ras Dege) times higher than at high tide. The large vegetated area in Ras Dege emits 2 times more CO2 than the sparse vegetation in Mtoni during low tide (Table 6). At this time, the open water is only responsible for 4 to 5% of the TCE. An opposite pattern with 6 times higher total and 4 times higher area-specific TCE in Mtoni than Ras Dege is evident during high tide, when open water is responsible for all CO2 emissions (Table 6). The difference in area-specific TCE is probably a consequence of Mtoni ex-changing water with Mzinga Creek, while Ras Dege is connected directly to the Indian Ocean. The former shallow and eutrophic semi-enclosed water body is continuously supersaturated in CO2 and the latter is oceanic water much closer to equilibrium with the atmosphere.
Based on the global average estimate of net tree pri-mary production and the cover of vegetated area, total net primary production (TNPP) in Mtoni and Ras Dege should be 115 ± 38 and 235 ± 78× 103mol 12 h–1(mean ± SE). While autotrophic and heterotrophic processes seem balanced in Mtoni during an avg. 12 h day:night low tide period (TNPP:TCE ~1), Ras Dege appears to be slightly, but not significantly, autotrophic (TNPP: TCE ~2). Conversely, both areas are highly autotrophic during an avg. 12 h day:night high tide period (TNPP:TCE ~10 at Mtoni and 150 at Ras
Dege) indicating a net sequestration of carbon (Table 6). It must be emphasized here that CO2emissions from pneumato-phores during low tide is included solely as a heterotrophic process, ignoring the fact that much of this contribution is derived from GPP. Furthermore, the small size of pneumatophores allowed by the chamber enclosures probably underesti-mates emissions from these structures. However, the TNPP:TCE ratios will not change dramatically if pneumatophores are ignored due to the large burrow con-tribution.
The estimated low emissions of CH4do not contribute significantly to the carbon gas balance. Thus, carbon emitted as CH4 accounts for only 0.1 to 0.2% and 0.8 to 1.2% of the CO2contribution during low and high tide, respectively (Table 6). Alongi (2007) came to the same conclu-sion based on estimates from a variety of mangrove environments. The emission of
CH4in Mtoni and Ras Dege showed the same overall temporal and spatial pattern as that for CO2. However, the emissions were only 2 (Mtoni) and 10 (Ras Dege) times stronger at low than high tide. Besides an unrep-resentative size of pneumatophores examined here, another possible source of error in the present CH4 emission estimate is the missing contribution from ebullition flux of CH4(Barnes et al. 2006).
In conclusion, the densely vegetated and pristine Ras Dege mangrove forest appears to be an efficient sink of greenhouse carbon gases, while the extensive clear-cutting at Mtoni has apparently reduced its capacity to absorb atmospheric CO2. Only strongly eutrophic mangrove environments tend to be sources of green-house gases primarily due to excessive CH4 release (Sotomayor et al. 1994, Purvaja & Ramesh 2001). While eutrophication in Mtoni seemingly increases CH4 emission from sediment and open water several fold (Table 6), the impact is apparently too weak to reverse the greenhouse carbon gas balance. If the harvest of trees for charcoal production continues, this environ-ment may eventually turn into an unvegetated tidal flat and become a significant source of atmospheric carbon gases.
Acknowledgements. This research was supported by the EC-STREP programme PUMPSEA (contract 510863), the FWO-Vlaanderen (contracts G.0632.06, G.0395.07) and the Danish Research Agency (contract 272050408). Thanks to Y. P. Mhonda for help during sampling. This is publication 4366 of the Netherlands Institute of Ecology (NIOO-KNAW).
Mtoni Ras Dege
Low High Low High
CO2(103mol 12 h–1) Denuded 26.0 ± 9.7 na 3.9 ± 0.8 na Vegetated 62.0 ± 11.1 na 119.4 ± 20.4 na Open water 5.1 ± 2.1 9.8 ± 5.0 5.0 ± 1.2 1.6 ± 0.5 Total 93.1 ± 14.9 9.8 ± 5.0 128.3 ± 20.5 1.6 ± 0.5 Total (km–2) 30.5 ± 4.9 3.2 ± 1.6 67.5 ± 10.8 0.8 ± 0.3 CH4(mol 12 h–1) Denuded 51.3 ± 16.9 na 1.3 ± 2.6 na Vegetated 70.7 ± 8.8 na 128.4 ± 21.9 na Open water 61.5 ± 21.1 115.1 ± 13.0 6.7 ± 0.7 12.2 ± 1.4 Total 183.5 ± 28.4 115.1 ± 13.0 136.4 ± 22.1 12.2 ± 1.4 Total (km–2) 60.2 ± 9.30 37.7 ± 4.3 71.8 ± 11.6 6.4 ± 0.7
Table 6. Total emission of CO2 and CH4to the atmosphere in the Mtoni
(3.05 km2) and Ras Dege (1.90 km2) mangrove areas during spring low tide
and high tide. CO2values represent day and night means. The emissions
are partitioned between denuded sediment areas (DSe, assumed devoid of pneumatophores and burrows), vegetated sediment areas with pneu-matophores and burrows (VSe, assumed 70 pneu. m–2and 300 bur. m–2) and
open water area (creeks at low tide, LWe, and the entire mangrove area during high tide, HWe). See Table 5 for further explanation. The rates were calculated for 12 h low tides and 12 h high tides d–1. Error values are SE.
LITERATURE CITED
Abril G, Iversen N (2002) Methane dynamics in a shallow non-tidal estuary (Randers Fjord, Denmark). Mar Ecol Prog Ser 230:171–181
Allaway WG, Curran M, Hollington LM, Ricketts MC, Skelton NJ (2001) Gas space and oxygen exchange in roots of Avi-cennia marina (Forssk.) Vierh. var. australasica (Walp.) Moldenke ex N. C. Duke, the Grey Mangrove. Wetlands Ecol Manag 9:221–228
Allen DE, Dalal RC, Rennenberg H, Meyer RL, Reeves S, Schmidt S (2007) Spatial and temporal variation of nitrous oxide and methane flux between subtropical mangrove sediments and the atmosphere. Soil Biol Biochem 39: 622–631
Alongi DM (2002) Present state and future of the world’s man-grove forests. Environ Conserv 29:331–349
Alongi DM (2007) The contribution of mangrove ecosystems to global carbon cycling and greenhouse gas emission. In: Tateda Y, Upstill-Goddard R, Goreau T, Alongi D, Nose A, Kristensen E, Wattayakorn G (eds) Greenhouse gas and carbon balances in mangrove coastal ecosystems. Gendai Tosho, Kanagawa, p 1–10
Alongi DM, Tirendi F, Clough BF (2000) Below-ground decomposition of organic matter in forests of the man-groves Rhizophora stylosa and Avicennia marina along the arid coast of Western Australia. Aquat Bot 68:97–122 Alongi DM, Pfitzner J, Trott LA, Tirendi F, Dixon P, Klumpp DW (2005) Rapid sediment accumulation and microbial mineralization in forests of the mangrove Kandelia candel in the Jiulongliang Estuary, China. Estuar Coast Shelf Sci 63:605–618
Barnes J, Ramesh R, Purvaja R, Rajkumar AN and others (2006) Tidal dynamics and rainfall control N2O and CH4
emissions from a pristine mangrove creek. Geophys Res Lett 33:L15405 doi:10.1029/2006GL026829
Bauza J (2007) Emissions of greenhouse gases from mangrove forest sediments in Puerto Rica. In: Tateda Y, Upstill-God-dard R, Goreau T, Alongi D, Nose A, Kristensen E, Wat-tayakorn G (eds) Greenhouse gas and carbon balances in mangrove coastal ecosystems. Gendai Tosho, Kanagawa, p 165–177
Bevington PR (1969) Data reduction and error analysis for the physical sciences. McGraw Hill, New York
Biswas H, Mukhopadhyay SK, De TK, Sen S, Jana TK (2004) Biogenic controls on the air–water carbon dioxide ex-change in the Sundarban mangrove environment, north-east coast of Bay of Bengal, India. Limnol Oceanogr 49: 95–101
Borges AV, Djenidi S, Lacroix G, Theate J, Delille B, Frankig-noulle M (2003) Atmospheric CO2flux from mangrove
sur-rounding waters. Geophys Res Lett 30:1558 doi: 10.1029/2003GL017143
Borges AV, Delille B, Schiettecatte LS, Gazeau F, Abril G, Frankignoulle M (2004) Gas transfer velocities of CO2in
three European estuaries (Randers Fjord, Scheldt, and Thames). Limnol Oceanogr 49:1630–1641
Bouillon S, Frankignoulle M, Dehairs F, Velimirov B and oth-ers (2003) Inorganic and organic carbon biogeochemistry in the Gautami Godavari estuary (Andhra Pradesh, India) during pre-monsoon: the local impact of extensive man-grove forests. Global Biogeochem Cycles 17:1114 Bouillon S, Middelburg JJ, Dehairs F, Borges AV and others
(2007a) Importance of intertidal sediment processes and porewater exchange on the water column biogeochem-istry in a pristine mangrove creek (Ras Dege, Tanzania). Biogeosciences 4:311–322
Bouillon S, Dehairs F, Schiettecatte LS, Borges AV (2007b) Biogeochemistry of the Tana estuary and delta (northern Kenya). Limnol Oceanogr 52:45–59
Bouillon S, Dehairs F, Velimirov B, Abril G, Borges AV (2007c) Dynamics of organic and inorganic carbon across contigu-ous mangrove and seagrass systems (Gazi Bay, Kenya), J Geophys Res B 112: G02018 doi:10.1029/2006JG00023 Bouillon S, Borges AV, Castañeda-Moya E, Diele K and others
(2008) Mangrove production and carbon sinks: a revision of global budget estimates. Global Biogeochem Cycles 22: GB2013 doi:10.1029/2007GB003052
Canfield DE, Kristensen E, Thamdrup B (2005) Aquatic geomicrobiology. Elsevier, Amsterdam
Clough BF (1998) Forest structure and carbon fixation by mangroves in Hinchinbrook Channel. In: Ayukai T (ed) Fixation and storage in coastal ecosystems, phase 1 col-lected reports, report 1. Australian Institute of Marine Sci-ence, Townsville, p 1–8
Clough BF, Ong JE, Gong WK (1997) Estimating leaf area index and photosynthetic production in canopies of the mangrove Rhizophora apiculata. Mar Ecol Prog Ser 159: 285–292
Datta M (2005) Computer model for gas diffusion from nests of burrowing animals. Ethn Dis 15:62–63
De la Iglesia HO, Rodriquez EM, Dezi RE (1994) Burrow plug-ging in the crab Uca uruguayensis and its synchronization with photoperiod and tides. Physiol Behav 55:913–919 Frankignoulle M, Borges AV (2001) Direct and indirect pCO2
measurements in a wide range of pCO2and salinity values
(the Scheldt Estuary). Aquat Geochem 7:267–273 Giani L, Bashan Y, Holguin G, Strangman A (1996)
Character-istics and methanogenesis of the Balandra lagoon man-grove solis, Baja California Sur, Mexico. Geoderma 72: 149–160
Hall POJ, Aller RC (1992) Rapid, small-volume flow injection analysis for ™CO2and NH4+in marine and freshwaters.
Limnol Oceanogr 37:1113–1118
Holmer M, Andersen FØ, Holmboe N, Kristensen E, Thongtham N (1999) Transformation and exchange pro-cesses in the Bangrong mangrove forest-seagrass bed sys-tem, Thailand. Seasonal and spatial variations in benthic metabolism and sulfur biogeochemistry. Aquat Microb Ecol 20:203–212
Kitaya Y, Yabuki K, Kiyota M, Tani A, Hirano T, Aiga I (2002) Gas exchange and oxygen concentration in pneumato-phores and prop roots of four mangrove species. Trees (Berl) 16:155–158
Koné YJM, Borges AV (2007) Dissolved inorganic carbon dynamics in the waters surrounding forested mangroves of the Ca Mau Province (Vietnam). Estuar Coast Shelf Sci 77(3):409–421
Kreuzwieser J, Buchholz J, Rennenberg H (2003) Emission of methane and nitrous oxide by Australian mangrove eco-systems. Plant Biol 5:423–431
Kristensen E (2007a) Carbon balance in mangrove sediments: the driving processes and their controls. In: Tateda Y, Upstill-Goddard R, Goreau T, Alongi D, Nose A, Kris-tensen E, Wattayakorn G (eds) Greenhouse gas and car-bon balances in mangrove coastal ecosystems. Gendai Tosho, Kanagawa, p 61–78
Kristensen E (2007b) Mangrove crabs as ecosystem engi-neers; with emphasis on sediment processes. J Sea Res 59: 30–43
Kristensen E, Alongi DM (2006) Control by fiddler crabs (Uca vocans) and plant roots (Avicennia marina) on carbon, iron and sulfur biogeochemistry in mangrove sediment. Limnol Oceanogr 51:1557–1571
➤
➤
➤
➤
➤
➤
➤
➤
➤
➤
➤
➤
➤
➤
➤
➤
➤
Kristensen E, Suraswadi P (2002) Carbon, nitrogen and phos-phorus dynamics in creek water of a Southeast Asian man-grove forest. Hydrobiologia 474:197–211
Kristensen E, Bouillon S, Dittmar T, Marchand C (2008) Organic carbon dynamics in mangrove ecosystems. Aquat Bot 89:201–209
Lovelock CE, Ruess RW, Feller IC (2006) Fine root respiration in the mangrove Rhizophora mangle over variation in forest stature and nutrient availability. Tree Physiol 26:1601–1606 Lu CY, Wong YS, Tam NFY, Ye Y, Lin P (1999) Methane flux and production from sediments of a mangrove wetland on Hainan Island. Mangroves Salt Marshes 3:41–49
Lyimo TJ, Pol A, Op den Camp HJM (2002) Methane emis-sion, sulphide concentration and redox potential profiles in Mtoni mangrove sediment, Tanzania. West Indian Ocean J Mar Sci 1:71–80
McKee KL (2001) Root proliferation in decaying roots and old root channels: a nutrient conservation mechanism in olig-otrophic mangrove forests. J Ecol 89:876–887
Mukhopadhyay SK, Biswas H, De TK, Sen BK, Sen S, Jana TK (2002) Impact of Sundarban mangrove biosphere on the carbon dioxide and methane mixing ratios at the NE Coast of Bay of Bengal, India. Atmos Environ 36:629–638 Okimoto Y, Nose A, Katsuta Y, Tateda Y, Agarie S, Ikeda K
(2007) Gas exchange analysis for estimating net CO2
fixa-tion capacity of mangrove (Rhizophora stylosa) forest in the mouth of river Fukido, Ishigaki Island, Japan. Plant Prod Sci 10:303–313
Parsons TR, Maita Y, Lalli CM (1984) A manual of chemical and biological methods for seawater analysis, Pergamon Press, Oxford
Pinder AW, Smits AW (1993) The burrow microhabitat of the land crab Cardisoma guanhumi: respiratory ionic condi-tions and physiological responses of crabs to hypercapnia. Physiol Zool 66:216–236
Purnobasuki H, Suzuki M (2004) Aerenchyma formation and porosity in root of a mangrove plant, Sonneratia alba (Lythraceae). J Plant Res 117:465–472
Purnobasuki H, Suzuki M (2005) Aerenchyma tissue develop-ment and gas-pathway structure in root of Avicennia marina (Forsk.) Vierh. J Plant Res 118:285–294
Purvaja R, Ramesh R (2001) Natural and anthropogenic methane emission from coastal wetlands of South India. Environ Manage 27:547–557
Purvaja R, Ramesh R, Frenzel P (2004) Plant-mediated methane emission from an Indian mangrove. Glob Change Biol 10:1825–1834
Ramesh R, Purvaja R, Neetha V, Divia J, Barnes J, Upstill-Goddard RC (2007) CO2 and CH4emissions from Indian
mangroves and its surrounding waters. In: Tateda Y,
Upstill-Goddard R, Goreau T, Alongi D, Nose A, Kris-tensen E, Wattayakorn G (eds) Greenhouse gas and car-bon balances in mangrove coastal ecosystems. Gendai Tosho, Kanagawa, p 139–151
Raymond PA, Cole JJ (2001) Gas exchange in rivers and estu-aries: choosing a gas transfer velocity. Estuaries 24: 312–317
Reeburgh WS (2007) Oceanic methane biogeochemistry. Chem Rev 107:486–513
Ridd PV (1996) Flow through animal burrows in mangrove creeks. Estuar Coast Shelf Sci 43:617–625
Scholander PF, van Dam L, Scholander SI (1955) Gas ex-change in the roots of mangrove. Am J Bot 42:92–98 Skelton NJ, Allaway WG (1996) Oxygen and pressure
changes measured in situ during flooding in roots of the Grey Mangrove Avicennia marina (Forssk.) Vierh. Aquat Bot 54:165–175
Skov MW, Vannini M, Shunula PJ, Hartnoll GR (2002) Quan-tifying the density of mangrove crabs: Ocypodidae and Grapsidae. Mar Biol 141:725–732
Sokal RR, Rohlf FJ (1981) Biometry: the principles and prac-tices in biological research, 2nd edn. WH Freeman and Company, San Francisco, CA
Sotomayor D, Corredor JE, Morell JM (1994) Methane flux from mangrove sediments along the southwestern coast of Puerto Rico. Estuaries 17:140–147
Stutes J, Cebrian J, Stutes AL, Hunter A, Corcoran AA (2007) Benthic metabolism across a gradient of anthropogenic impact in three shallow coastal lagoons in NW Florida. Mar Ecol Prog Ser 348:55–70
Susilo A, Ridd PV, Thomas S (2005) Comparison between tidally driven groundwater flow and flushing of animal burrows in tropical mangrove swamps. Wetlands Ecol Manag 13:377–388
Tateda Y, Upstill-Goddard R, Goreau T, Alongi D, Nose A, Kristensen E, Wattayakorn G (2007) Greenhouse gas and carbon balances in mangrove coastal ecosystems. Gendai Tosho, Kanagawa
Upstill-Goddard RC, Barnes J, Ramesh R (2007) Are man-groves a source or a sink for greenhouse gases? In: Tateda Y, Upstill-Goddard R, Goreau T, Alongi D, Nose A, Kris-tensen E, Wattayakorn G (eds) Greenhouse gas and car-bon balances in mangrove coastal ecosystems. Gendai Tosho, Kanagawa, p 127–138
Welch BL (1947) The generalization of ‘student’s’ problem when several different population variances are involved. Biometrika 34:28–35
Yamamoto S, Alcauskas JB, Crozier TE (1976) Solubility of methane in distilled water and seawater. J Chem Eng Data 21:78–80
Editorial responsibility: Just Cebrian, Dauphin Island, Alabama, USA
Submitted: January 22, 2008; Accepted: July 5, 2008 Proofs received from author(s): October 13, 2008