Influence of Capillary Barrier Effect on Biogas Distribution at the Base of Passive 1
Methane Oxidation Biosystems: Parametric Study 2
3
Bahar Ahoughalandari a and Alexandre R. Cabral a,*
4 5
a Geoenvironmental Group, Department of Civil Engineering, University of Sherbrooke,
6
Sherbrooke, Quebec, Canada J1K 2R1. 7
*Corresponding author: Tel.: +1 819 821-7906. Postal address: 2500, boul. de l’Université, 8
Sherbrooke, Quebec, Canada J1K 2R1. 9
E-mail addresses: [email protected] (A. R. Cabral); 10
[email protected] (B. Ahoughalandari) 11
Abstract
13The efficiency of methane oxidation in passive methane oxidation biosystems (PMOBs) is 14
influenced by, among other things, the intensity and distribution of the CH4 loading at the
15
base of the methane oxidation layer (MOL). Both the intensity and distribution are affected 16
by the capillary barrier that results from the superposition of the two materials constituting 17
the PMOB, namely the MOL and the gas distribution layer (GDL). The effect of capillary 18
barriers on the unsaturated flow of water has been well documented in the literature. 19
However, its effect on gas flow through PMOBs is still poorly documented. In this study, sets 20
of numerical simulations were performed to evaluate the effect of unsaturated hydraulic 21
characteristics of the MOL material on the value and distribution of moisture and hence, the 22
ease and uniformity in the distribution of the upward flow of biogas along the GDL-MOL 23
interface. The unsaturated hydraulic parameters of the materials used to construct the 24
experimental field plot at the St-Nicephore landfill (Quebec, Canada) were adopted to build 25
the reference simulation of the parametric study. The behavior of the upward flow of biogas 26
for this particular material was analyzed based on its gas intrinsic permeability function, 27
which was obtained in the laboratory. The parameters that most influenced the distribution 28
and the ease of biogas flow at the base of the MOL were the saturated hydraulic conductivity 29
and pore size distribution of the MOL material, whose effects were intensified as the slope of 30
the interface increased. The effect of initial dry density was also assessed herein. Selection of 31
the MOL material must be made bearing in mind that these three parameters are key in the 32
effort to prevent unwanted restriction in the upward flow of biogas, which may result in the 33
redirection of biogas towards the top of the slope, leading to high CH4 fluxes (hotspots). In a
34
well-designed PMOB, upward flow of biogas across the GDL-MOL interface is unrestricted 35
and moisture distribution is uniform. This paper tries to show how to obtain this. 36
Keywords: Landfill final covers; Passive methane oxidation; Biogas flow behavior; Capillary 38
barrier effect; Numerical simulation 39
40
Glossary
41PMOB: passive methane oxidation biosystems 42
MOL: methane oxidation layer 43
GDL: gas distribution layer 44
LUGM: length of unrestricted gas migration 45
θw: volumetric water content
46
∆θw: difference between maximum and minimum values of volumetric water content along
47
the interface 48
θa: volumetric air content
49
θa-occ: occlusion value
50
θa-pocc: pre-occlusion value
51
θw-occ: volumetric water content associated with occlusion value
52
θw-pocc: volumetric water content associated with pre-occlusion value
53
θw-max: maximum value of volumetric water content along the interface
54
a: curve fitting parameter for the van Genuchten (1980) model
55
n: curve fitting parameter for the van Genuchten (1980) model
56
ksat-MOL: saturated hydraulic conductivity of methane oxidation layer material 57
58 59 60
1.
Introduction
61A capillary barrier is formed when water flows through two superimposed soil layers with 62
contrasting unsaturated hydraulic properties. Capillary forces associated with this contrast 63
create a capillary block along the interface, which limits vertical percolation of water through 64
the interface and reduces gas fluxes, and in the case of inclined capillary barriers, may 65
laterally drain the meteoric seepage. 66
Capillary barriers are often incorporated into the design of final covers for landfills, 67
acid-generating mine tailings and waste-rock dumps. In the case of landfills, the design of the 68
final cover must consider maximum seepage rates imposed by legislation to control the 69
infiltration, therefore leachate generation (e.g. Aubertin et al. 2006; Bussière et al. 2003a; 70
Khire et al. 2000; Stormont 1996; Vachon et al. 2015). In the case of mine residues, the goal 71
is to prevent the influx of atmospheric oxygen, thereby preventing the generation of acid 72
mine drainage (Adu-Wusu and Yanful 2006; Bussière et al. 2003b; Dagenais et al. 2005; 73
Williams et al. 1997; Wilson et al. 1995; Yanful 1993). 74
Recently, passive methane oxidation biosystems (PMOBs) have been promoted as a means of 75
reducing fugitive CH4 emissions (emissions not captured by gas collection systems) from
76
landfills. PMOBs are of particular importance during the aftercare phase, i.e. following the 77
shutdown of active gas collection (e.g. Cabral et al. 2010b; Huber-Humer et al. 2009; 78
Roncato and Cabral 2012; Sadasivam and Reddy 2014). 79
PMOBs are engineered systems installed at the top-most part of the final cover and consist of 80
two main layers: the methane oxidation layer (MOL), localized near the surface and where 81
most CH4 is oxidized into CO2 (using atmospheric O2) by methanotrophic bacteria, and the
82
underlying gas distribution layer (GDL), which intercepts fugitive emissions. The methane 83
oxidation efficiency of PMOBs depends on several parameters, including the CH4 loading at
the base of the PMOB (Cabral et al. 2010b; Fredenslund et al. 2010; Gebert et al. 2011; 85
Ndanga et al. 2015; Pokhrel et al. 2011; Rachor et al. 2011; Scheutz et al. 2011). The lower 86
the CH4 loading, the more the methanotrophs will be capable of oxidizing the upward flow of
87
biogas intercepted by the gas distribution layer. To reduce the loading, this upward flow has 88
to be distributed over the widest surface possible. 89
The contrast in unsaturated hydraulic behavior between the materials of the methane 90
oxidation layer and the gas distribution layer results in capillary barrier formation along the 91
interface (AhouGhalandari et al. 2015; Tétreault et al. 2013). As a result, the methane 92
oxidation layer retains water and, therefore, its degree of saturation increases where the 93
capillary block occurs, i.e. along the GDL-MOL interface. In an inclined interface, the 94
retained water seeps both laterally and vertically, causing an increase in the degree of 95
saturation towards the bottom of the slope. The ensuing effects of the degree of saturation on 96
occlusion of air-filled pores and gas flow has been the object of several studies dealing with 97
unsaturated flow through porous media (e.g. Jucá and Maciel 2006; Langfelder et al. 1968; 98
Maciel and Jucá 2000; Marinho et al. 2001). Beyond a certain point along the sloping 99
interface, the increase in the degree of saturation may lead to occlusion of air-filled pores, 100
and therefore restrict the upward flow of biogas. As a consequence, biogas diverts toward the 101
regions of the biosystem with lower degrees of saturation located upstream (Tétreault et al. 102
2013). This may in turn create a hotspot, i.e. a localized region where surface CH4
103
concentrations are higher than acceptable by legislation and where methane oxidation is 104
much lower (Bohn and Jager 2009; Cabral et al. 2010a; Röwer et al. 2012). 105
It stems from the preceding that an efficient PMOB design would be associated with the 106
longest possible length along the GDL-MOL interface where upward gas migration is 107
unrestricted. This length is herein denominated length of unrestricted gas migration 108
(LUGM). 109
Bohn and Jager (2009) observed the persistent presence of a hotspot upslope a large-scale 110
experimental PMOB constructed in Germany, with a slope of 1V:10H. Similarly, the surface 111
emission measurements performed by Röwer et al. (2012) and Geck et al. (2012) showed 112
upslope hotspots in an experimental PMOB with a slope of 1V:5H, constructed in the 113
Netherlands. Both PMOBs were composed of a two-material recultivation layer (protection 114
and vegetation layers) as the methane oxidation layer, and a two-layer capillary barrier that 115
was constructed to control infiltration, but that also acted as the gas distribution layer. 116
Conducting a series of steady-state numerical simulations on these two PMOBs, Tétreault et 117
al. (2013) concluded that biogas could flow unrestricted through the gas distribution layers, 118
where the degrees of saturation were low, but pore occlusion likely occurred at the 119
GDL-MOL interfaces. Hotspots upstream of the PMOBs most probably resulted from pore 120
occlusion. Kjeldsen et al. (2013) constructed an experimental PMOB with a jagged 121
GDL-MOL interface with the intention of limiting potential pore occlusion (resulting from 122
accumulation of moisture along the interface) to the lower parts of each segment. Moisture 123
along the interface in the upper part of each segment would be low enough, thereby allowing 124
the CH4 loading to seep freely into the methane oxidation layer.
125
This very ingenious idea put forth by Kjeldsen et al. (2013) needs to be further developed, in 126
order to incorporate proper design steps and parameters. Indeed, there seems to be a need for 127
more rigorous numerical studies on gas flow behavior through PMOBs that includes 128
consideration of the capillary barrier effect and the importance of uniformity of biogas 129
distribution and the ease of upward biogas flow. Such studies would provide tools for 130
selecting materials for the methane oxidation and gas distribution layers with appropriate 131
geotechnical and hydraulic characteristics and geometrical parameters of PMOBs. 132
The focus of this study was to evaluate how the distribution of biogas along the interface of 133
an inclined PMOB was affected by the slope of the PMOB, and by some of the basic 134
unsaturated hydraulic parameters of MOL material. A parametric study was conducted using 135
data from an experimental PMOB constructed at the St-Nicephore landfill as a starting point 136
(or Reference simulation). Several years of monitoring this PMOB have shown it to be a 137
highly efficient PMOB, capable of oxidizing very high CH4 loads (Capanema and Cabral
138
2012; Roncato and Cabral 2012). 139
Transient state numerical simulations were performed using the commercial program 140
SEEP/W (2010). As previously mentioned, the main variables in these simulations included 141
the slope of the GDL-MOL interface and the unsaturated hydraulic properties of the MOL 142
material, i.e. the water retention curve and saturated hydraulic conductivity. The simulations 143
made it possible to evaluate the effect of each variable on the distribution of moisture along 144
the GDL-MOL interface and the magnitude of LUGM. 145
The tools proposed herein are another necessary step in the development of PMOB design. 146
The study is innovative insofar as it brings the hydraulic aspects and unsaturated flow to the 147
forefront of PMOB design, which have not yet received the attention they deserve. The main 148
limitations of the study are two-fold. The first is related to the lack of consideration of 149
evapotranspiration in the numerical simulations, and, indirectly, to the importance of plant 150
roots or vegetation in moisture release or retention. This limitation was circumvented by 151
considering that a reasonable percentage of the total precipitation actually seeped through the 152
cover and reached the GDL-MOL interface. The second limitation relates to the lack of 153
consideration of water generation during biotic activities in the numerical simulations 154
presented herein. This would most certainly be an important addition to a proper design. 155
156
2.
Materials and methods
1572.1. Site configuration 158
The experimental PMOB numerically analyzed in this study is one of the three PMOBs 159
constructed within the existing final cover of the St-Nicephore landfill, Quebec, Canada to 160
evaluate the methane oxidation efficiency of the designs under field conditions (Capanema 161
and Cabral 2012; Roncato and Cabral 2012). This PMOB, referred to in the literature as 162
PMOB2, measured 2.75 m (W) × 9.75 m (L) with a slope of 3.5%. A drainage system was 163
installed at the lowest point to evacuate percolated water. It consisted of an 80-cm-thick 164
methane oxidation layer containing a mixture of five volumes of compost and one volume of 165
coarse sand. The main characteristics of the sand-compost mixture were the following: 166
specific gravity (Gs) = 2.24, Sr-opt (degree of saturation at line of optima) = 90%, ρd-insitu (in
167
situ dry density) = 750 kg/m3, in situ porosity equal to 0.665 and in situ gravimetric water
168
content on the day of field measurements (w%) = 47% (taken at mid-depth and mid-length of 169
the MOL). These values were used as initial conditions in numerical simulations. The MOL 170
material of PMOB2 (experimental field plot at the St-Nicephore landfill) is denominated 171
herein as Reference MOL. The 40-cm-thick gas distribution layer was constructed using 172
12.7-mm clean gravel, which was placed under the methane oxidation layer. 173
174
2.2. Hydraulic properties of the materials 175
The drying water retention curve of the Reference MOL was determined using the HYPROP 176
apparatus (HYPROP-UMS 2013), at in situ initial dry density and water content 177
(AhouGhalandari et al. 2015). For the gas distribution layer, the water retention curve was 178
estimated using the Fredlund et al. model (Fredlund et al. 2002), derived from the grain size 179
distribution curve of the material. In the present study, the effect of hysteresis of the water 180
retention curve was not considered and only the drying curve was used. Saturated hydraulic 181
conductivity (ksat) of the Reference MOL was equal to 9×10⁻⁶ m/s, which was measured
according to ASTM D2434-68 (ASTM-D2434-68 2006) at in situ initial dry density and 183
water content. The ksat of the gas distribution layer material was calculated using the Chapuis 184
equation (2004). 185
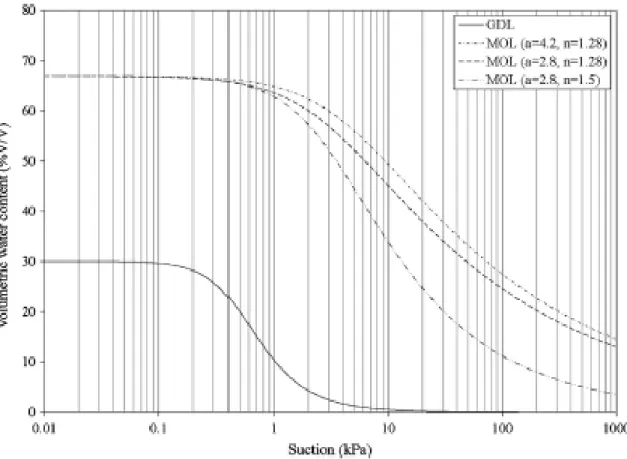
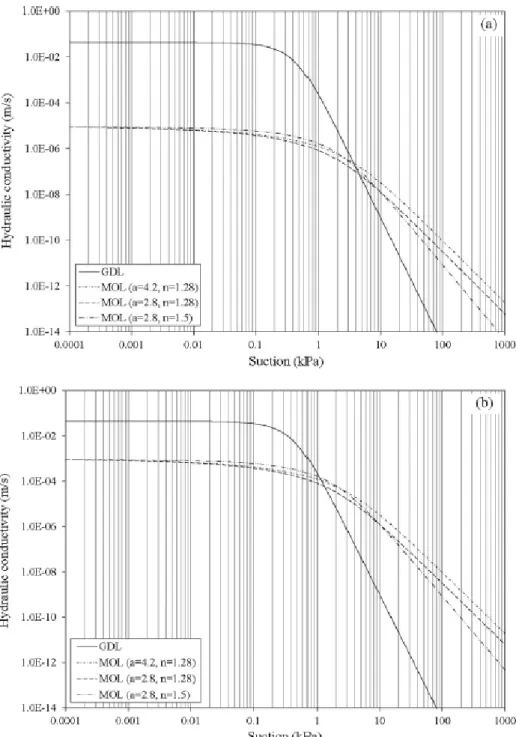
The van Genuchten model (1980) was used to fit the water retention curve (Equation 1), 186
whereas hydraulic conductivity functions were obtained using the van Genuchten model 187
(1980), based on the Mualem formulation (1976) (Equation 2). The water retention curve and 188
hydraulic conductivity functions obtained were then used during the simulations using 189
SEEP/W (Figure 1 and Figure 2). 190 191 m n r s r a θ θ θ + − + = ψ 1 θw (1) 192
(
) ( )
(
)
[
]
(
)
(
)
+ + − = − − 2 2 1) ( w ψ 1 ψ 1 ψ 1 k m n m n n sat a a a k (2) 193 194where kw is the hydraulic conductivity, θw is volumetric water content, θs is saturated
195
volumetric water content, θr is residual volumetric water content, ψ is suction, a is related to
196
the inverse of the air entry value, n represents the rate of the desaturation in the water 197
retention curve, and m depends on n. 198
In order to perform this study, the parameters defining the water retention curve and 199
hydraulic conductivity functions of the Reference MOL and the slope of the interface were set 200
to vary over a range of values that kept the transformed material within the approximate 201
geotechnical category of the Reference MOL. The parameters describing the water retention 202
curve and hydraulic conductivity functions of the gas distribution layer remained constant for 203
all simulations. Table 1 presents the parameters considered in the numerical simulations. The 204
corresponding water retention curves and hydraulic conductivity functions are shown in 205
Figure 1 and Figure 2, respectively. 206
207
Table 1: Hydraulic properties of the materials used in the numerical simulations 208
209
Figure 1: Water retention curves of the materials used in the parametric analysis 210
211
Figure 2: Hydraulic conductivity functions of the materials used in the parametric analysis; 212
(a) ksat-MOL = 9×10⁻⁶ m/s, and (b) ksat-MOL = 9×10⁻⁴ m/s
213 214
2.3. Gas flow properties of the methane oxidation layer material 215
Performing a series of air permeability tests, using a soap flow meter (Bubble-O-Meter; 216
1-10-500 ml) connected to the inlet of a triaxial cell, the gas intrinsic permeability (K) of the 217
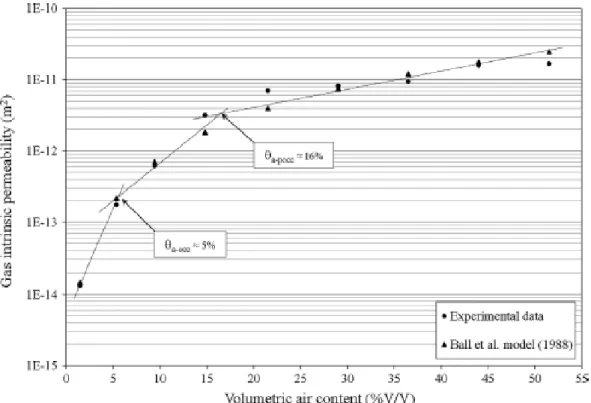
sand-compost mixture used to build the methane oxidation layer of PMOB2 was measured at 218
several initial water content and dry density values (ρd). Figure 3 shows the test results as K
219
value at each volumetric air content (θa). In order to incorporate the gas flow behavior of the
220
MOL material in the results of numerical simulations, the Ball et al. model (1988) was 221
adopted as the fitting curve for K-θa plot, which was consistent with the experimental data
222
(Figure 3). 223
224
Figure 3: Gas intrinsic permeability function of the MOL material for numerical simulations 225
with ksat-MOL = 9×10⁻⁶ m/s
226 227
As shown in Figure 3, the curve can be subdivided into three regions whose frontiers are θa ≈
228
5% and θa ≈ 16%, herein defined as occlusion value (θa-occ) and pre-occlusion value (θa-pocc),
229
respectively. The value of K is equal to 3.1×10⁻¹² (m2) at θa-pocc and 1.9×10⁻¹³ (m2) at θa-occ. If
230
the dry density increases, the water content must be decreased in order to maintain θa
231
constant. Regardless, the value of K is not very affected by the dry density if the volumetric 232
air content, θa, remains constant. The values of θa-pocc, θa-occ and corresponding K values
233
derived from data presented in Figure 3, can be used for any given pair of initial dry density 234
and water content values in the Reference MOL. 235
For design purposes, it is hypothesized that biogas flow would be considered reasonably 236
unrestricted when volumetric air content, θa, is greater than the pre-occlusion value, θa-pocc.
237
Therefore, a practical definition of the length of unrestricted gas migration, LUGM, for this 238
sloped PMOB, would be the length, taken horizontally, from the top of the slope to the point 239
where θa becomes equal to θa-pocc. Beyond this point, gas flow becomes partially restricted
240
and, when it reaches a value of θa ≈ θa-occ, it is considered blocked. It is reasonable to
241
consider that biogas would prefer to migrate laterally - and find easier escape points – rather 242
than try to flow through a partially restricted area (where θa ≈ θa-pocc). Changes in dry density
243
(and therefore in porosity) due to settlement or swelling were not considered in the present 244
study. 245
During numerical simulations, the parameter that was actually monitored was the volumetric 246
water content, θw, not the volumetric air content, θa. Knowing the initial dry density and
247
porosity of the MOL material, one can calculate θw-pocc (θw associated with θa-pocc) and θw-occ
248
(θw associated with θa-occ). The θw values obtained from the numerical simulations were then
249
compared with θw-pocc and θw-occ.
250
For simulations No. 1 and No. 7 (Table 1), whose porosities are equal to 0.665, θw associated
251
with θa-pocc (θw-pocc) is equal to 50.5% and θw associated with θa-occ (θw-occ) is equal to 61.5%.
252
The van Genuchten parameters that define the water retention curve of the MOL material in 253
simulations No. 3 and No. 9, a = 4.2 and n = 1.28, are associated with the Reference MOL 254
compacted to ρd = 0.930 kg/m3 (the porosity was equal to 0.584) (AhouGhalandari et al.
255
2015). Although the value of ksat-MOL may change due to compaction, for the case with ρd =
256
0.930 kg/m3, it remained within the same magnitude as that of the Reference MOL (data not
257
presented). Therefore, it seems reasonable to use θa-pocc and θa-occ shown in Figure 3 for
258
simulations No. 3 and No. 9, where ksat-MOL = 9×10⁻⁶ m/s, a = 4.2 and n = 1.28. For these
259
simulations, θw-pocc and θw-occ are equal to 42.4% and 53.4%, respectively. Since the
260
porosities associated with all other simulations in Table 1 are unknown, θw-occ and θw-pocc
261
cannot be calculated for these simulations and, therefore, LUGM cannot be determined. For 262
these cases, only the influence of variables a, n and ksat-MOL on the distribution of θw along the
263
GDL-MOL interface was evaluated. 264
265
2.4. Numerical simulations 266
As previously mentioned, for the purpose of this study, the finite element software SEEP/W 267
(Geo-Slope 2010) was adopted. SEEP/W can mathematically simulate the real physical 268
process of water flowing through a particulate medium. 269
The simulation using the Reference MOL is herein denominated Reference simulation 270
(simulation No. 1 in Table 1). For all simulations, the thickness of the methane oxidation 271
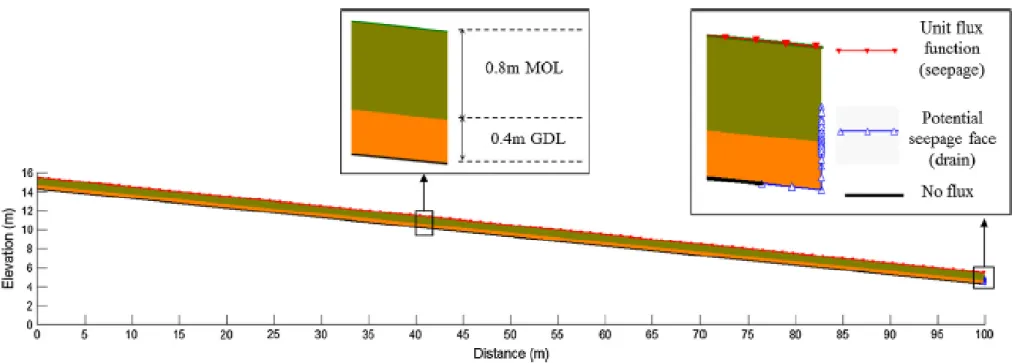
layer is 80 cm and the thickness of the gas distribution layer is 40 cm. Figure 4 shows the 272
dimensions, meshing and boundary conditions adopted for the simulations. In order to avoid 273
boundary effects, the length of PMOB in all simulations was considered equal to 100 m. The 274
finite element mesh contained 10,000 elements. The mesh density was higher near the 275
GDL-MOL interface. 276
Two types of boundary conditions were considered for the simulations: 1) unit flux function 277
to assign the seepage reaching the top of the methane oxidation layer, and 2) zero total flux 278
boundary condition with potential seepage face review at the toe of the simulations in both 279
layers (Figure 4) to represent the drainage system. Water can seep freely across the 280
GDL-MOL interface. Once it has entered the gas distribution layer, it may seep laterally to 281
the toe of the system or move downwards, but it has to be drained out and is no longer of 282
interest, as far as biogas movement across the GDL-MOL is concerned. In the simulations 283
presented herein, the bottom of the model (no flux boundary) coincided with the bottom of 284
the gas distribution layer and water was drained out of the model by means of the two 285
seepage face boundaries shown in Figure 4. 286
The transient state analysis lasted 246 days. The initial volumetric water content, θw, at points
287
located 1 cm above the GDL-MOL interface (herein denominated “interface points”) were set 288
equal to 35% for all simulations. Water balance components based on climatic data of 289
September 2006 to August 2007 in Quebec (Cabral et al. 2010a) show that the average annual 290
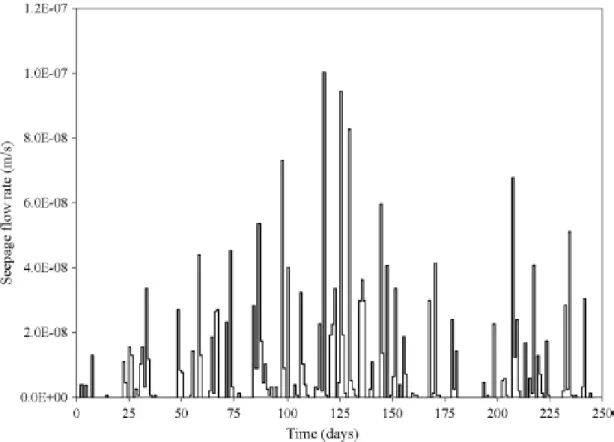
amount of water that seeps into the landfill is equal to 22% of precipitation. Since SEEP/W 291
does not include a soil-atmosphere interaction module (evapotranspiration), the daily seepage 292
rate into the PMOB is therefore considered as 22% of the daily rate of precipitation from 293
March to November 2009 (Figure 5). 294
295
Figure 4: Dimensions and boundary conditions of the SEEP/W simulations (slope is variable) 296
297
Figure 5: The daily rate of seepage into the PMOB2 during 246 days 298
299
3.
Results
300Data presented in all the figures were obtained from interface points. The nodes located in the 301
first and last 5 meters of the modelled passive methane oxidation biosystems (PMOBs) were 302
not considered in the analyses, in order to avoid potential boundary effects. 303
304
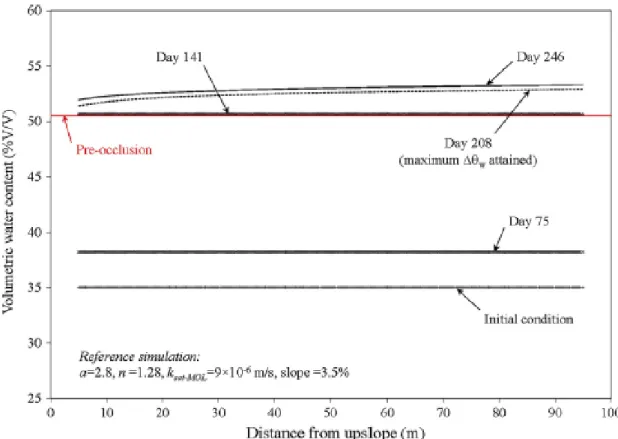
3.1. Reference simulation 305
Figure 6 shows volumetric water content (θw) values of the interface points at several time
306
steps during the Reference simulation, which lasted 246 days. The initial θw = 35.0% is
307
associated with a degree of saturation equal to 53% and gravimetric water content equal to 308
47%, which means compaction on the dry side of the line of optima, i.e. at water contents 309
lower than those given by the optimum water contents of each individual compaction curve. 310
θw increased towards the bottom of the slope, but the difference in θw values from the top to
311
bottom were quite small. The difference between maximum and minimum values of θw along
312
the interface, referred to as ∆θw, increased with time. This parameter gives an idea of the
313
level of uniformity of θw along the interface; the higher it is, the greater the chance of a
314
non-uniform interface, as far as moisture distribution is concerned. The opposite is rather 315
straightforward: the lower ∆θw is, the greater the chance of uniformity in distribution of
316
moisture. 317
During the simulation period, the maximum ∆θw (1.5%) occurred on Day 208, when θw of the
318
interface points had already reached the volumetric water content associated with
pre-319
occlusion value, θw-pocc. In other words, upward gas migration was already partially restricted.
320
Prior to the onset of θw-pocc, which was equal to 50.5% and occurred on Day 141, the
321
maximum value of ∆θw was equal to 8.8×10⁻³ %. This very small value leads to the
322
conclusion that the interface had become uniform, as far as volumetric water content was 323
concerned. Therefore, once the θw-pocc was attained, the length of unrestricted gas migration,
324
LUGM, abruptly became equal to zero. 325
During the last 105 days of the Reference simulation, θw > θw-pocc, meaning that upward
326
biogas flow was restricted along the interface. Biogas would therefore migrate within the gas 327
distribution layer towards the top of the slope or escape through preferential pathways, such 328
as cracks on the final cover. The CH4 in the biogas transported through these preferential
329
flow paths would less likely be submitted to biotic oxidation (Chanton et al. 2011). 330
The maximum value of θw (θw-max) was equal to 53.3%, which was lower than θw-occ (61.5%)
331
but greater than θw-pocc (50.5%). Therefore, despite the fact that the pores at the interface of
332
the Reference simulation never became completely occluded (θw > θw-occ), it is recommended
333
to use a conservative approach and consider gas migration to be restricted when θw > θw-pocc.
334
Before attainment of θw-max, the value of θw at the interface points increased continuously,
335
independent of the transient seepage rate. After that, θw fluctuated depending on the seepage
336
rate. 337
338
Figure 6: Distribution of θw in interface points at several time steps in simulation No. 1
339
(Reference simulation) 340
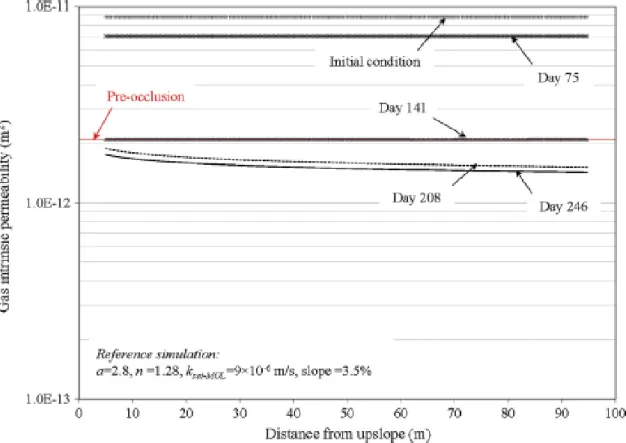
341
Figure 7 presents the K values of the interface points, at several time steps during the 342
Reference simulation. K decreased continuously with time and, on Day 141, all K values of
343
the interface points fell below the pre-occlusion value, i.e. K = 2.1×10⁻¹² m2. The lowest
344
value of K during the simulation period was 1.4×10⁻¹² m2.
345
Before pre-occlusion, the maximum value of Kmax/Kmin occurred on Day 129 and was equal to 346
1.0007. In other words, there was very little variability in K along the interface up to this 347
time. This is expected, given the small variation in moisture content along the interface. 348
During the analysis, the maximum value of Kmax/Kmin was equal to 1.25, and occurred on Day 349
208. 350
351
Figure 7: Distribution of K in interface points at several time steps, for simulation No. 1 352
353
3.2. Effect of the pore size distribution
354
The parameter n in the Van Genuchten (1980) equation represents the rate of desaturation of 355
the soil. The greater the value of n, the steeper the slope of the water retention curve, and the 356
easier to drain (desaturate) the soil (Fredlund et al. 2002). Since the shape of the grain size 357
distribution curve is similar to the shape of the water retention curve, the former is often used 358
to estimate the latter (e.g. Arya and Paris 1981; Fredlund et al. 2002). In practical terms, the 359
steeper the grain size distribution curve, the steeper the slope of the desaturation zone of the 360
water retention curve. 361
362
Figure 8: Distribution of θw in interface points at several time steps, for simulation No. 2
363 364
For simulation No. 2, the value of the van Genuchten parameter n of the Reference MOL was 365
increased to 1.5, while the values of a, ksat-MOL and initial θw remained constant. The variation
366
of θw with distance is presented in Figure 8. In this case, in order to evaluate whether or not
367
there was pre-occlusion, a value of θw-pocc had to be adopted, since it was not obtained in the
368
laboratory for this simulated methane oxidation layer. For simulations No. 2 and No. 8 the 369
same θw-pocc value of the Reference MOL was adopted.
370
The results of the simulation showed that the maximum ∆θw occurred on Day 210 and an
371
increase in n led to a reduction in the value of θw and therefore, to an unrestricted gas flow
372
across the interface. Indeed, θw-max attained 47.0%, which is lower than θw-pocc. However, the
373
validity of these results relies on the presupposition that it was reasonable to adopt the same 374
θw-pocc value as that of the Reference MOL. This hypothesis was verified as discussed in the
375
remainder of this section. 376
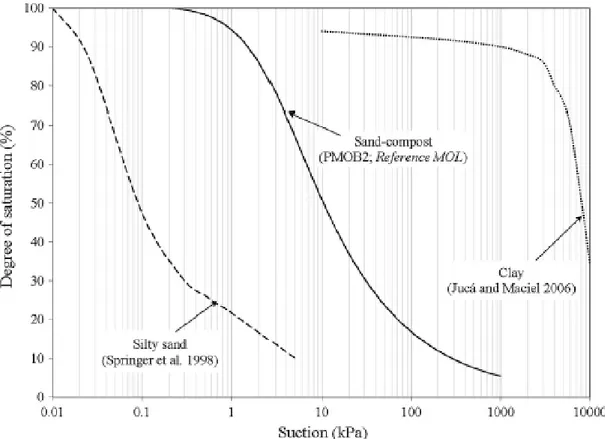
In Figure 9, the water retention curve of the Reference MOL is compared with the water 377
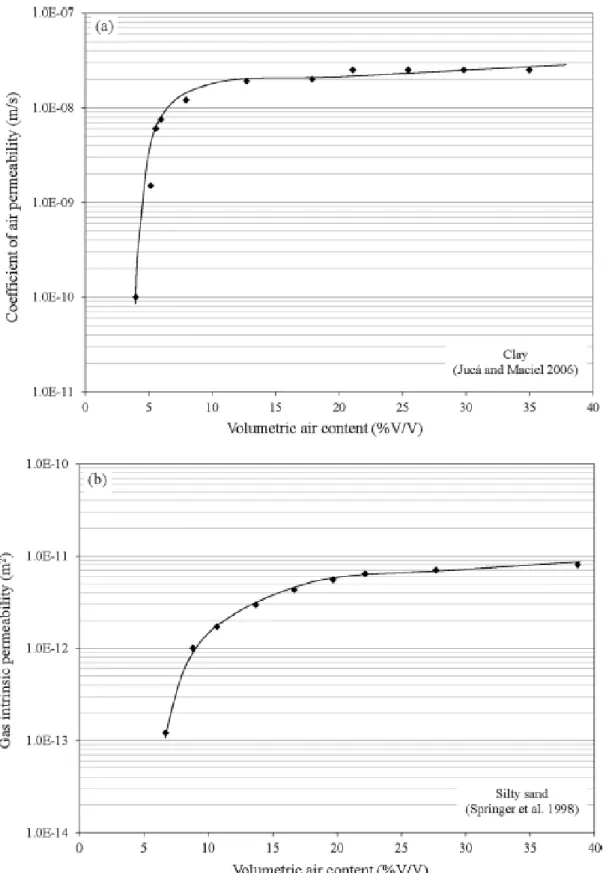
retention curve of two other materials from other studies. As shown in Figure 10 (also see 378
Figure 3 for the Reference MOL), the shapes of gas permeability functions of these materials 379
are similar, insofar as the occurrence of pre-occlusion can be clearly identified. In the case of 380
the clay, the volumetric air content at pre-occlusion, θa-pocc, was equal to ~12% (Figure 10a),
381
whereas for the silty sand it was ~17% (Figure 10b) (θa-pocc ≈ 16 % for the Reference MOL).
According to Figure 9, the steepest slope of the desaturation zone was associated with the 383
clay studied by Jucá and Maciel (2006), followed by the silty sand tested by Springer et al. 384
(1998), and the sand-compost mixture of the Reference MOL. Therefore, the clay possessed 385
the greatest value of n. The results presented in Figure 9 and Figure 10 showed that materials 386
with different textures and desaturation slopes (as expressed by n) may exhibit rather similar 387
values of θa-pocc. Based on this limited analysis, it was assumed that changing the value of n
388
from 1.28 (adopted for the Reference MOL) to 1.5 would not lead to much of a difference in 389
θa-pocc.
390 391
Figure 9: The water retention curve of the Reference MOL and materials from other studies 392
(Jucá and Maciel 2006; Springer et al. 1998) 393
394
Figure 10: variation of (a) coefficient of air permeability and (b) gas intrinsic permeability 395
with θa in materials from other studies (Jucá and Maciel 2006; Springer et al. 1998)
396 397
In Figure 11, two grain size distribution curves were derived from the water retention curves: 398
one for the Reference MOL (a = 2.8 and n =1.28) and the other for the modified Reference 399
MOL (a = 2.8 and n = 1.5). In order to obtain the material with n = 1.5, the amount of
400
compost whose particles have a diameter less than 0.4 mm had to be artificially decreased 401
and substituted by a granular soil, such as sand. It is as if there was more sand in the mixture. 402
Such substitution entails a slight change in specific gravity and saturated volumetric water 403
content (θs, which is equal to porosity). Since the initial dry density, θa-pocc and the porosity of
404
the material remained similar, θw-pocc remained almost unaltered. Consequently, increasing n
to 1.5 resulted in only a slight change in θw-pocc, the control parameter based on which the
406
results of the simulations were analyzed. 407
408
Figure 11: Corresponding grain size distribution curves of the water retention curves of the 409
MOL materials for two cases (a=2.8 and n=1.28; a=2.8 and n=1.5), using the Fredlund et al. 410
equation (2002) 411
412
3.3. Effect of initial dry density
413
The effect of compaction on the value of gas permeability has been the subject of several 414
studies both in soil mechanics (e.g. Leroueil and Hight 2013; Tang et al. 2011) and dealing 415
with methane oxidation efficiency of passive methane oxidation biosystems (e.g. Gebert et al. 416
2011; Rachor et al. 2011). It can be expected that an increase in dry density results in a 417
higher air entry value, therefore greater values of a, while the slope of the desaturation zone 418
of the water retention curve (n) remains unchanged (Mirzaii and Yasrobi 2012; Nuth and 419
Laloui 2008). The same behavior was observed in the material constituting the Reference 420
MOL (AhouGhalandari et al. 2015). Therefore, the results obtained from simulations where
421
the value of a was increased from 2.8 to 4.2, are expected to incorporate the effect of a higher 422
initial dry density of the methane oxidation layer on the distribution of θw values along the
423
GDL-MOL interface. 424
425
Figure 12: Distribution of θw in interface points at several time steps, for simulation No. 3
426 427
Figure 12 shows the results of simulation No. 3, for which the initial θw was equal to 35.0%.
428
The initial θw corresponds to the degree of saturation equal to 60% and gravimetric water
429
content equal to 38%, indicating that the material was compacted dry of optima. As a result 430
of increasing the initial dry density of the MOL material, θw at the interface points exceeded
431
both θw-pocc (42.7%) and θw-occ (53.4%) on Days 64 and 132, respectively. It is noteworthy to
432
recall that θw-occ was not attained during the Reference simulation. Prior to the onset of
433
pre-occlusion, the maximum ∆θw was equal to 0.0049%; by all means a nearly negligible
434
difference in moisture content between the top and bottom of the slope. Therefore, the value 435
of LUGM abruptly became equal to zero when θw-pocc was attained. The maximum ∆θw
436 occurred on Day 207. 437 438 3.4. Effect of ksat-MOL 439
Figure 13 shows θw values at the interface points for several time steps of simulations No. 4
440
to No. 6. For these simulations, the ksat-MOL was 9×10⁻⁴ m/s, i.e. 100 times greater than the
441
ksat-MOL of the Reference MOL. Since the materials corresponding to simulations No. 4 to No. 442
6 were not characterized, the values of θw-pocc and θw-occ are unknown. Consequently, it was
443
not possible to clearly evaluate whether or not the interface points ever reached pre-occlusion 444
or occlusion. 445
The results in Figure 13 show that, at each time step, the increase in ksat-MOL led to greater 446
variations in θw along the interface, towards the bottom of the slope. In other words, ∆θw for
447
these simulations were greater than those obtained with the corresponding simulations with 448
ksat-MOL = 9×10⁻⁶ m/s, i.e. Reference simulation and simulations No. 2 and No. 3. The
449
maximum values of ∆θw during simulations No. 4 to No. 6 occurred on Day 207. The
450
evolution of θw with time in simulations No. 4 to No. 6 was consistent with the variation in
seepage rate with time (Figure 5); a clear indication of the sensitivity of the modeled system 452
to the seepage rate, due to the value of ksat-MOL. 453
454
Figure 13: Distribution of θw in interface points at several time steps, for (a) simulation No.
455
4, (b) simulation No. 5, and (c) simulation No. 6 456
457
3.5. Effect of slope
458
Figure 14, shows the results of simulations No. 7 to No. 9, which used the same materials as 459
simulations No. 1 to No. 3, respectively (Table 1). However, in these cases, the model was 460
built with a steeper slope (10%). Simulation No. 7 (Figure 14a) was quite similar to the 461
Reference simulation, insofar as the value of LUGM became equal to zero quite abruptly; and
462
both on Day 141. LUGM abruptly became equal to zero on Day 64 in simulation No. 9 463
(Figure 14c), and on Day 132 the interface had become completely occluded. The change in 464
slope from 3.5% to 10% led to very slight changes in θw along the interface. This is valid
465
when comparing simulations No. 1 and No. 7, No. 2 and No. 8 and No. 3 and No. 9. 466
467
Figure 14: Distribution of θw in interface points at several time steps, for (a) simulation No.
468
7, (b) simulation No. 8, and (c) simulation No. 9 469
470
Figure 15 shows the results of simulations No. 10 to No. 12, whose interfaces were steeper 471
than interfaces in simulations with the same materials (No. 4 to No. 6; see Table 1). As can 472
be observed in Figure 15, at each time step, increasing the slope of the interface resulted in a 473
radically greater variation in θw along the interface.
475
Figure 15: Distribution of θw in interface points at several time steps, for (a) simulation No.
476
10, (b) simulation No. 11, and (c) simulation No. 12 477
478
4.
Discussion
479Figure 16 presents the effect of slope, ksat-MOL, the van Genuchten parameters a and n on 480
maximum value of volumetric water content (θw-max) at the interface points of all simulations.
481
It can be observed that the values of θw-max decreased very slightly with the increase in slope
482
of the interface. Regardless of the value of the slope and ksat-MOL, increasing the van 483
Genuchten parameter a (which can be attributed to greater compaction) resulted in a large 484
increase in θw-max, i.e. the air-filled pores at interface points were more likely to be occluded
485
(more precisely, to reach θw-pocc or θw-occ).
486
For each value of a, n and slope, increasing the ksat-MOL very slightly increased the value of 487
θw-max. However, important drops in the values of θw and θw-max at interface points were
488
observed following an increase in the value of n. For example, increasing n of the Reference 489
MOL (Simulation No. 2; Figure 8) led to a value of LUGM equal to the total length of the
490
interface, i.e. it remained completely unrestricted throughout the duration of the simulation, 491
whereas in the actual Reference simulation, LUGM became equal to 0 (total occlusion) half-492
way through the simulation (Day 141). 493
494
Figure 16: θw-max values in interface points, for several values of a, n, ksat-MOL and slope
495 496
It stems from these analyses that among the variables evaluated in the present study, n is the 497
one that most influenced θw-max, therefore the response of the PMOB to upward gas
498
migration. In simpler terms, n is a fundamental parameter in PMOB design, since it is 499
determinant in reducing the risk of attaining pore occlusion, which restricts upward gas 500
migration across the GDL-MOL interface. When partial occlusion occurs, biogas flows 501
laterally within the gas distribution layer towards the top of the slope, where it can escape to 502
the atmosphere. Of course, biogas can also escape through preferential pathways, such as 503
cracks within the final cover (tension cracks are common near the top of slopes) or voids 504
around protruding instrumentations and collection wells. In all these cases, hotspots, a 505
recurring problem in landfills, are created. 506
In Figure 17, the maximum values of ∆θw are plotted as a function of slope, ksat-MOL, a and n.
507
For simulations with ksat-MOL = 9.4×10⁻⁶ m/s, increasing a and slope had a minor effect on the
508
maximum ∆θw. However, increasing n led to large variations of θw (greater ∆θw). For certain
509
types of designs, such as the jagged interface proposed by Kjeldsen et al. (2013), it is 510
important to maintain θw at the top of each segment sufficiently lower than at the bottom to
511
increase the chances that a sufficiently large “channel” allows upward migration of CH4 to be
512
oxidized within the methane oxidation layer. 513
In the cases where ksat-MOL was 100 times greater (9.4×10⁻⁴ m/s), increasing a, n and slope,
514
considerably increased the maximum ∆θw. Accordingly, depending on the value of ksat-MOL,
515
the other 3 variables (a, n and slope) may have an important role in controlling the pattern of 516
upward flow of biogas, and reducing the chances of localized emissions (hotspots). 517
518
Figure 17: Maximum ∆θw in interface points, for several values of a, n, ksat-MOL and slope
519 520
Figure 18 shows the day when the maximum value of the volumetric water content θw-max
521
was attained for several simulations. As presented in the previous section, the time associated 522
with the onset of maximum ∆θw was quite similar for all simulations, i.e. Days 207-212.
523
According to Figure 18, for simulations with n or slope greater than those of the Reference 524
simulation, θw-max was attained earlier than maximum ∆θw. In other words, from the moment
525
when θw-max was attained until the onset of maximum ∆θw the interface points were
526
continuously drained, particularly towards the top of the slope. The temporary drainage of 527
interface points may be considered as an advantageous effect, as far as unrestricted upward
528
flow of biogas is concerned. For the simulations with n or slope equal to those of the 529
Reference simulation, θw-max was attained later than maximum ∆θw (gray area in Figure 18).
530
Therefore, between the onset of θw-max and the moment when the maximum ∆θw was attained,
531
the interface became wetter. 532
533
Figure 18: The time associated with attaining the θw-max in interface points, for several values
534
of a, n, ksat-MOL and slope 535
536
5.
Conclusions
537This study and the simulations thereof aimed at evaluating how variations in the main 538
hydraulic parameters affected the behavior of a modelled passive methane oxidation 539
biosystem (PMOB), as far as biogas migration and loading distribution at the base of the 540
methane oxidation layer is concerned. Ideally, all of the candidate MOL materials should be 541
characterized to obtain their hydraulic parameters and gas flow properties. Indeed, the 542
volumetric water content values at pre-occlusion and/or occlusion (θw-pocc and/or θw-occ),
which correspond to the volumetric air content values at pre-occlusion and/or occlusion (θ
a-544
pocc and/or θa-occ), should be known before performing numerical simulations. Analysis of the
545
performance would therefore be straightforward: the distance from the top to the point where 546
θw-pocc occurred (i.e. the length of unrestricted gas migration, LUGM) would be determined
547
from the simulations. Designs would be based on an optimization of the value of LUGM, and 548
not necessarily on its maximum possible value, i.e. the entire length of the interface. Good 549
practice calls for a compromise between CH4 oxidation efficiency and the cost of materials to
550
construct the PMOB. Unfortunately, it was beyond the scope of this study to determine the 551
hydraulic and gas flow parameters of all the materials considered in the simulations presented 552
herein. The value of this study relies on the identification of the relative importance of the 553
main variables involved. 554
Increasing either the van Genuchten parameter associated with the slope of the desaturation 555
zone in the water retention curve (n), the saturated hydraulic conductivity of MOL material 556
(ksat-MOL) or the slope, resulted in greater differences in volumetric water content along the 557
interface. For plane interfaces (such as the one presented in this study), greater differences in 558
volumetric water content may result in a LUGM that is shorter than the total length of the 559
interface. As far as the van Genuchten parameter a is concerned, the greater its value, the 560
greater are the chances that moisture in the pores at the interface points will increase enough 561
to restrict upward gas flow. 562
The maximum suction values in all simulations were sufficiently high to prevent seepage of 563
water from the methane oxidation layer into the gas distribution layer for a capillary barrier 564
with the methane oxidation layer acting as a moisture retaining layer and the gas distribution 565
layer as a capillary block layer (data not presented). However, these suction levels were low 566
enough to allow the air-filled pores of the methane oxidation layer to be in a state of 567
occlusion or pre-occlusion, and therefore to divert upward migrating biogas upslope. One 568
limitation of the numerical simulations presented relates to the fact that water generation due 569
to microbial activity was not considered. This might lead to lower suction values (higher 570
moisture) near the GDL-MOL interface, therefore changing the pattern of biogas migration. 571
However, in order to integrate this properly into numerical simulations, the effects of 572
increased temperature on evaporation and plant transpiration would also have to be 573
considered in the transient state simulations. 574
575
Acknowledgements
576This study received financial support from the Natural Science and Engineering Research 577
Council of Canada (NSERC) and Waste Management (WM Quebec Inc.), under the 578
collaborative research and development grant # CRD 379885-08, from the Consortium de 579
recherche et innovations en bioprocédés industriels du Québec (CRIBIQ) and from Discovery 580
Grant #170226. The Authors would like to acknowledge the invaluable help of Jean-Guy 581
Lemelin, technician, and of Philippe Tétrault, formerly with the Geoenvironmental Group at 582
the Université de Sherbrooke. 583
584
References
585Adu-Wusu, C., and Yanful, E.K. 2006. Performance of Engineered Test Covers on Acid-586
Generating Waste Rock at Whistle Mine, Ontario. Canadian Geotechnical Journal 43(1): 1-18. 587
AhouGhalandari, B., Cabral, A.R., and Leroueil, S. 2015. Assessment of Biogas Distribution 588
at the Base of Passive Methane Oxidation Biosystems. In The XV Panamerican Conference on 589
Soil Mechanics and Geotechnical Engineering, Buenos Aires, Argentina. 590
Arya, L.M., and Paris, J.F. 1981. A Physicoempirical Model to Predict the Soil Moisture 591
Characteristic from Particle-Size Distribution and Bulk Density Data. Soil Science Society of 592
America Journal 45: 1023-1030 593
ASTM-D2434-68. 2006. Standard Test Method for Permeability of Granular Soils (Constant 594
Head). ASTM International, West Conshohocken, PA. 595
Aubertin, M., Cifuentes, E., Martin, V., Apithy, S., Bussiere, B., Molson, J., Chapuis, R.P., and 596
Maqsoud, A. 2006. An Investigation of Factors that Influence the Water Diversion Capacity of 597
Inclined Covers with Capillary Barrier Effects. Geotechnical Special Publication, American 598
Society of Civil Engineers 147: 613-624. 599
Ball, B.C., O’Sullivan, M.F., and Hunter, R. 1988. Gas Diffusion, Fluid Flow and Derived Pore 600
Continuity Indices in Relation to Vehicle Traffic and Tillage. Journal of Soil Science 39: 327-601
339. 602
Bohn, S., and Jager, J. 2009. Microbial Methane Oxidation in Landfill top Covers - Process 603
Study on an MBT Landfill. In 12th International Waste Management and Landfill Symposium.
604
CISA, Margherita di Pula, Italy. 605
Bussière, B., Apithy, S., Aubertin, M., and Chapuis, R.P. 2003a. Diversion Capacity of Sloping 606
Covers with Capillary Barrier Effect. In The 56th Annual Canadian Geotechnical Conference,
607
4th Joint IAH-CNC, and CGS Groundwater Specialty Conference & 2003 NAGS Conference,
608
Winnipeg, Manitoba, Canada. 609
Bussière, B., Aubertin, M., and Chapuis, R.P. 2003b. The Behavior of Inclined Covers Used 610
as Oxygen Barriers. Canadian Geotechnical Journal 40: 512-535. 611
Cabral, A.R., Létourneau, M., Yanful, E., Song, Q., McCartney, J.S., and Parks, J. 2010a. 612
Geotechnical Issues in the Design and Construction of PMOBs. In UNSAT 2010, Barcelona. 613
pp. 1361-1367. 614
Cabral, A.R., Moreina, J.F.V., and Jungia, L.B. 2010b. Biocover Performance of Landfill 615
Methane Oxidation: Experimental Results. Journal of Environmental Engineering 136: 785-616
793. 617
Capanema, M.A., and Cabral, A.R. 2012. Evaluating Methane Oxidation Efficiencies in 618
Experimental Landfill Biocovers by Mass Balance and Carbon Stable Isotopes. Water Air Soil 619
Pollut 223(9): 5623-5635. 620
Chanton, J., Abichou, T., Langford, C., Hater, G., Green, R., Goldsmith, D., and Swan, N. 621
2011. Landfill Methane Oxidation Across Climate Types in the U.S. Environ. Sci. Technol. 622
45: 313-319. 623
Chapuis, R.P. 2004. Predicting the Saturated Hydraulic Conductivity of Sand and Gravel Using 624
Effective Diameter and Void Ratio. Can. Geotech. J. 41: 787-795. 625
Dagenais, A.-M., Aubertin, M., Bussiere, B., and Cyr, J. 2005. Performance of the Lorraine 626
Mine Site Cover to Limit Oxygen Migration In 2005 SME Annual Meeting: Got Mining 627
Annual Meeting: Got Mining - Preprints, Society for Mining, Metallurgy and Exploration, 628
Littleton, CO 80127-4102, United States,, Salt Lake City, UT, United States pp. 843-857 629
Fredenslund, A.M., Scheutz, C., and Kjeldsen, P. 2010. Tracer Method to Measure Landfill 630
Gas Emissions from Leachate Collection Systems. Waste Management 30: 2146–2152. 631
Fredlund, M.D., Wilson, G.W., and Fredlund, D.G. 2002. Use of the Grain-Size Distribution 632
for Estimation of the Soil-Water Characteristic Curve. Canadian Geotechnical Journal 39: 633
1103-1117. 634
Gebert, J., Groengroeft, A., and Pfeiffer, E.M. 2011. Relevance of Soil Physical Properties for 635
the Microbial Oxidation of Methane in Landfill Covers. Soil Biol Biochem 43: 1759-1767. 636
Geck, C., Gebert, J., Scharff, H., Streese-Kleeberg, J., and Pfeiffer, E.-M. 2012. Heterogeneous 637
Gas Distribution within a Biocover Designed for Methane Oxidation In 7th Intercontinental
638
Landfill Research Symposium (ICLRS). Poster presentation, Luleä, Sweden. 639
GEO-SLOPE. 2010. Seepage Modeling with SEEP/W 2007. Edited by G.-S.I. Ltd. 640
Huber-Humer, M., Röder, S., and Lechner, P. 2009. Approaches to Assess Biocover 641
Performance on Landfills. Waste Management 29: 2092-2104. 642
HYPROP-UMS. 2013. HYPROP-UMS User's Manual. In Art. no. HYPROP Version 02. UMS 643
GmbH München. 644
Jucá, J., and Maciel, F. 2006. Gas Permeability of a Compacted Soil Used in a Landfill Cover 645
Layer. In Fourth International Conference on Unsaturated Soils. Edited by G.A. Miller and 646
C.E. Zapata and S.L. Houston and D.G. Fredlund. American Society of Civil Engineers, 647
Carefree, Arizona, United States. pp. 1535-1546. 648
Khire, M.V., Benson, C.H., and Bosscher, P.J. 2000. Capillary barriers: Design variables and 649
water balance. Journal of Geotechnical and Geoenvironmental Engineering 126(8): 695-708. 650
Kjeldsen, P., Skov, B., Cassini, F., Zishen, M., and Scheutz, C. 2013. Mitigation of Methane 651
Emissions in a Pilot-Scale Biocover System at the Av Milo Landfill, Denmark: System Design 652
and Gas Distribution. In 14th International Waste Management and Landfill Symposium CISA
653
Publisher S. Margherita di Pula, Cagliari, Italy 654
Langfelder, L.J., Chen, C.F., and Justice, J.A. 1968. Air Permeability of Compacted Cohesive 655
Soils. Journal of the Soil Mechanics and Foundations Division 94(4): 981-1002. 656
Leroueil, S., and Hight, D.W. 2013. Compacted Soils: From Physics to Hydraulic and 657
Mechanical Behaviour. In First Pan-American Conference on Unsaturated Soils. Edited by 658
C.M. Bernardo Caicedo, Laureano Hoyos, Julio Esteban Colmenares, Ivan Rafael Berdugo, 659
Cartagena, Colombia. pp. 41-59. 660
Maciel, F., and Jucá, J. 2000. Laboratory and Field Tests for Studying Gas Flow Through MSW 661
Landfill Cover. In Geo-Denver. Edited by C.D. Shackelford and S.L. Houston and N.Y. Chang. 662
American Society of Civil Engineers, Denver, Colorado, United States. pp. 569-585. 663
Marinho, F.A.M., Andrade, M.C.J., and Jucá, J.F.T. 2001. Air and Water Permeability of a 664
Compacted Soil Used in a Solid Waste Landfill in Recife, Brazil. In the Third BGA 665
Geoenvironmental Engineering Conference. Thomas Telford Publishing, Thomas Telford Ltd., 666
Edinburg, Scotland. pp. 437-442. 667
Mirzaii, A., and Yasrobi, S.S. 2012. Influence of Initial Dry Density on Soil-Water 668
Characteristics of Two Compacted Soils. Géotechnique Letters 2: 193-198. 669
Mualem, Y. 1976. A new model for predicting the hydraulic conductivity of unsaturated porous 670
media. Water Resources Research 12: 513-522. 671
Ndanga, É.M., Bradley, R.L., and Cabral, A.R. 2015. Does Vegetation Affect the Methane 672
Oxidation Efficiency of Passive Biosystems? Waste Management 38: 240-249. 673
Nuth, M., and Laloui, L. 2008. Advances in Modelling Hysteretic Water Retention Curve in 674
Deformable Soils. Computers and Geotechnics 35: 835-844. 675
Pokhrel, D., Hettiaratchi, P., and Kumar, S. 2011. Methane Diffusion Coefficient in Compost 676
and Soil-Compost mixtures in Gas Phase Biofilter. Chem Eng J 169: 200-206. 677
Rachor, I., Gebert, J., Gröngröft, A., and Pfeiffer, E.M. 2011. Assessment of the Methane 678
Oxidation Capacity of Compacted Soils Intended for Use as Landfill Cover Materials. Waste 679
Management 31: 833-842. 680
Roncato, C.D.L., and Cabral, A.R. 2012. Evaluation of Methane Oxidation Efficiency of Two 681
Biocovers: Field and Laboratory Results. Journal of Environmental Engineering 138(2): 164-682
173. 683
Röwer, I.U., Gebert, J., Streese-Kleeberg, J., Kleinschmidt, V., Melchior, S., Scharff, H., and 684
Pfeiffer, E.-M. 2012. Heterogeneous Emission from a Biocover Designed for Methane 685
Oxidation. In 7th Intercontinental Landfill Research Symposium (ICLRS). Poster presentation,
686
Luleä, Sweden. 687
Sadasivam, B.Y., and Reddy, K.R. 2014. Landfill Methane Oxidation in Soil and Bio-Based 688
Cover Systems: a Review. Rev Environ Sci Biotechnol 13: 79-107. 689
Scheutz, C., Fredenslund, A.M., Chanton, J., Pedersen, G.B., and Kjeldsen, P. 2011. Mitigation 690
of Methane Emission from Fakse Landfill Using a Biowindow System. Waste Management 691
31: 1018-1028. 692
Springer, D.S., Loaiciga, H.A., Cullen, S.J., and Everett, L.G. 1998. Air Permeability of Porous 693
Materials Under Controlled Laboratory Conditions. Groundwater 36(4): 558-565. doi: 694
10.1111/j.1745-6584.1998.tb02829.x. 695
Stormont, J.C. 1996. The Effectiveness of Two Capillary Barriers on a 10% Slope. 696
Geotechnical and Geological Engineering Journal 14: 243-267. 697
Tang, A.M., Cui, Y.-J., Richard, G., and Défossez, P. 2011. A Study on the Air Permeability 698
as Affected by Compression of Three French Soils. Geoderma 162: 171-181. 699
Tétreault, P., Cabral, A.R., and Abdolahzadeh, A.M. 2013. Non-Uniform Distribution of 700
Biogas under a Biocover due to Capillary Barrier Effect: Case Studies. In GEOMontreal, 701
Montreal, Canada. 702
Vachon, B.L., Abdolahzadeh, A.M., and Cabral, A.R. 2015. Predicting the Diversion Length 703
of Capillary Barriers Using Steady State and Transient State Numerical Modeling: Case Study 704
of the Saint-Tite-des-Caps Landfill Final Cover. Can. Geotech. J. 52: 2141-2148. 705
van Genuchten, M.T. 1980. A closed-form equation for predicting the hydraulic conductivity 706
of unsaturated soils. Soil Science Society of America Journal 44: 892-898. 707
Williams, D.J., Wilson, G.W., and Currey, N.A. 1997. A cover system for a potentially acid 708
forming waste rock dump in a dry climate. In 4th International Conference on Tailings and
709
Mine Waste 97. Balkema, Rotterdam, Fort Collins, CO. pp. 231–235. 710
Wilson, G.W., Barbour, S.L., Swanson, D., and O'Kane, M. 1995. Instrumentation and 711
Modelling for Saturated/Unsaturated Performance of Soil Covers for Acid Generating Waste 712
Rock Hydrogéologie 4: 99-108. 713
Yanful, E.K. 1993. Oxygen Diffusion through Soil Covers on Sulphidic Mine Tailings. Journal 714
of Geotechnical Engineering 119(8): 1207-1228. 715
List of tables
List of figures
Figure 1: Water retention curves of the materials used in the parametric analysis
Figure 2: Hydraulic conductivity functions of the materials used in the parametric analysis; (a) ksat-MOL = 9×10⁻⁶ m/s, and (b) ksat-MOL = 9×10⁻⁴ m/s
Figure 3: Gas intrinsic permeability function of the MOL material for numerical simulations with ksat-MOL = 9×10⁻⁶ m/s
Figure 4: Dimensions and boundary conditions of the SEEP/W simulations (slope is variable) Figure 5: The daily rate of seepage into the PMOB2 during 246 days
Figure 6: Distribution of θw in interface points at several time steps in simulation No. 1
(Reference simulation)
Figure 7: Distribution of K in interface points at several time steps, for simulation No. 1 Figure 8: Distribution of θw in interface points at several time steps, for simulation No. 2
Figure 9: The water retention curve of the Reference MOL and materials from other studies (Jucá and Maciel 2006; Springer et al. 1998)
Figure 10: variation of (a) coefficient of air permeability and (b) gas intrinsic permeability with θa in materials from other studies (Jucá and Maciel 2006; Springer et al. 1998)
Figure 11: Corresponding grain size distribution curves of water retention curves of the MOL materials for two cases (a=2.8 and n=1.28; a=2.8 and n=1.5), using the Fredlund et al.
equation (2002)
Figure 12: Distribution of θw in interface points at several time steps, for simulation No. 3
Figure 13: Distribution of θw in interface points at several time steps, for (a) simulation No.
4, (b) simulation No. 5, and (c) simulation No. 6
Figure 14: Distribution of θw in interface points at several time steps, for (a) simulation No.
Figure 15: Distribution of θw in interface points at several time steps, for (a) simulation No.
10, (b) simulation No. 11, and (c) simulation No. 12
Figure 16: θw-max values in interface points, for several values of a, n, ksat-MOL and slope
Figure 17: Maximum ∆θw in interface points, for several values of a, n, ksat-MOL and slope
Figure 18: The time associated with attaining the θw-max in interface points, for several values
Figure 2: Hydraulic conductivity functions of the materials used in the parametric analysis; (a) ksat-MOL = 9×10⁻⁶ m/s, and (b) ksat-MOL = 9×10⁻⁴ m/s
Figure 3: Gas intrinsic permeability function of the MOL material for numerical simulations with ksat-MOL = 9×10⁻⁶ m/s
Figure 6: Distribution of θw in interface points at several time steps in simulation No. 1
Figure 9: The water retention curve of the Reference MOL and materials from other studies (Jucá and Maciel 2006; Springer et al. 1998)
Figure 10: variation of (a) coefficient of air permeability and (b) gas intrinsic permeability with θa in materials from other studies (Jucá and Maciel 2006; Springer et al. 1998)
Figure 11: Corresponding grain size distribution curves of the water retention curves of the MOL materials for two cases (a=2.8 and n=1.28; a=2.8 and n=1.5), using the Fredlund et al. equation (2002)
Figure 13: Distribution of θw in interface points at several time steps, for (a) simulation No.
Figure 14: Distribution of θw in interface points at several time steps, for (a) simulation No.
Figure 15: Distribution of θw in interface points at several time steps, for (a) simulation No.
Figure 18: The time associated with attaining the θw-max in interface points, for several values