HAL Id: hal-03015622
https://hal.archives-ouvertes.fr/hal-03015622
Submitted on 19 Nov 2020
HAL is a multi-disciplinary open access
archive for the deposit and dissemination of sci-entific research documents, whether they are pub-lished or not. The documents may come from teaching and research institutions in France or abroad, or from public or private research centers.
L’archive ouverte pluridisciplinaire HAL, est destinée au dépôt et à la diffusion de documents scientifiques de niveau recherche, publiés ou non, émanant des établissements d’enseignement et de recherche français ou étrangers, des laboratoires publics ou privés.
for MAVs & long range drones structures
Martin Lefebvre, Renaud Kiefer, Marc Vedrines, Hicham Chibane
To cite this version:
Martin Lefebvre, Renaud Kiefer, Marc Vedrines, Hicham Chibane. Carbon fibre/pvc foam sandwich composite modelization for MAVs & long range drones structures. 10th International Micro Air Vehicle competition and conference (IMAV 2018), Nov 2018, Melbourne, Australia. pp.60-65. �hal-03015622�
Carbon fibre/PVC foam sandwich composite modelization
for MAVs & long range drones structures
M. LEFEBVRE*, R. KIEFER, M. VEDRINES, and H. CHIBANE Icube, INSA, CNRS, Strasbourg, France 1 *contact email: [email protected] ABSTRACTThis paper deals with the
characterization, modelization and
simulation of a composite structure used for MAV or generally for drones design. Composite structures are extremely difficult to simulate due to the anisotropic behaviour. The first part of the article is focused on carbon fiber/PVC foam (AIREX) sandwich composite characterization with the design of experiments method on tensile tests. This method gives equations, which describe the material mechanical behaviour (Young’s modulus, tensile strength) depending on factors values. The second part of the article deals with the improvement of mechanical simu-lation of an anisotropic material with the goal to get an accurate model and to generalised properties to an entire structure. Then, the macroscopic mechanical properties of the most performing sandwich will be obtained with the global composite behaviour matrix 6x6, in order to be integrated into a Finite Element Analysis software (CREO / Simulate) to simulate a fixed wing behaviour. Finally, comparisons between experiment and numerical simulation on the wing will give promising results, and simulations will reveal substantial differences between tension & compres-sion in a flexural solicitation.
1 INTRODUCTION
The design of experiments method (Or Taguchi method) is used to study various combinations of sandwich composite. Commonly used in aeronautic design, this method can be implemented in drones design because drones become more and more competitive. This method provides many advantages for drones’ design, such as lean sizing and extra weight avoidance to increase drones’ performances and reduce manufacturing cost [4].
This approach permits to investigate the effect of each factor on mechanical properties, and offers a way to choose the best sandwich material in order to follow the specifications. Design of experiments finally gives equations that take design factors into account. INSA STRASBOURG team CIGOGNE (https://www.facebook.com/equipecigogne/;
https://fondation.unistra.fr/projet/imav2018/) uses this method in the design process of the ELCOD project INTERREG in cooperation with German and French universities. The objective is to design a low-cost long endurance drone. By choosing the correct carbon fibre sandwich for the structure and knowing the correct mechanical behaviour of the material, the objective is to choose the best factors combination that optimizes cost and high strength of the drone. 2 The design of experiments The design of experiments used is a three factors general full factorial design. • The first qualitative factor is carbon fibre type (Four levels: A, B, C and D)
• The second quantitative factor is fibre orientation (Two levels: 0° and 45°)
22 -23 November 2018. Melbourne, Australia.
2
• The third quantitative factor is PVC foam (AIREX© sheet C70.75 – R&G composite) thickness (Three levels: 1.2mm, 2mm and 5mm)
Thus, for this experiments plan, 24 combinations were tested with tensile tests. Furthermore, for each combination, three experiments were made to test the repeatability of the measure and to have a convincing average response. Those experiments were also made on an article for the IMAV 2015 where the tensile norm and experiments process are clearly explained [1]. Figure 1 - Sandwich composite structure • The B type is made with two layers of carbon fibre
65g/m2 (A type) for the face sheet. • 0° is the XX direction:
F0 F1 (θ) F2 (c) Carbon fibre type Orientation Foam thickness [mm]
A 0° 1,2 2 5 45° 1,2 2 5 B 0° 1,2 2 5 45° 1,2 2 5 C 45° 0° 1,2 1,2 2 2 5 5 D 45° 0° 1,2 1,2 2 2 5 5 3 Results 3.1 Effect of factors
Tensile tests results are analysed to study each effect of factors on mechanical properties: Tensile strength and Young’s modulus are the responses studied.
Figure 3 - Effect of each factors on average tensile strength
Figure 4 - Effect of each factors on average Young's modulus
When PVC foam thickness increases, average
mechanical properties decrease, because
sandwich properties converge to foam properties. That is adequately explained with the sandwich rule of mixture [3]. Off-axis orientation decreases also mechanical properties [2, 5].
With this method, a selection can be done: • A type hasn’t got enough mechanical strength • B type is too expensive in a low-cost design
(the carbon fibre surface is doubled compare to the other types)
• 80g/m2 and 160g/m2 carbon (C & D type) have
to be preferably considered in terms of mechanical properties. In the following, a
complete analysis will be done.
Table 2 - Design of experiments; factors’ values Carbon fibre type A C D 65 g/m2 Plain weave (60 tex) 80 g/m2 Spread tow fabric TeXtrem (800 tex) 160 g/m2 Plain weave (200 tex) Table 1 - Carbon fibre type Figure 2 - Fibre orientation Face sheet (Carbon fibre/epoxy) Factor: Type & orientation A, C & D type: 1 layer B type: 2 layers Core (Polyvinyl chloride foam (PVC) or AIREX) Factor: Thickness X Y Z (t) (l)
3
3.2 Composite behaviour equations
3D plots give visual results on the best sandwich material composition. The comparison between sandwich C and D is done on the Figures 5 & 6. Behaviour equations are given on the Equation 1 & 2. Figure 5 - Carbon fibre C type; factors 3D plot Figure 6 - Carbon fibre D type; factors 3D plot Equation 1 & 2 gives theoretical tensile strength for this factors combination. It is an important time saving in the design step.
Example: For the carbon fibre C, with θ=0° and foam thickness=3mm:
!!"# = 122,1 − 1,23×0 − 45×3 + 4,76×3!
+ 0,21×0×3 = !", !"#$% Design experiments method can be use for structure sizing. By choosing factors values for the composite, it is possible to evaluate the theoretical Young’s modulus and tensile strength. 4 Flexural models The objective is to determine the most adequate flexural model to use in the following study. A 3-points bending test will be done to study flexural behaviour. As sample, a 2mm thickness sandwich beam C type will be tested. 4.1 Castigliano model
Equations 3 & 5 give the deflection Δ [mm] of a composite sandwich beam for a 3-point bending test under a load F [N]: • ∆= !" ! !" !" é!+ !" ! ! !" (eq. 3) [2] With !" !"=!!!! ! ! + !!!!! !" + !!!"!! ! (eq. 4) [6] Figure 7 - Sandwich composite thickness data
This model takes the separate layers and the shear contribution (second term of Equation 3) into account.
For the bending test, properties of the sample are: o !!= 49 and !!= 0,066 [GPa]
o ! = 50 , ! = 600, ! = 2 and ! = 0,22 [mm] o ! = 1
Note: !! and !! are determined with suppliers’ data and rule
of mixture for !! with epoxy resin. The error is quantified to +/-5%. 4.2 Homogeneous beam model (Voigt model) • ∆= !" ! !" !" !"#$%"(eq. 5)
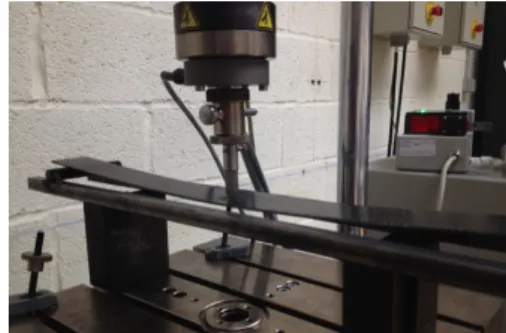
The term !" !"#$%" is determined with the
tensile test from the design of experiments. 4.3 Experimental 3-points bending test Figure 8 - 3-point bending test on sandwich sample (C type) Sandwich C !!"# = 122,1 − 1,23×!1 − 45,0×!2 +4,76×!2!+ 0,21×!1!×2 (!". 1) Sandwich D !!"# = 135,5 − 1,23×!1 − 45,0×!2 +4,76×!2!+ 0,21×!1×!2 (!". 2) Table 3 - Composite behaviour equations (R2=81,04%) F1: Orientation (θ) - F2: Foam thickness (c) core fibre Carbon fibre type C Carbon fibre type D Fibre orientation (°) AIREX thickness (mm) Te ns ile s tr en gt h (MP a) Fibre orientation (°) AIREX thickness (mm) Te ns ile s tr en gt h (MP a)
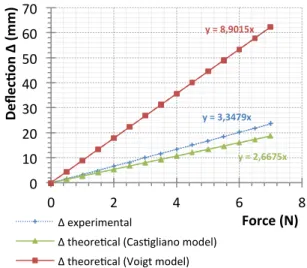
22 -23 November 2018. Melbourne, Australia. 4 Figure 9 - Beam comparison between flexural models Model Relative error Castigliano 20% Voigt 166%
In flexural solicitation, it’s more adequate to use the Castigliano model (Sandwich model): To take
the distinct layers into account with the !" é!
term. The theoretical result will be closer to the reality with this model. For tensile, the macroscopic model can be used; it is by definition the behaviour of a composite with the rule of mixture. However, for flexural solicitation a more elaborate bending theory is needed [2, 7]. This accurate theory takes behaviour of heterogenic layers and the shear contribution into account. That is why the relative error is less important.
5 Best factor combination
Low foam thickness means high tensile strength and high Young’s modulus. And high foam thickness means high rigidity (high second moment of inertia). The objective is to find a compromise between high tensile strength and high rigidity.
Thanks to the experiments, the optimization process gives a thickness between 1.8mm and
2,5mm (white area on the Figure 10) with the
carbon fibre C and 0° orientation to insure best
compromise between high bending stiffness and high tensile strength:
Figure 10 - Composite thickness optimization
In the following parts, a comparison will be done between a real bending test and a numerical simulation on a C type carbon fibre sandwich wing (NACA MH 32 wing profile) with a carbon fibre sandwich spar. The objective is to study the accuracy of a numerical simulation on complex fixed wing geometry. Thanks to the previous results, the choice of a 2mm foam, Carbon fibre C type is done for
the analysis. The multi-layers model will be used to increase the
ac-curacy of the
simulation.
6 Sandwich mechanical behaviour
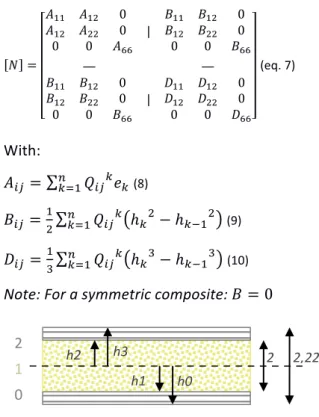
The following equations are used for input all material data on CREO Simulate. !! ! = !! ! !!! !! !!!!!!! ! !!"!!!!"!! !! ! =!! ! !!! !! !!!!!!! ! !!"!!!!"!! !!" ! = ! !!!!! ! !!! ! !!!!!!"!! ! !!!!!! !!" (eq. 6) [2]
Equations 6 can give !!" thanks to the tests at ! = 45°. Thus, all coefficients of stiffness matrix
! can be determined for each layer: y = 3,3479x y = 2,6675x y = 8,9015x 0 10 20 30 40 50 60 70 0 2 4 6 8 Deflecgo n Δ ( mm) Force (N) Δ experimental Δ theoreqcal (Casqgliano model) Δ theoreqcal (Voigt model) Table 4 - Relative error comparison between flexural models Figure 11 - Experimental wing MH32 + spar Composite sandwich structure C
5 ! !"#$%!!!! = 58,47 14,0314,03 58,47 00 0 0 30,47 !° !"° ! !"#$ = 0,073 0,0220,022 0,073 00 0 0 0,028 (Units in GPa)
Distinct layers have to be integrated into the behaviour matrix 6x6, in order to get macroscopic sandwich composite behaviour: ! = !!! !!" 0 !!" !!! 0 0 0 !!! | !!!!!" !!!"!! 00 0 0 !!! — — !!! !!" 0 !!" !!! 0 0 0 !!! | !!! !!" 0 !!" !!! 0 0 0 !!! (eq. 7) With: !!" = !!!!!!"!!! (8) !!"=!! !!!!!!"! ℎ!!− ℎ!!!! (9) !!" =!! !!!!!!"! ℎ!!− ℎ!!!! (10) Note: For a symmetric composite: ! = 0 Figure 12 - Sandwich composite layers thickness
Finally, the carbon fibre/foam 2mm sandwich composite macroscopic behaviour can be expressed with this matrix: ! = 13009 3131 0 3131 13009 0 0 0 6759 | 0 — — 0 | 143793453 143793453 00 0 0 7486 (A matrix in N/mm; D matrix in N.mm) 7 Sandwich simulations After computing matrix behaviour data (Equation 7) into CREO Simulate, flow stress and beam is calculated with a 10N load at the edge of the tested wing:
Figure 13 – Flow stress XX (N/mm) simulation on sandwich composite C; wing + spar (Display beam scale: 10%)
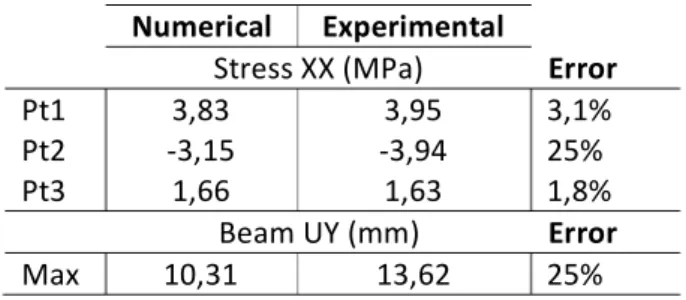
The upper side of the wing is in tension and the lower side in compression. The maximum stress is reach in the spar of the wing. It is this part on the wing which takes up efforts. 8 Sandwich experimental test The objective is to compare simulation with an experimental bending test: Figure 14 - Experimental Zwick Roell bending test bench
Strain is measured in three points with strain gauges: Pt1: Upper side, close to rigid link Pt2: Lower side, close to rigid link Pt3: Upper side, middle of the wing Figure 15 - Experimental wing strain on 3 points In the experimental test, the tensile stress on the upper side of the wing is the same than the compressive stress on the lower side of the wing. y = -59,061x y = 28,007x y = 59,1x -1500 -1000 -500 0 500 1000 1500 0 5 10 15 20 Str ain (x 10 -6) Load (N) ε Pt2 ε Pt3 ε Pt1 0 1 2 h3 h2 h1 h0 2 2,22
22 -23 November 2018. Melbourne, Australia.
6
For compression the relative error is more important because it is difficult to predict compressive behaviour for fibre due to crushing, buckling and fibre delamination. Those results are showed in the Table 5.
Table 5 - Relative error on stress and beam comparison
9 CONCLUSION
Design of experiments has made possible the choice the best sandwich composite for the corresponding application and gives equations to correctly design the composite structure. This method has to be used to design drones; it is an important time saving to compare structures and to choose the best factors’ values.
After choosing the adequate sandwich composite, numerical simulations show that composite behaviour is not the same in tension or compression for high deformations. Even if the model with distinct layers is more accurate than the homogeneous model, investigation can be done to improve this theory. Buckling and fibre delamination can occur for compression, and a more exhaustive theory that takes layers slippage and plastic deformation into account has to be used. The flexural behaviour is non-linear for high compressive deformations [7]; and for the experiment of the present article, increasing the load to produce higher deformations could permit to study a more accurate non-linear compressive behaviour and reveal buckling [7, 8]. To go further with simulation, Tsai-Wu failure criterion can be used to study the limit of the composite, plus observation on sample have to be done to investigate damage and failure [8]. For numerical simulation, it is possible to be confident with tension, because the behaviour is linear-brittle
and error is under 5%. However, it is highly recommended to be careful when local compression appears. Indeed, the current model is neither accurate nor optimal and simulation error is higher than 25% because of buckling.
REFERENCES
[1] Renaud K., Marc V., Proposition of design method and optimization of multirotors composite structures, ICube UMR 7357, 2015. [2] D. Gay, Matériaux composite (Composite Materials). Paris: Lavoisier Hermes, 6th revised edition, 2015. 687 p. (ISBN 978-2-7462-4707-9) [3] CES EduPack, Sandwich Panel: Assumption and calculations, Granta, 85 p. 2017.
[4] R. Rikards, A. Chate, Optimal design of sandwich and laminated composite plates based on the planning of experiments, Structural Optimization, Riga Technical University, 1995. [5] Kawai M., Morishit M., Satoh H., Tomuras S., Effect of end-tape shape on strain field of unidirectional carbon/epoxy composite specimens subject to off-axis tension, Composite Part A, Vol. 28A, pp 267-275, 1997.
[6] K. Joon Yoon, C.K. Kim and Hoon C. Park, Nonlinear flexural deflection of thermoplastic foam core sandwich beam, Journal of Composite Material, Vol. 36, No 13/2002, 2001.
[7] I. M. Daniel, J. L. Abot, K. A. Wang, Testing and analysis of composite sandwich beams, ICCM, 1999.
[8] E.E. Gdoutos, I.M. Daniel, Failure modes of composite sandwich beams, Thoeret. Appl. Mech., Vol.35, No.1-3, pp. 105-118, Belgrade 2008.
ACKNOWLEDGEMENTS
The ELCOD project (www.elcod.eu) is co-funded
by the European Regional Development Fund (ERDF) and the co-financed project partners Region Grand Est and the countries of Baden-Württemberg and Rhineland-Palatinate in the framework of the INTERREG V Upper Rhine program. Numerical Experimental Stress XX (MPa) Error Pt1 3,83 3,95 3,1% Pt2 -3,15 -3,94 25% Pt3 1,66 1,63 1,8% Beam UY (mm) Error Max 10,31 13,62 25%