OATAO is an open access repository that collects the work of Toulouse researchers and makes it freely available over the web where possible
Any correspondence concerning this service should be sent
to the repository administrator: [email protected]
This is a Publisher’s version published in: http://oatao.univ-toulouse.fr/23573
To cite this version:
Chaisubanan, Napapat and Pruksathorn, Kejvalee and Vergnes, Hugues and Senocq, François and Hunsom, Mali Stability of TiO2 Promoted PtCo/C
Catalyst for Oxygen Reduction Reaction. (2016) International Journal of
Electrochemical Science (11). 1012-1028. ISSN 1452-3981
International Journal of
ELECTROCHEMICAL
SCIENCE
www.electrochemsci.orgStability of TiO
2Promoted PtCo/C Catalyst for Oxygen
Reduction Reaction
Napapat Chaisubanan1, Kejvalee Pruksathorn1,2, Hugues Vergnes3, François Senocq4,
Mali Hunsom1,2,*
1Fuels Research Center, Department of Chemical Technology, Faculty of Science, Chulalongkorn University, 254 Phayathai Road, Bangkok 10330, Thailand
2 Center of Excellence on Petrochemical and Materials Technology (PETRO-MAT), Chulalongkorn University, 254 Phayathai Road, Bangkok 10330, Thailand
3Laboratoire de Génie Chimique, ENSIACET, Institut National Polytechnique de Toulouse, UMR-CNRS 5503, 4 allée Emile Monso, 31030 Toulouse Cedex 4, France
4 CIRIMAT, Université de Toulouse, CNRS-UPS-INP, ENSIACET, 4 allée Emile Monso, BP 44362, 31030 Toulouse Cedex 4, France
*E-mail: [email protected]
Received: 17 November 2015 / Accepted: 8 December 2015 / Published: 1 January 2016
This work was carried out to explore the effect of TiO2 on activity and stability of a PtCo/C catalyst for an oxygen reduction reaction (ORR). Two types of TiO2, including commercial TiO2 (TCOM) and a home-prepared TiO2 by chemical vapor deposition (TCVD), were incorporated on the PtCo/C catalyst layer. The activity of all prepared-catalysts was tested in a single proton exchange membrane (PEM) fuel cell under an H2/O2 environment at ambient pressure, while their stability was tested by the linear sweep voltammetry (LSV) in 0.5 M H2SO4. The preliminary results demonstrated that the TCVD promoted PtCo/C catalyst (TCVD-PtCo/C) exhibited the highest activity in a PEM fuel cell for both activation polarization and ohmic polarization regions, which can produce the current density of 434 mA/cm2 (277 mW/cm2 or 1,847 W/g
Ptcm2) at 0.6 V. It also exhibited the highest stability in 0.5 M H2SO4 with performance loss of around 40% after 6,000 LSV-cycles.
Keywords: PEM fuel cell; stability test; PtCo/C catalyst; TiO2; chemical vapor deposition
1. INTRODUCTION
Cathode polarization is the main source of loss in low temperature fuel cells, and there have been a number of studies that have attempted to develop catalysts with high activity toward ORR. Although Pt is very active for oxidation and reduction reactions in fuel cells due to its high chemical
Int. J. Electrochem. Sci., Vol. 11, 2016
1013
resistance and stable electrical conductivity, it is very expensive, resulting in a high cost for fuel cells commercialization. Therefore, the platinum-based alloys are now worldwide investigated. Platinum-based alloys with transition metals such as Co, Fe and Ni, exhibit significantly higher ORR catalytic activities than Pt alone [1,2]. The search for more active and less expensive ORR catalysts with better stability than Pt based catalysts has led to the development of binary and ternary Pt-alloys. Previously, the PtCo alloy was the most extensively studied [3-6]. Pt loading in catalysts at the cathode can be reduced if PtCo alloys are used as catalysts for the ORR since the catalytic activity of the PtCo alloys for the ORR, based on the mass of Pt, is higher than that of pure Pt.
The activity loss in PEM fuel cells during operation is usually carried out by the loss of active surface area of catalyst due to particle agglomeration and leaching of the alloying metal into the electrolyte. It has been found that the solubility of Pt is proportional to potential, pH of acid solution as well as reciprocal of particle size. It is crucial to find corrosion resistant (highly stable) catalysts for the increase of PEM fuel cell durability. Recently, metal oxide such as SiO2, CeO2, ZrO2 and TiO2 were introduced to a Pt/C catalyst resulting in higher sintering resistance and corrosion resistance for PEM fuel cells [7,8]. The SiO2 can enhance the activity of the PtCo/C catalyst even in the region of low cell voltage [9]. Moreover, a dense SiO2 layer can prevent the diffusion of Pt and/or Co species from PtCo alloys out of the catalysts, resulting in the durability improvement of the PtCo/C catalyst. The addition of CeO2 into the Pt/C catalyst formed the continuous amorphous cerium oxide (Ce3+, Ce4+) layer, which could inhibit the oxidation of the Pt surface and contribute to enhancement of the activity on the Pt cathode [7]. TiO2 can minimize the loss in the Pt electrochemical surface area (ESA) of Pt/TiO2 and PtPd/TiO2 at high potentials due to the minimization of carbon corrosion and subsequent catalyst particle sintering and agglomeration [10-11]. ZrO2/nitrogen-doped graphene nanosheets can enhance the ORR activity and improve the stability of the Pt catalyst. This is because the Pt particles have stronger metal support interactions when deposited on the co-interface of nitrogen-doped graphene nanosheets and ZrO2 [12].
In the present work, two types of TiO2 particles were incorporated on the top layer of the PtCo/C catalyst, including commercial TiO2 and a home-prepared TiO2 by chemical vapor deposition (CVD), in order to explore their effects on the activity and stability of such catalyst for ORR.
2. EXPERIMENTAL
2.1 Preparation of PtCo/C catalyst and catalyst ink
The PtCo catalysts were prepared by the seeding-impregnation method reported previously by this same research group [13]. Initially, a carbon black (Vulcan XC72, Cabot) was dispersed in deionized water with sonication at 70 °C for 1 h, and the solution was adjusted to pH 2 with 13.3 M HCl. Then, the seeding step was carried out by mixing the carbon slurry with 10% (v/v) of PtCo precursor, prepared by mixing 2.844 mL of 20 g/L of H2PtCl66H2O (Fluka) and 4.324 mL of 20 g/L CoCl26H2O (Kanto Chemical) with sonication at 70 °C for 30 min. The metal ions were then reduced by 0.12 M NaBH4 (98 %, Alcan) and sonicated for 30 min at 70 °C. After filtration and washing, the
filter cake was dispersed in deionized water and sonicated for 1 h. The impregnation step was conducted by slowly dropping the remaining PtCo precursor solution to obtain the metal loading on the carbon support (30% (w/w)). The PtCo ions were reduced by 0.12 M NaBH4 (98 %, Alcan) and sonicated for 30 min. Finally, the PtCo/C catalysts were filtered and washed by hot deionized water and dried for 2 h at 110 °C.
For the catalyst ink preparation, 0.1 g PtCo/C catalyst powder was mixed with 0.4 mL of distilled H2O and sonicated at 30 oC for 30 min. Then, 0.916 mL Nafion solution (5% (w/v) Nafion117, Fluka) was added and sonicated again at the same temperature for 1 h. The ready-to-use ink was obtained after the addition of 3.2 mL of i-propanol (99.99 % C3H7OH, Fisher) and sonicated for 1 h.
2.2 Preparation of membrane electrode assembly (MEA)
Prior to preparing the electrode, the sub-layer ink was first prepared by mixing 0.018 g carbon black (Vulcan XC- 72, Cabot), 0.5 mL deionized water, 1.35 µL PTFE (60 wt.%, Aldrich) and 1 mL isopropanol (99.99 % C3H7OH, Fisher). The obtained slurry was sonicated at room temperature for 15 min and then loaded on a 5 cm2-gas diffusion layer (GDL, carbon cloth, ETEK) at constant loading of 2 mg/cm2 by direct painting. The ready-to-use sub-layer-coated GDL was obtained after free moisture and solvent elimination by drying at 80 oC for 1 h and 300 °C for 1 h. Two techniques were used to apply TiO2 on MEA: direct spray and CVD. The former technique was used for the commercial TiO2, while the latter technique was used for a home-prepared TiO2.
For the direct spray technique, the PtCo/C catalyst was initially applied on a 5-cm2 membrane by direct spraying with a spray gun (Crescendo, Model 175-7TM) onto the pretreated membrane (Nafion 115) at 80 oC at constant loading of 0.15 mg/cm2. The catalyst-coated membrane was then dried at 80 °C for 10 min. A similar spraying process was carried out with the TiO2 slurry, obtained by mixing 2.5 mg of commercial TiO2, (P25, Degussa) with 6 mL i-propanol (99.99 % C3H7OH, Aldrich) to the required loading density of 0.06 mg/cm2. The TiO
2-PtCo/C-coated membrane (Tcom-PtCo/C) was then assembled between two sheets of sub-layer ink-coated GDL (sGDL) and pressed together by a compression mold (LP20, Labtech) under 65 kg/cm2 for 2.5 min at 137 °C [13].
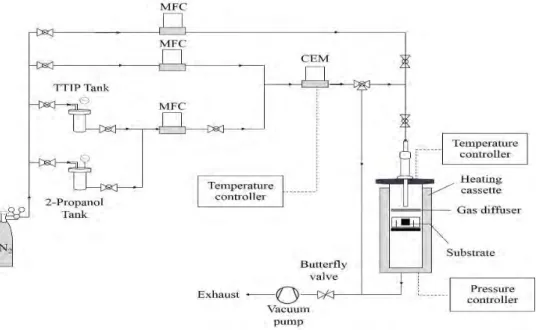
For the second technique, a sheet of sGDL was put in as a CVD apparatus (Figure 1) for depositing a home-prepared TiO2 on its surface. Briefly, 1.85 mL of titanium tetraisopropoxide (C12H28O4Ti, Aldrich, TTIP) was mixed with 118.15 mL i-propanol (99.99 % C3H7OH, Aldrich) and stored in the stainless steel tank under N2 atmosphere. Consequently, it was delivered to an evaporator and heated to 120 °C in flowing N2 carrier gas at a flow rate of 267 sccm. The obtained vaporized TTIP precursor was transferred to a CVD reactor (350 oC and 0.026 atm) and deposited on a sheet of sGDL at constant flow rate of 200 sccm under N2 atmosphere. The CVD process was operated continuously for 30 min to get a TiO2 loading of 0.06 mg/cm2. A similar procedure for catalyst loading on membrane was performed as above to obtain the constant loading of 0.15 mg/cm2. Subsequently, sheets of TiO2 coated sGDL, PtCo/C catalyst-coated membrane and sGDL were pressed together by a compression mold (LP20, Labtech) under 65 kg/cm2 for 2.5 min at 137 °C.
Int. J. Electrochem. Sci., Vol. 11, 2016
1015
Figure 1. CVD apparatus.
2.3 Preparation of electrode and characterization
To characterize the morphology of all prepared catalysts, either TCOM or TCVD were loaded on sGDL by direct spraying and CVD at constant loading of 0.06 mg/cm2. The obtained specimen was dried at 100 oC for 1 hr to eliminate free moisture and solvent. Afterward, the PtCo/C catalyst was then applied on the top layer of TiO2 by direct spraying with a spray gun at identical loading of 0.15 mg/cm2. The ready-to-use electrode was obtained after water and solvent elimination by drying at 100 oC for 1 hr.
The X-ray diffractometor (XRD, D8 Discover-Bruker AXS) was used to analyze the crystalline size and d-spacing of all prepared catalysts. The scanning electron microscopy (SEM) with energy dispersive X-ray spectroscopy (EDX) on a JSM 6400 machine was used to detect the metal content of on electrode and the Standard Contact Angle Goniometer (Rame-hart, 200-U1) was used to measure the contact angle of all PtCo/C electrodes
2.4. Activity and stability tests
The MEA obtained from the previous section was constructed on the commercial single-cell hardware (Electrochem, Inc.). The respective as-prepared TiO2-PtCo/C catalyst was used at the cathode side, and the commercial Pt/C (20 % (w/w) (ETEK) catalyst at the same loading was used at the anode side. Before testing the cell performance, the run-in stage was carried under an atmospheric condition (1.0 psig) with a cell temperature of around 60 °C by feeding H2 and O2 at 100 sccm while the current was drawn at constant potential of 0.2 V for 12 h. Then, the cell performance was evaluated in the form of polarization curves (current density-potential curves), monitored by a Potentiostat/Galvanostat at 60 oC and ambient pressure with 100% gas humidification.
CEM
Butter
fly
valve
Temperat
ure
controller
Pressure
controller
Heating
cassette
Gas
diffuser
Substrate
holder
The stability of either PtCo/C or TiO2-PtCo/C catalysts was tested in 0.5 M H2SO4 as the repetitive LSV. The electrode prepared from section 2.3 was mounted on the rotating disk electrode (RDE) and used as the working electrode. A Pt gauze was used as counter electrode, while the saturated calomel electrode (SCE) was used as reference electrodes. In each test cycle, the LSV was conducted at different potentials in the range of -0.055 to 0.65 V, at rotation speed of 2,000 rpm and a constant sweep rate of 10 mV/s in O2-saturated 0.5 M H2SO4 using a Potentiostat/Galvanostat (DEA332, Radiometer). After every 500 LSV-cycles, the electrochemical impedance spectroscopy (EIS) was performed to measure the electrolyte resistance (R) in the frequency range from 10 mHz-10 kHz with applied AC amplitude of 10 mA and 0.4 V. A multichannel potentiostat (Bio-Logic, France) was used and monitored with EC-Lab V10.32 software (Bio-Logic, France) using a computer. Finally, the variation of ESA of all prepared PtCo/C catalysts after the LSV cycle was estimated from the H2 stripping method by cyclic voltammograme (CV) at the potential ranging from -0.35 V and + 1.2 V and scan rate of 20 mV/s. The ESA of the catalyst can be estimated from the hydrogen desorption peak according to Eq.(1) [14]:
0.21 M Q ESA H (1)where QH is the charge for hydrogen desorption (C), factor 0.21 is the charge required to
oxidize a monolayer of H2 on bright Pt (mC/cm2) and [M] is the metal loading of Pt on the electrode (mg/cm2).
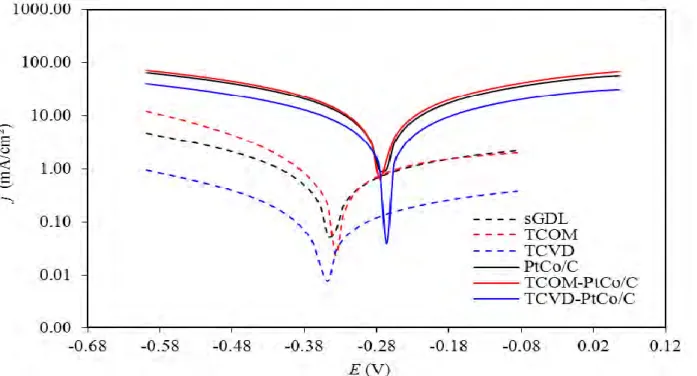
The corrosion of carbon substrate, TiO2 and TiO2 promoted PtCo/C catalyst was carried out in O2-saturated 0.5 M H2SO4 using the LSV during the potential of -0.58 to 0.02 V under stagnant solution at constant sweep rate of 1 mV/s using a Potentiostat/Galvanostat (PGSTAT 30, Autolab). The investigated specimens were used as working electrode, while a Pt gauze and saturated calomel electrode (SCE) were used as counter- and reference electrodes, respectively.
3. RESULTS AND DISCUSSION
3.1 Morphology of prepared TiO2 and TiO2-PtCo/C catalysts
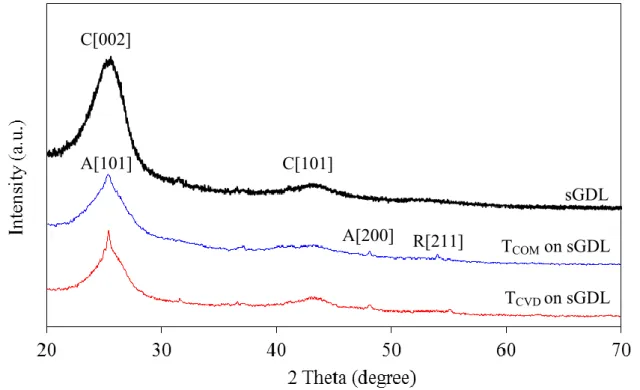
Figure 2 displays the XRD patterns of the sGDL, TCOM and TCVD deposited on sGDL. The XRD pattern of sGDL exhibited two broad peaks at 2 of 25.27o and 42.87o associating with the hexagonal plane of carbon at planes of C[002] and C[101] (JCP-001-0646), respectively. Both peaks at the same 2 were also observed for both types of TiO2 coated on sGDL but with the sharp-end for a peak at 2 of 25.27o. This might be attributed to an overlap of peak C[002] of carbon and peak A[101] of TiO2 in anatase phase (JCP-002-0606). Also, the XRD pattern of both TiO2 revealed the peak at 2 of 48.05o, assigning to the peak of A[200] (JCP-002-0606). Besides, a characteristic peak of rutile phase at a 2 of 53.99o, corresponding to the R[211] planes (JCP-001-1292) was also observed for TCOM. This suggests that the phase of TCOM was a mixture of both anatase and rutile phases, while the phase of TCVD was only the anatase phase. The particle size, estimated from the peak at 2 of 48.05o
Int. J. Electrochem. Sci., Vol. 11, 2016
1017
according to the Debye-Scherrer equation [15], of TCOM was around 38.66 nm, close to that of TCVD (37.82 nm).
Figure 2. Representative XRD patterns of TCOM and TCVD.
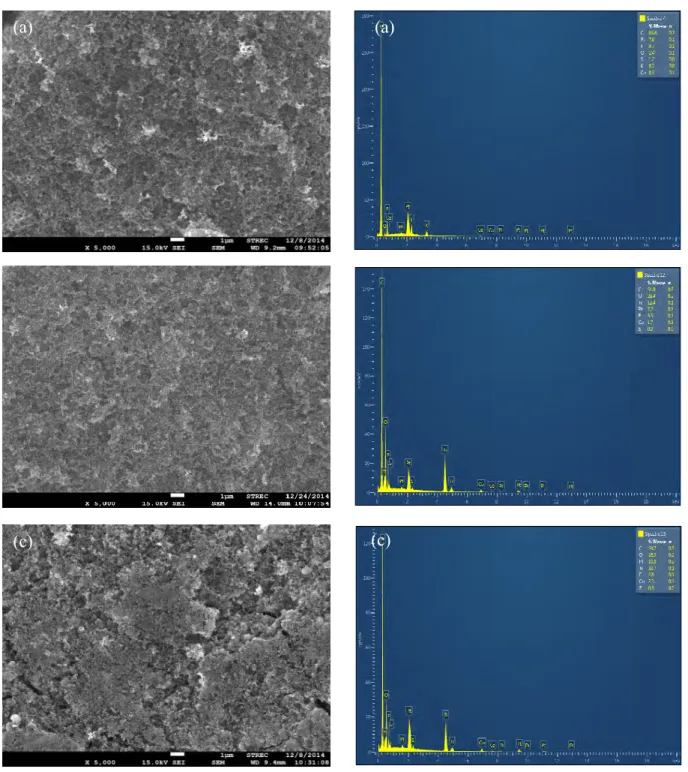
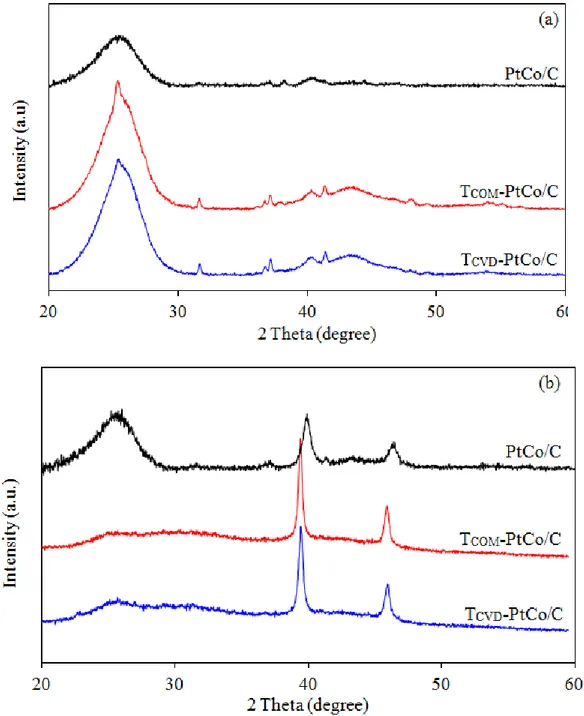
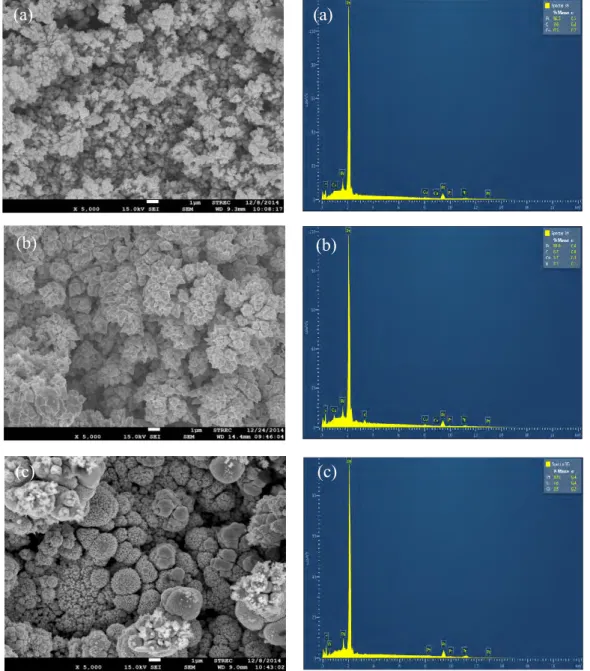
When either TCOM or TCVD were coated on the PtCo/C catalyst layer, a uniform distribution of metal along the electrode surface was observed for all types of catalysts (Figure 3). The EDX spectrum revealed the presence of metal elements including Pt, Co and Ti on the electrode surface. The XRD spectra of PtCo/C catalysts on sGDL demonstrated a broad peak during 2 between 20o and 30o of carbon substrate. However, a broad sharp-end peak was observed for the TiO2-PtCo/C catalyst at the same 2 range (Figure 4(a)). This is attributed to an overlap between the diffraction peaks of hexagonal carbon substrate and the crystal plane of A[101] of TiO2. Although low intensities of Pt peak were observed due to high intensity of carbon substrate and TiO2, their spectrum also exhibited the main characteristic peaks of the face-center cubic (FCC) structure of crystalline Pt[111] at 2 of 40.01° [16].
The d-spacing of all the supported PtCo/C catalysts was smaller than that of the pure Pt/C catalyst (Table 1), indicating a contraction of the Pt lattice, due to the particle substitution of Pt by Co in the FCC structure [17] or the formation of the PtCo alloy. In the presence of TiO2, the XRD pattern of the TiO2-PtCo/C catalyst still exhibits the diffraction peaks of FCC Pt, and the diffraction peaks of TiO2 at about 25.27o and 48.05o are well presented in the TCVD-PtCo/C catalyst. The diffraction peaks of Pt were also noticed in this catalyst at 2 of 40.01o. The crystallize sizes of oth TiO
2-PtCo/C catalyst were slightly smaller than that of PtCo/C (Table 1). The ratio of Pt and Co was close to the set value of 1 : 1.
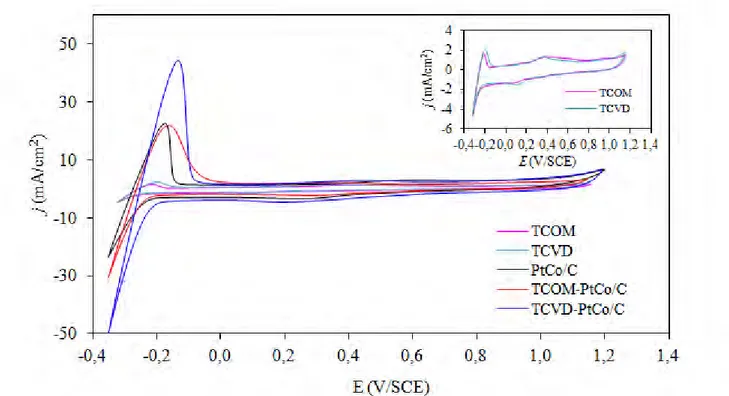
Regarding the ESA of TiO2 and TiO2-PtCo/C, the maximum hydrogen desorption area was in the order of TCVD-PtCo/C > TCOM-PtCo/C > PtCo/C catalysts (Figure 5), suggesting that the maximum
TCOM on sGDL TCVD on sGDL sGDL A[101] C[002] C[101] A[200] R[211]
(c)
ESA was ranked in the order of TCVD-PtCo/C > TCOM-PtCo/C > PtCo/C catalysts (Table 1). The presence of TiO2 in the catalyst layer can enhance an increase of ESA compared with that in the absence of TiO2, probably due to the increase of electrode roughness in the presence of TiO2 [18].
Moreover, either pure TCOM or TCVD can participate in the Hupd adsorption/desorption reaction as shown as the insert of Figure 5. A higher hydrogen desorption area was observed for TCVD than that of TCOM, resulting in a high ESA of the TCVD-PtCo/C catalyst.
Figure 3. SEM micrographs of crystalline particles and EDX spectra of (a) PtCo/C, (b) TCOM-PtCo/C and (c) TCVD-PtCo/C catalysts before stability test by repetitive LSV for 2,000, 3,500 and 8,000 cycles, respectively.
(b) (b)
(a) (a)
Int. J. Electrochem. Sci., Vol. 11, 2016
1019
Figure 4. XRD patterns of PtCo/C and TiO2-PtCo/C catalysts (a) before and (b) after stability test by repetitive LSV for 2,000, 3,500 and 8,000 cycles, respectively.
Table 1. Morphology of fresh PtCo/C, TCOM-PtCo/C and T,CVD-PtCo/C catalysts.
Catalysts d-spacing (A°) Crystallize size (nm) Pt : Co ratio (wt. ratio) (mESA 2/g Pt) Contact angle (degree) Pt/C 2.26 PtCo/C 2.22 9.4 52:48 55.3 88.7 TCOM-PtCo/C 2.22 9.5 51:49 79.6 35.9 TCVD-PtCo/C 2.22 9.3 55:45 121 0
Figure 5. Representative cyclic voltammetry of PEM fuel cells with pure TiO2 and fresh TiO2-PtCo/C catalysts in N2 -saturated 0.5 M H2SO4 at scan rate of 20 mV/s.
3.2 Activity of TiO2-PtCo/C catalysts
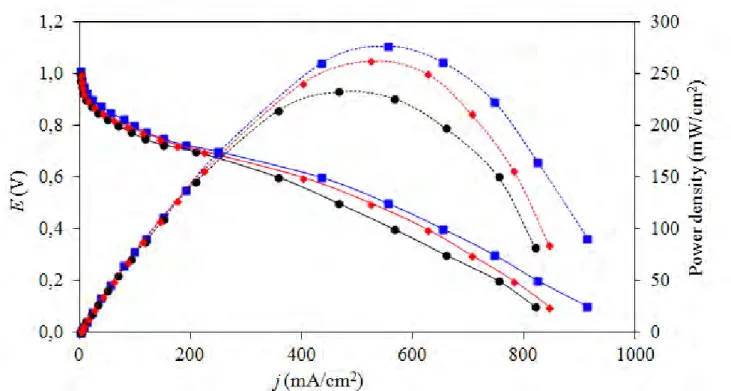
The activity of all three PtCo/C catalysts was then tested in a single PEM fuel cell under H2/O2 at atmospheric pressure and temperature of 60 oC. As clearly seen in Figure 6, the T
CVD-PtCo/C exhibited the highest current density (20.5 mA/cm2) compared with that of T
COM-PtCo/C (12.6 mA/cm2) and PtCo/C (10.1 mA/cm2) catalysts at 0.9 V. It also exhibited the highest current density (434 mA/cm2 or 2,893 A/gPtcm2) as well as power density (277 mW/cm2 or 1,847 W/g
Ptcm2) at 0.6 V during the medium-through-high current density region. This suggests that the TCVD-PtCo/C catalyst had the highest activity in the PEM fuel cell, probably attributed to its highest ESA as well as its hydrophilic property (Table 1) measured in terms of water contact angle. TiO2 can improve the hydrophilic properties of the catalyst layer in fuel cells as well as the membrane drying out, resulting in the increasing proton conductivity as well as decreasing ohmic resistance in actual operation.
This is also supported by previous work which reported that the oxygen atom could be adsorbed on the TiO2 surface in the similar adsorbed state as Pt surfaces [19, 20], suggesting that the addition of TiO2 on the surface of catalyst layer can also enhance the ORR activity of PtCo/C catalyst.
3.3 Stability of TiO2-PtCo/C catalysts
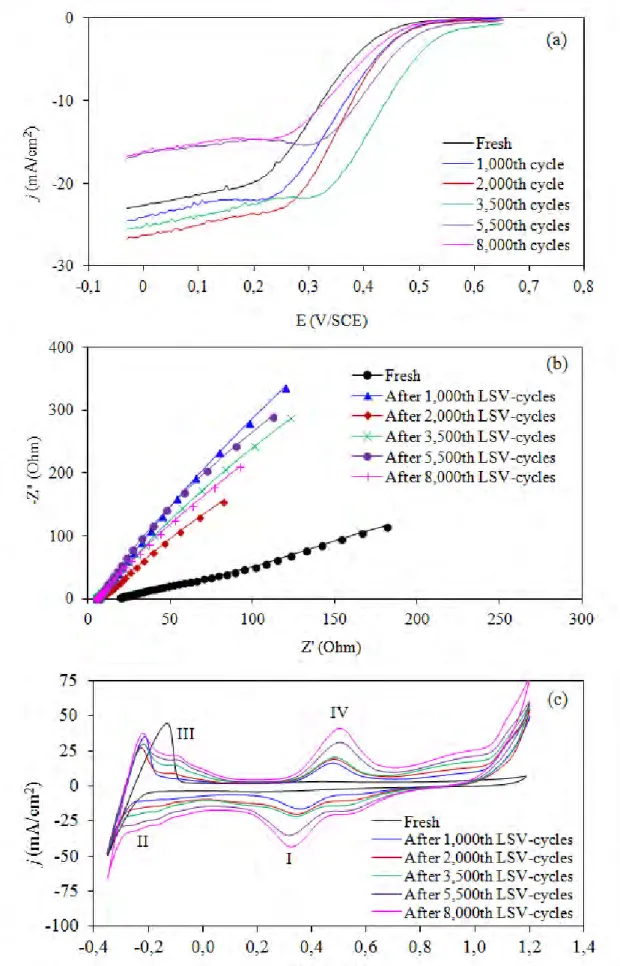
To test the stability of all prepared catalysts, the repetitive LSV was conducted in 0.5 M H2SO4. Figure 7 shows example plots obtained from the stability test of the TCVD-PtCo/C catalyst at particular LSV cycles. A well-defined polarization curve for ORR with the thin film electrode fabrication was observed for all repetitive cycles (Figure 7(a)). The value of the limiting current (jL), the maximum
Int. J. Electrochem. Sci., Vol. 11, 2016
1021
current density occurs when the concentration of reactant species at the electrode surface becomes zero, obtained from this plot can be used to determine the ORR performance [21-23]. As obvious appearance, it increased during the first 2,000 LSV-cycles and decreased importantly when the testing cycle was prolonged to 8,000 cycles.
The complex plane representation obtained from the EIS measurement after the particular LSV cycle is demonstrated in Figure 7(b). Linear spectra originating from the x-axis with positive slope value deviating from 45o were observed, suggesting that this system comprised two circuit elements, resistant and constant phase element (CPE) [24]. With this electrochemical configuration, the obtained resistance is the electrolyte resistance (R), which could be used to monitor the variation of electrolyte conductivity. A low value of R exhibited a high electron conductivity of the electrolyte. From the plot, it seems to be that the value of R decreased with increasing repetitive LSV cycles.
For the CV measurement, a fresh TCVD-PtCo/C catalyst exhibited only a clear hydrogen desorption peak at a potential of -0.18 V/SCE. After repetitive LSV cycles were conducted, an adsorption peak of the oxygen atom on the catalyst surface (Pt-O) was observed at +0.39 V/SCE after 1,000 LSV-cycles (peak I). The downfield shift of the reduction potential was observed as increasing repetitive LSV cycles, probably due to an electronic charge accumulation on the electrocatalyst-electrolyte interface and the generation of a high double-layer charging current, due to a strongly adsorbed hydride and oxide layers on the catalyst surface [25]. High intensity of hydrogen adsorption (region II)/desorption peak (region III) with a more pronounced peak segregation to Pt[100] and Pt[110] was observed as the increasing repetitive LSV cycle. This suggests an increase of ESA as well as an alternation of crystalline structure of the Pt catalyst. The intensity of the oxide formation peak (Pt-OH and then Pt-O, region IV) also increased with the increase of the LSV cycles.
Figure 6. Current density-potential curves of the as-prepared () PtCo/C, () TCOM-PtCo/C and () TCVD-PtCo/C catalysts in a single H2/O2 PEM fuel cell.
Figure 7. Example plot of stability test for TCVD-PtCo/C catalyst obatined from (a) LSV, (b) EIS and (c) CV measurement in 0.5 M H2SO4.
Int. J. Electrochem. Sci., Vol. 11, 2016
1023
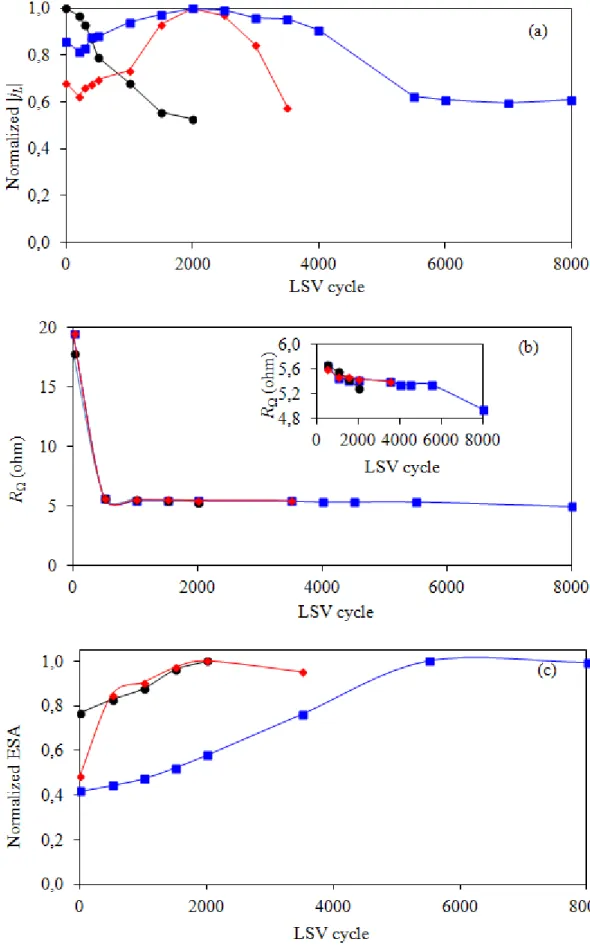
Figure 8 sumarizes the variation of normalized jL, R and nomalized ESA as a function of repetitive LSV cycles in 0.5 M H2SO4. The normalized jL of the PtCo/C catalyst decreased drastically
after the beginning of the stability test. The semilar variation trend of normalized jL was observed for
both TCOM-PtCo/C and TCVD-PtCo/C catalysts (Figure 8(a). They increased during the early period of the LSV cycles to reach their maximum value (1.0) at 2,000th LSV-cycle and then drop drastically, suggesting the start up of catalyst degradation after the 2,000 LSV-cycle. Importantly, the drop of normalized jL of the PtCo/C catalyst was low pronounced in the presence of TiO2, probably due to an excellent corrosion resistance property of TiO2 both in acid and alkaline environments [26, 27]. To explore the corrosion behavior of all PtCo/C catalysts, the corrosion experiment was carried as demonstrated Figure 9. From this plot, the corrosion parameters were estimated and summarized in Table 2. The addition of either TCOM or TCVD to PtCo/C catalyst led to the shift of corrosion potential to more negative values and the decrease of corrosion current density compared with that of PtCo/C catalyst. This suggests that the rate of the anodic reactions or corrosion of PtCo/C decreased in the presence of TiO2. Also, both TiO2 promoted PtCo/C catalysts exhibited a low value of Tafel slope compared with the original PtCo/C catalyst, confirming that either TCOM-PtCo/C or TCVD-PtCo/C catalysts had more corrosion resistance than that of the PtCo/C one. In summary, the corrosion current density of TCOM and TCVD were 0.515 and 0.095 mA/cm2, lower than that of sGDL of 0.12 and 0.68-fold, respectively. When they were incorporated on the PtCo/C catalyst layer, they can reduce the corrosion current density of PtCo/C catalyst significantly. Namely, the corrosion current density of PtCo/C catalyst was reduced from 13.7 mA/cm2 to 8.2 and 4.5 mA/cm2, when T
COM and TCVD were respectively added on the PtCo/C catalyst (Table 2). The TCVD can promote a more corrosion resistance of PtCo/C catalyst than TCOM, probably due to the different TiO2 incorporation technique into the sGDL. The incorporation of TCOM by direct spray might provide a non-adhesive TiO2 layer on the sGDL, while the CVD technique induced under high temperature and low pressure (350 oC and 0.026 atm) could enhance the adhesion with a carbon layer providing an impregnable TiO2 layer.
Regarding the alternation of the R value with the increasing repetitive LSV cycle, the drastically decreasing R was observed after the 500th-LSV cycle for all prepared catalysts (Figure 8(b)), suggesting an increase in electrical conductivity of the acid electrolyte. This is probably due to the dissolution of the metal catalyst into the electrolyte. As the LSV cycles increased to greater than 500 cycles, a slight decrease of R of all prepared catalysts was observed. More decrease of R was observed for the PtCo/C catalyst, suggesting increased electrolyte conductivity, or in other words, more metal dissolution into the acid electrolyte than other prepared catalysts, which is agreeable with the corrosion rate as listed in Table 2.
With regard to ESA, the ESA of all prepared catalysts increased noticeably with increasing repetitive LSV cycles to reach the maximum value (1.0) and then dropped afterward with the prolonged LSV cycles (Figure 8(c)). The increase of ESA during the early period of the LSV cycles was probably due to the initial wetting behavior of the thin Nafion layer covering the catalyst particles [23]. The maximum ESA of the TCOM-PtCo/C catalyst was found at 2,000th LSV-cycles, corresponding to the maximum jL. However, the ESA of the TCVD-PtCo/C catalysts still increased and reached the maximum value at 5,000th LSV-cycles, which was inconsistent with the variation of j
Figure 8. Variation of (a) limiting current (jL), (b) ohmic resistance and (c) ESA of () PtCo/C, ()
TCOM-PtCo/C and () TCVD-PtCo/C catalysts during the stability test by repetitive LSV in 0.5 M H2SO4.
Int. J. Electrochem. Sci., Vol. 11, 2016
1025
Figure 9. Electrochemical polarization curves of PtCo/C and TiO2-PtCo/C catalysts in 0.5 M H2SO4 with the scan rate of 1 mV/s.
Table 2. Corrosion parameters.
Catalysts Corrosion potential (E corr, V)
Tafel slope
(b, mV/dec) density (jCorrosion current corr, mA/cm2)
sGDLC -0.331 0.160 0.576 TCOM -0.332 0.248 0.515 TCVD -0.331 0.239 0.095 PtCo/C -0.255 0.446 13.7 TCOM-PtCo/C -0.262 0.285 8.15 TCVD-PtCo/C -0.267 0.249 4.54
Table 3. Morphology of PtCo/C, TCOM-PtCo/C and TCVD-PtCo/C catalysts after stability test by repetitive LSV for 2,000, 3,500 and 8,000 cycles, respectively.
Catalysts d-spacing
(A°) Crystallize size (nm) Pt : Co ratio (wt. ratio) (mESA 2/gPt)
PtCo/C 2.28 11.6 100:0 114
TCOM-PtCo/C 2.27 11.4 100:0 93.9
TCVD-PtCo/C 2.27 11.1 100:0 110
tendency of ESA after stability tests showed that the Hupd adsorption/desorption on the Pt surface is more improved for age surfaces than fresh surfaces due to the dissolution of Co [28]. Thus, the presence of a high quantity of Co atoms at the near-surface region deducted the Hupd charge density
[29, 30]. To prove this hypothesis, the metal composition of all prepared catalysts after the stability test was again measured. As demonstrated in Table 3 and the insert of Figure 10, all prepared catalysts after the stability test lost Co and Ti contents from their structures, resulting in an increase of ESA with increasing repetitive LSV cycles. The inconsistent trend between the ESA and jL might be attributed to
the change of catalyst morphology after the stability test. As shown in Figure 4(b), the more sharp
Figure 10. SEM micrographs of crystalline particles and EDX spectra of (a) PtCo/C, (b) TCOM-PtCo/C and (c) TCVD-PtCo/C catalysts after stability test by repetitive LSV for 2,000, 3,500 and 8,000 cycles, respectively.
XRD peaks of Pt compared with the fresh catalyst and they shifted to a low angle closer to the pure Pt peak while no TiO2 peaks were observed, indicating respectively the loss of carbon support, alloy property as well as the TiO2 elements during the stability test. Furthermore, their d-spacing was close to that of pure Pt, and the crystallize size of all catalysts increased around 1.2-fold after the stability
(b) (b)
(c) (c)
(a) (a)
Int. J. Electrochem. Sci., Vol. 11, 2016
1027
test (Table 3). This is due to the catalyst agglomeration as confirmed by the SEM images (Figure 10), owing to the carbon-support loss and Ostwald ripening [31, 32]. The dissolution behavior of metal elements from Pt-M alloy under the 0.5 M H2SO4 solution was already proved and explained elsewhere [31, 33] in which the M atoms at the first top layer will dissolve, and Pt atoms will diffuse on the surface and accumulate to form a cluster on the surface. Finally, the surface of the Pt alloy will become completely covered with Pt atoms, which is consistent with this study’s results.
Based on the obtained results, although all prepared PtCo/C catalysts lost their stability after testing in 0.5 M H2SO4 using the LSV, catalyst deterioration was ranked as the order of PtCo/C > TCOM-PtCo/C > TCVD-PtCo/C. Approximately 40% of performance loss was observed for PtCo/C, TCOM-PtCo/C and TCVD-PtCo/C after 1,300, 3,300 and 6,000 LSV-cycles. This suggests that a home-prepared TCVD can enhance the stability and durability of PtCo/C catalyst due to its excellent corrosion resistance property and its preparation/incorporation technique.
4. CONCLUSIONS
The comparative study of PtCo/C catalyst activity and stability in the presence of different types of TiO2 (TCOM and TCVD) was explored in PEM fuel cells and an acid electrolyte (0.5 M H2SO4). Both TiO2 (TCOM and TCVD) had a similar particle size, but in different phases. The TCOM was in a mixed phase of rutile and anatase, while TCVD was in a pure anatase. When both were incorporated on the PtCo/C catalyst, the TCVD-PtCo/C catalyst exhibited higher ESA and super hydrophilic property compared with the PtCo/C and TCOM-PtCo/C catalysts, which could thus induce the highest performance in PEM fuel cells. Regarding the stability test by the repetitive LSV, the drastic drop of normalized jL was observed for the PtCo/C catalyst, while that of the TiO2-PtCo/C catalyst increased to its maximum value at around 2,000 LSV-cycle and dropped afterward. The impedance spectra displayed the decrease of electrolyte resistance along the repetitive LSV, due to the dissolution of metal elements into the electrolyte. The ESA of the catalyst increased with the increasing LSV cycles, due to the dissolution of the Co atom from the catalyst layer and the change of the Pt crystalline structure. In summary, a home-prepared TCVD exhibited an effective property to enhance the activity and stability of the PtCo/C catalyst, which can produce the current density of 434 mA/cm2 (277 mW/cm2) at 0.6 V with performance loss of around 40% after a 6,000 LSV-cycle, due to its excellent corrosion resistance property and preparation/incorporation technique.
ACKNOWLEDGEMENTS
The authors would like to thank the Royal Golden Jubilee Ph.D. Program of the Thailand Research Fund (Grant No. PHD/0338/2552) and the Embassy of France in Thailand for financial support.
References
1. E. Antolini, J.R.C. Salogado and E.R.Gonzalez, J. Power Sources, 160 (2006) 957.
2. W. Agnieszka, D. Sonia, P. Emiliano, M. Roberto, D.C. Andrea and R.A. Valerio, J. Power
3. B.C. Beard and P.N. Ross Jr, J. Electrochem. Soc., 137 (1990) 3368.
4. N.M. Markovic, T.J. Schmidt, V. Stamenkovic and P.N. Ross, Fuel cells, 1 (2001) 105.
5. E. Antolini, J.R.C. Salgado, M.J. Giz and E.R. Gonzalez, Int. J. Hydrogen Energ., 30 (2005) 1213. 6. S. Koh, J. Leisch, M.F. Toney and P. Strasser, J . Phys. Chem. C., 111 (2007) 3744.
7. K. Fugane, T. Mori, D.R. Ou, A. Suzuki, H. Yoshikawa, T. Masuda, K. Uosakia, Y. Yamashita, S. Ueda, K. Kobayashi, N. Okazaki, I. Matolinova and V. Matolin V, Electrochim. Acta, 56 (2011) 3874.
8. S. Gustav, M. Steffen, Q. Antje, S. Florian, J. Sven, K. Angela and B. Volker, J. Power Sources, 268 (2014) 255.
9. S. Takenaka, A. Hirata, E. Tanabe, H. Matsune and M. Kishida, J. Catal., 274 (2010) 228. 10. S.Y. Huang, P. Ganesan and B.N. Popov, ACS Catal., 2 (2012) 825.
11. S.Y. Huang, P. Ganesan and B.N. Popov, Appl. Catal. B, 102 (2011) 71.
12. N. Cheng, J. Liu, M.N. Banis, D. Geng, R. Li, S. Ye, S. Knights and X. Sun, Int. J. Hydrogen
energ., 39 (2014) 15967.
13. W. Trongchuankij, K. Poochinda, K. Pruksathorn and M. Hunsom, Renew. Energ., 35 (2010) 2839. 14. S. Yin, S. Mu, H. Lv, N. Cheng, M. Pan and Z. Fu, Appl. Catal. B-Environ., 93 (2010) 233.
15. J.B. Xu, T.S. Zhao, W.W. Yang and S.Y. Shen, Int. J. Hydrogen Energ., 35 (2010) 8699. 16. S.C. Zignani, E. Antolini and E.R. Gonzalez, J. Power Sources, 191 (2009) 344.
17. T. Lopes, E. Antolini and E.R. Gonzalez, Int. J Hydrogen Energy, 33 (2008) 5563.
18. N. Chaisubanan, K. Pruksathorn, H. Vergnes and M. Hunsom, Korean J. Chem. Eng., 32 (2015) 1305.
19. H. Steininger, S. Lehwald and H. Ibach, Surf. Sci., 123 (1982) 1.
20. H.L. Nguyen, Q.N. Tien, A.D. Wilson and K. Hideaki, Surf. Sci., 633 (2015) 38.
21. K. Hyun , J.H. Lee, C.W. Yoon and Y. Kwon, Int. J. Electrochem. Sci., 8 (2013) 11752.
22. L. Lai, J.R. Potts, D. Zhan, L. Wang, C.K. Poh, C. Tang, H. Gong, Z. Shen, J. Lin and R.S. Ruoff,
Energ. Environ. Sci., 5 (2012) 7936.
23. U.A. Paulus, A. Wokaun, G.G. Scherer, T. J. Schmidt, V. Stamenkovic, V. Radmilovic, N.M. Markovic and P.N. Ross, J. Phys. Chem. B., 106 (2002) 4181.
24. M. Hunsom, Electrochemical impedance spectroscopy (EIS) for PEM fuel cells in Spectroscopic Properties of Inorganic and Organometallic Compounds edited by J. Yarwood, R. Douthwaite, S.B. Duckett, M. Antonietta Ricci, J. Axel Zeitler, Royal Society of Chemistry 2012.
25. H.R. Colon-Mercado and H. Kim, Electrochem. Commun., 6 (2004) 795.
26. Z.Z. Jiang, D.M. Gu, Z.B. Wang, W.L. Qu, G.P. Yin and K.J. Qian, J. Power Sources, 196 (2011) 8207.
27. C. Odetola, L. Trevani and E.B.Easton, J. Power Sources, 294 (2015) 254. 28. S. Ohyagi and T. Sasaki, Electrochim. Acta, 102 (2013) 336.
29. S. Hidai, M. Kobayashi, H. Niwa, Y. Harada, M. Ohshima, Y. Nakamori and T. Aoki, J. Power
Sources, 196 (2011) 8340.
30. L. Dubau, F. Maillard, M. Chatenet, J. Andre and E. Rossinot, Electrochim. Acta, 56 (2010) 776. 31. Y. Hoshi, T. Yoshida, A. Nishikata and T. Tsuru, Electrochim. Acta, 56 (2011) 5302.
32. S.V. Selvaganesh, P. Sridhar, S. Pitchumani and A.K. Shukla, J. Electrochem. Soc., 160 (2013) F49.
33. H.W. Pickering and C. Wagner, J. Electrochem. Soc., 114 (1967) 698.
© 2016 The Authors. Published by ESG (www.electrochemsci.org). This article is an open access article distributed under the terms and conditions of the Creative Commons Attribution license (http://creativecommons.org/licenses/by/4.0/).