A quality of experience based approach for wireless mesh networks
Texte intégral
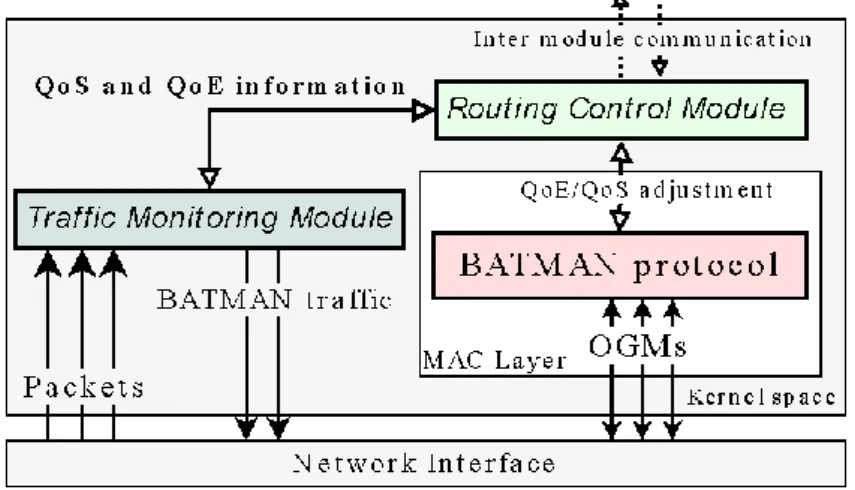
Figure
Documents relatifs
x Each anchor node is composed of two sensors ( a bar containing two microphones), installed in such a manner that the bars of the different adjacent anchors are
A Wireless Real-Time Monitoring Node of the Physiological Signals for Unrestrained Dairy Cattle Using Wireless Sensor Network.. Third IFIP TC 12 International Conference on Computer
It appears from the above results that in the congested case, the estimated mean risk function developed in this paper is able to predict accident of each traffic situation
Unit´e de recherche INRIA Rennes, Irisa, Campus universitaire de Beaulieu, 35042 RENNES Cedex Unit´e de recherche INRIA Rh ˆone-Alpes, 655, avenue de l’Europe, 38330 MONTBONNOT
A multi-queuing system combining priority queues for real time traffic and CBWFQ queues for elastic traffic is treated using simulation in [25].. The integration of real time
The airport must be able to handle a large number of aircraft at the same time (for the reasons detailed above.) The airline must also have the facilities to
Recently, in a close cooperation with the National Institute of Standards and Technology (NIST), USA, NRC has established a prototype ac Josephson Voltage
6.3 Results for Asymmetrically Loaded, Undercoupled Cavities. 93 6.4 Results for Asymmetrically Loaded, Overcourped Cavities. THE BEHAVIOR OF TWO RESONANT
