This is the peer reviewed version of the following article:
Campbell, Malcolm, Philippe Apparicio, and Peter Day. 2014. "Geographic analysis of infant mortality in New Zealand, 1995–2008: an ethnicity perspective." Australian and New Zealand Journal of Public Health 38 (3):221-226. doi: 10.1111/1753-6405.12222.
which has been published in final form at http://dx.doi.org/10.1111/1753-6405.12222. This article may be used for non-commercial purposes in accordance with Wiley Terms and Conditions for Self-Archiving."
Geographic analysis of infant mortality in New Zealand, 1995–2008: an
ethnicity perspective
Malcolm Campbell,1 Philippe Apparicio,2 Peter Day1
1. Department of Geography, University of Canterbury, New Zealand
2. Centre Urbanisation Culture Societe, Institut National de la Recherche Scientifique, Montreal, Canada
Abstract
Objective: To detect spatial clusters of high infant mortality rates in New Zealand for Māori and non-Māori populations and verify if these clusters are stable over a certain time period (1995-2008) and similar between the two populations.
Method: We applied the Kulldorff’s spatial scan statistics on data collected by New Zealand Ministry of Health (1995 to 2008) at the territorial local authorities (TLA) level. Kappa coefficient was used to assess the concordance between clusters obtained for Māori and non-Māori populations. T-test analyses were conducted to identify associations between spatial clusters and two predictors (population density and deprivation score).
Results: There are some significant spatial clusters of infant mortality in New Zealand for both Māori and Non-Māori. The concordance of the cluster locations between the two populations is strong (kappa=0.77). Unsurprisingly, infant mortality clusters for both Māori and Non-Māori are associated with the deprivation score. The population density predictor is only significantly and positively associated with clusters obtained for the non-Māori population. After controlling for deprivation the presence of spatial clusters is all but eliminated.
Conclusions: Infant mortality patterns are geographically similar for both Māori and Non-Māori. However, there are differences geographically between the two populations after accounting for deprivation.
Implications: Health services which can affect infant mortality should be aware of the geographical differences across NZ. Deprivation is an important factor in explaining infant mortality rates and policies which ameliorate its effects should be pursued as it is the major determinant of the geographical pattern of infant mortality in NZ.
Key words: Infant Mortality, Clusters, Spatial Epidemiology, Ethnicity, New Zealand, Public Health
Background
It is widely accepted today that infant mortality, defined as the number of deaths of children under one year of age per 1000 live births, is an important indicator of the health of a country’s population [1-3]. Despite declines experienced over the last few decades internationally, New Zealand’s (NZ) infant death rate remains high. To compare, NZs infant death rate (5.1) is similar to the United Kingdom’s (5.0) and within the OECD in 2006, this rate varies from 1.4 to 22.3[4], with NZ coming 27 out of 34 countries (Figure 1).
In recent decades, particular attention has been paid to factors associated with high infant mortality, but also on the disparities in infant mortality rates among countries. The influence of biological factors, such as weight, preterm birth mothers age as well as social factors; the socio-economic position of the family, maternal education level, mother’s country of birth, birth registered solely by the mother [5-8]are all important determinants of infant mortality. International comparative studies show that infant mortality rates gradually vary from one country to another [4, 9-13].
Other studies have focused on showing important variations in infant mortality rates within a country or a region and in different geographical contexts, particularly in Austria [14], Brazil
[15], South Africa [2, 16], West Africa [17, 18], Michigan [19] and in Alexandria (Egypt)
[20]. Racial and ethnic disparities in infant mortality have been largely documented, especially in the U.S. [21-23]. Finally, other studies have demonstrated that infant mortality rates are higher for the indigenous children in several countries [24, 25]. The indigenous dimension is also particularly important in infant mortality analysis in New Zealand. Although recently it has clearly diminished within the Māori population, there still remains a 3 percentage point difference between the infant mortality rates of the Māori and non-Māori populations (Figure 2).
At present, it would appear that no study has addressed the subject of spatial disparities of infant mortality in New Zealand beyond simple descriptive analysis as reported in Ministry of Health documents [26] or by the New Zealand Paediatric Society [27]. Nevertheless, as put forward by Sartorius and colleagues [2, 16], the spatial variations of infant mortality has implications for health policy interventions, as it can help target areas to deploy specific
interventions to tackle infant mortality. Furthermore, it is possible that these areas would be different for Māori and non-Māori populations.
Consequently, the objectives of this paper are twofold. Firstly, we want to identify clusters of infant mortality rates in New Zealand for Māori and non-Māori populations and verify if these clusters are stable over a certain time period. Secondly, we compare the location of the clusters obtained for both populations. By doing so, we verify if the geographic patterns of infant mortality for the Māori population are statistically different compared with the non-Māori population.
Methods
Study area and population and geographic data
The data on infant mortality were obtained from the New Zealand Ministry of Health. The geographic analysis is based on 72 territorial local authorities (TLA) (from the 2006 Census mean population size=58 105, median=33 950, interquartile range = 14 875-56 975; mean area size=3 667 km2, median=2 383 km2, interquartile range = 1 151-4 664 km2), covering the whole country, with the exception of the Chatham Islands. Three datasets were available. The first one contains 1 632 783 live births and 13 110 infant deaths (under one year old) for the whole population, recorded between 1980 and 2008. The two other datasets correspond to a shorter period (1995-2008) and are for the Māori and non-Māori populations with respectively 228 821 and 580 652 live births and 2 821 and 1 893 infant deaths. Mortality data collected prior to September 1995 on ethnicity is different to data after this point due to a definitional change [28] with the result that Māori death rates were undercounted and therefore increased due to this change.
Statistical methods
To identify TLAs with significantly high incidence rates of infant mortality for both populations, we used Kulldorff’s spatial scan statistics, assuming that the incidence of infant mortality follows a Poisson distribution. The analyses were conducted in SatScan software (version 9.1.1.) [29], by setting the parameters as such: a scan for areas with only high rates, an ellipse as a spatial window shape, 50% of the total population as the maximum spatial cluster size, 9 999 Monte-Carlo replications to test for statistical significance, and years as time precision. It is worth noting that SatScan is largely used in epidemiological studies to
detect clusters of various types of cancer [30-35], but also of low birth weight and infant mortality [19].
In practical terms, the elliptic window scans the study area with different shapes and angles that will never reach more than half the total live births. Under the Poisson assumption, the likelihood function compared the observed and expected numbers of infant deaths for each scanning window as follows:
d D d d E D d D d E d LR where D is the total number of infant deaths over the whole area, d is the infant deaths within the scanning window, and E[d] is the expected number of infant deaths within the window under the null hypothesis:
d p D PE * /
where d and D are defined above, p and P are respectively the live births within the scanning window and in New Zealand.
Two types of clusters are identified by the The Kulldorff’s scan statistics identify: the most likely cluster and secondary clusters in descending order according to their significance (P value). For each cluster, output results contains the number of the territorial local authorities (TLA), the observed and excepted numbers of infant deaths, the annual cases per 1000 live births, the relative risk, the log likelihood ratio and its P value. The relative risk is the ratio between “observed divided by the expected within the cluster divided by the observed divided by the expected outside the cluster” ([29]):
( )/(
)
/ ) /( ) ( / d E D d D d E d d E D E d D d E d RR For a detected cluster, a RR value greater than 1 indicates a high infant mortality rate area in comparison with the rest of New Zealand.
In order to assess if the locations of the clusters for the populations are stable over a certain period, four spatial analyses were carried out: the whole period (1995-2008), and three sub-periods (1995-1999, 2000-2004 and 2005-2008). Since it has been amply demonstrated that infant mortality is associated with social deprivation, these four analyses were also carried out adjusting for social deprivation. The New Zealand deprivation index (NZDep2006) is
constructed from nine variables which included; no telephone; unemployed; single parent families; no qualifications; non home owners; no access to car; occupancy threshold[36]. More specifically, occupancy is a measure of housing space available and persons usually resident in the house (i.e. overcrowding). Finally, to assess the similarity of the Māori and non-Māori infant mortality clusters obtained for these four periods, the well-known Cohen’s Kappa coefficient was used [37]. In short, the statistic allows to evaluate the degree of concordance between two nominal variables with identical categories. Here, the variables could be divided in three categories: a TLA which belongs to the most likely cluster of infant mortality, a TLAs which belongs to a secondary cluster, and a TLA not included in a significant cluster. According to the values of the Kappa coefficient, which varies between 0 and 1, the degree of concordance will be determined as follows: poor (k < 0.2), fair (0.2 ≤ k < 0.4), moderate (0.4 ≤ k < 0.6), good (0.6 ≤ k < 0.8); excellent (k > 0.8), and perfect (k=1). Results
Spatial analysis of infant mortality
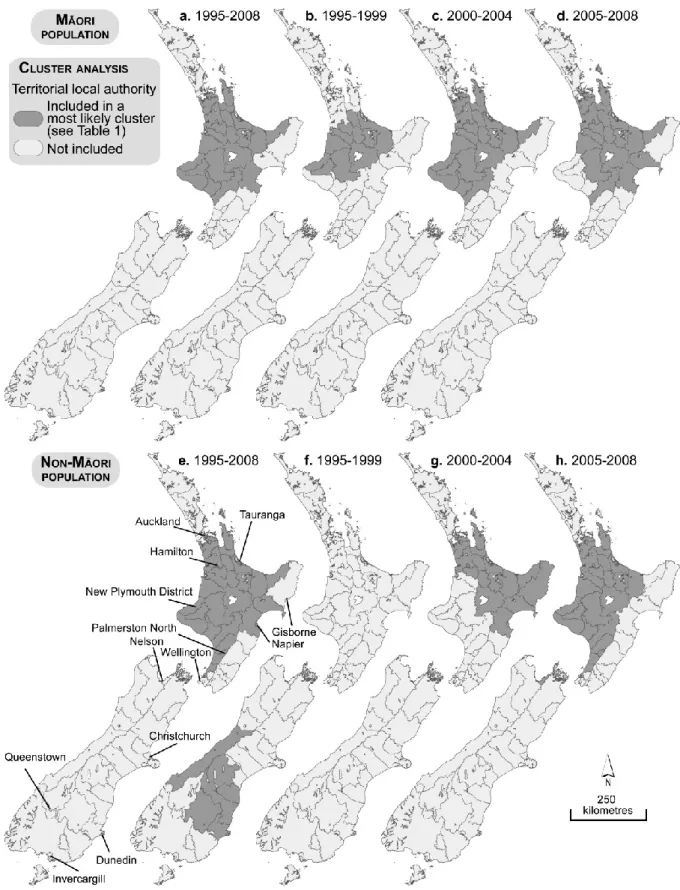
Kulldorff's spatial scan statistics allows the identification of several clusters for both populations. Note that only the significant clusters are reported (P<0.10), with the exception of the cluster for the non-Māori population for the 1995-1999 period (Table 1 and Figure 3). In applying this significance threshold, only the most-likely clusters are significant. In other words, the secondary clusters are not significant.
For the Māori population, SatScan found a most likely cluster which groups 26 TLAs located in the North Island during the whole period (1995-2008). In this area, the Māori infant mortality incidence rate is 26% higher than in the rest of the country (relative risk = 1.26; P=0.001). The results obtained for the three sub-periods are quite similar: clusters are also located in the North Island with respectively 14 (1995-1999), 25 (2000-2004) and 25 TLAs (2005-2008). Values of the Kappa coefficient reported in Table 2, all above or equal to 0.60, reinforce the idea of a certain geographical stability of clusters all through the period.
However, the clusters’ stability seems more limited for the non-Māori. First, the number of TLAs belonging to the most likely cluster varies a lot: 34 for the whole period (1995-2008), as compared to 6, 22 and 30 for the three sub-periods. Then, for the 1995-1999 sub-period, even with the non-significant cluster (p=0.477), it regroups six TLAs located on the South
Island, whereas all the others are present on the North Island (Figure 3.e to 3.h). The lowest Kappa values support this observation (Table 2).
We can also note that for the whole period (1995-2008), the clusters of both populations are quite similar with relative risks almost identical (1.26 for the Māori population versus 1.25 for the non-Māori population) and a geographical localization fairly similar on the North Island. Thus, their degree of concordance is good as shown by the Kappa statistic (0.77). To characterize these clusters, we have retained two variants from the 1996, 2001 and 2006 Census of New Zealand: population density (inhabitants per square kilometre) and deprivation score. Then, both selected predictors were analysed separately by performing an independent group T-test in order to compare the average values of the TLAs belonging to the most likely cluster, and those of the TLAs which were not included in a cluster (Table 3). This analysis was conducted by using the SAS PROC TTEST procedure [38]. The first interesting observation, except for the 1995-1999 sub-period, is that all the non-Māori population clusters contain TLAs with a significantly more elevated population density, whereas for the Māori population, this predictor is always not significant (Table 3). Second, the deprivation score is always significant no matter which population is being studied, except for the 1995-1999 non-Māori cluster (p=0.155) which contains only six TLAs located in the South Island where the deprivation score is weaker. Indeed, unsurprisingly, the TLAs belonging to an infant mortality cluster always exhibited a higher level of deprivation (Table 3). This corroborates the studies which mention that infant mortality is highly associated with poverty (similar but not the same as deprivation), and clearly demonstrates a necessity to control for this factor when identifying spatial clusters [5, 7, 8].
Spatial analysis adjusted by for deprivation
Once we control the poverty levels by using the deciles of deprivation, the presence of infant mortality clusters is more limited. On the one hand, many most-likely clusters become non statistically significant, particularly for the non-Māori population (Table 4). On the other hand, the number of TLAs belonging to these clusters is very limited, varying from 1 to 8. Finally, analyses conducted for the three sub-periods show that clusters are not very stable geographically as some of them are localized on the North Island while others are in the South Island (Figure 4).
Discussion
This study has highlighted the importance of ethnic differences seen elsewhere, but specifically the unique Māori versus non-Māori dimension observed in New Zealand. However, it could be argued that the importance of deprivation is key to understanding these ethnic differences. Other studies worldwide [2, 9, 14-16, 19-23] corroborate our findings that there are important geographical variations within countries or regions, which also exist in New Zealand. Therefore, the Kulldorff's spatial scan statistics have proven to be an effective tool to identify areas with high incidence rates where it could be relevant to deploy specific interventions to reduce infant mortality.
There is also a consistent Māori disadvantage over time compared with non-Māori. Although the overall trends are tracking downwards, which is positive, there remains a consistent 'gap' over time, which could, or should, be reduced.
The North island of New Zealand exhibits the largest and most consistent spatial cluster of infant mortality for both Māori and non-Māori, from south Auckland to New Plymouth covering most of the central North island. It is important to emphasise that this cluster almost disappears once deprivation is controlled for, which again strongly suggests that policies which target deprivation will have an impact on the higher infant mortality rates for areas within New Zealand. Similarly, in a study in England, [39] looking at infant mortality rates deprivation was found to be a significant predictor of increased rates, but only one ethnicity was significantly associated with increased rates of infant mortality. In metropolitan areas in the United States, the effect of high-poverty was again a significant predictor of infant mortality rates, but regional factors were also important [40]. This illuminates some important international differences. It could be argued that the most effective way of reducing both geographical and ethnic inequalities would be to target the most deprived areas in New Zealand.
In terms of limitations of this study it is important to note the changing definition of the Māori ethnicity as well as the ecological fallacy, noting that what may be true for an area may not be true for individuals within that area.
References
1. Reidpath, D.D. and P. Allotey, Infant mortality rate as an indicator of population health. Journal of Epidemiology and Community Health, 2003. 57(5): p. 344-346.
2. Sartorius, B.K.D., et al., Young and vulnerable: Spatial-temporal trends and risk factors for infant mortality in rural South Africa (Agincourt), 1992-2007. BMC Public Health, 2010.
10.
3. Wise, P.H., The anatomy of a disparity in infant mortality. 2003. p. 341-362. 4. OECD, OECD Health Data 2011 online database. 2011.
5. Dallolio, L., et al., Socio-economic factors associated with infant mortality in Italy: An ecological study. International Journal for Equity in Health, 2012: p. 45.
6. Office for National statistics, Infant and perinatal mortality in England and Wales by social and biological factors, 2011. 2011, Statistical Bulletin: London. p. 12.
7. Olson, M.E., et al., Impact of income and income inequality on infant health outcomes in the United States. Pediatrics, 2010. 126(6): p. 1165-1173.
8. Schell, C.O., et al., Socioeconomic determinants of infant mortality: A worldwide study of 152 low-, middle -, and high-income countries. Scandinavian Journal of Public Health, 2007. 35(3): p. 288-297.
9. Heisler, E.J., The U.S. infant mortality rate: International comparisons, underlying factors, and federal programs. 2012, Congressional Research Service: Washington D.C. p. 30. 10. Joseph, K.S., et al., Influence of definition based versus pragmatic birth registration on
international comparisons of perinatal and infant mortality: Population based retrospective study. BMJ (Online), 2012. 344(7847).
11. Pamuk, E.R., R. Fuchs, and W. Lutz, Comparing relative effects of education and economic resources on infant mortality in developing countries. Population and Development Review, 2011. 37(4): p. 637-664.
12. Regidor, E., et al., The role of political and welfare state characteristics in infant mortality: A comparative study in wealthy countries since the late 19th century. International Journal of Epidemiology, 2011. 40(5): p. 1187-1195.
13. Li, J., C. Luo, and N. De Klerk, Trends in infant/child mortality and life expectancy in Indigenous populations in Yunnan Province, China. Australian and New Zealand Journal of Public Health, 2008. 32(3): p. 216-223.
14. Waldhoer, T., M. Wald, and H. Heinzl, Analysis of the spatial distribution of infant mortality by cause of death in Austria in 1984 to 2006. International Journal of Health Geographics, 2008. 7.
15. Barufi, A.M., E. Haddad, and A. Paez, Infant mortality in Brazil, 1980-2000: A spatial panel data analysis. BMC Public Health, 2012. 12(1).
16. Sartorius, B.K.D., et al., Infant mortality in South Africa - distribution, associations and policy implications, 2007: an ecological spatial analysis. International Journal of Health Geographics, 2011. 10.
17. Balk, D., et al., A spatial analysis of childhood mortality in West Africa. Population, Space and Place, 2004. 10(3): p. 175-216.
18. Sankoh, O.A., et al., Clustering of childhood mortality in rural Burkina Faso. International Journal of Epidemiology, 2001. 30(3): p. 485-492.
19. Grady, S.C. and H. Enander, Geographic analysis of low birthweight and infant mortality in Michigan using automated zoning methodology. International Journal of Health Geographics, 2009. 8(1).
20. Mohamed, N.S., et al., Geographic information systems (GIS) analysis of under five mortality in Alexandria. The Journal of the Egyptian Public Health Association, 2004.
79(3-4): p. 243-62.
21. Anachebe, N.F., Racial and ethnic disparities in infant and maternal mortality. Ethnicity and Disease, 2006. 16(SUPPL. 3): p. S3-71-S3-76.
22. Hauck, F.R., K.O. Tanabe, and R.Y. Moon, Racial and Ethnic Disparities in Infant Mortality. Seminars in Perinatology, 2011. 35(4): p. 209-220.
23. MacDorman, M.F. and T.J. Mathews, Understanding racial and ethnic disparities in U.S. infant mortality rates. NCHS data brief, 2011(74): p. 1-8.
24. Anderson, I., et al., Indigenous health in Australia, New Zealand, and the Pacific. Lancet, 2006. 367(9524): p. 1775-85.
25. Kermode-Scott, B., Rates of infant mortality higher among indigenous children in Canada, the US, Australia, and New Zealand. BMJ, 2009. 338: p. b1379.
26. Ministry of Health, An Indication of New Zealanders Health, in Public Health Intelligence. 2002: Wellington, New Zealand.
27. Craig, E., Jackson, C., Han, D., NZCYES Steering Committee,. Monitoring the Health of New Zealand Children and Young People: Indicator Handbook. 2007, Paediatric Society of New Zealand & New Zealand Child and Youth Epidemiology Service.: Auckland, New Zealand. 28. Callister, P., et al., Measuring ethnicity in New Zealand: developing tools for health
outcomes analysis. Ethnicity & health, 2007. 12(4): p. 299-320.
29. Kulldorff, M., SaTScan™ v9.1.1: Software for the spatial and space-time scan statistics. 2009.
30. DeChello, L.M. and T.J. Sheehan, Spatial analysis of colorectal cancer incidence and proportion of late-stage in Massachusetts residents: 1995-1998. International journal of health geographics, 2007. 6: p. 20.
31. Demoury, C., et al., Spatial variations of childhood acute leukaemia in France, 1990-2006: global spatial heterogeneity and cluster detection at 'living-zone' level. European journal of cancer prevention, 2012. 21(4): p. 367-74.
32. Klassen, A.C., M. Kulldorff, and F. Curriero, Geographical clustering of prostate cancer grade and stage at diagnosis, before and after adjustment for risk factors. International journal of health geographics, 2005. 4(1): p. 1.
33. Kulldorff, M., et al., Evaluating cluster alarms: a space-time scan statistic and brain cancer in Los Alamos, New Mexico. American journal of public health, 1998. 88(9): p. 1377-80. 34. Kulldorff, M., et al., Breast cancer clusters in the northeast United States: A geographic
analysis. American journal of epidemiology, 1997. 146(2): p. 161-170.
35. Tian, N., J. Gaines Wilson, and F. Benjamin Zhan, Female breast cancer mortality clusters within racial groups in the United States. Health and Place, 2010. 16(2): p. 209-218. 36. Salmond, C., P. Crampton, and J. Atkinson, NZDep2006 index of deprivation: user's
manual, D.o.P. Health, Editor. 2007, University of Otago: Wellington.
37. Kraemer, H.C., V.S. Periyakoil, and A. Noda, Kappa Coefficients in Medical Research, in Tutorials in Biostatistics, Statistical Methods in Clinical Studies, R.B. D'Agostino, Editor. 2004, Wiley. p. 466.
38. SAS, SAS version 9.2. 2010, SAS Institute Inc: Cary (NC).
39. Freemantle, N., et al., What factors predict differences in infant and perinatal mortality in primary care trusts in England? A prognostic model. BMJ, 2009. 339.
40. Sims, M., T.L. Sims, and M.A. Bruce, Urban poverty and infant mortality rate disparities. J Natl Med Assoc, 2007. 99(4): p. 349-56.
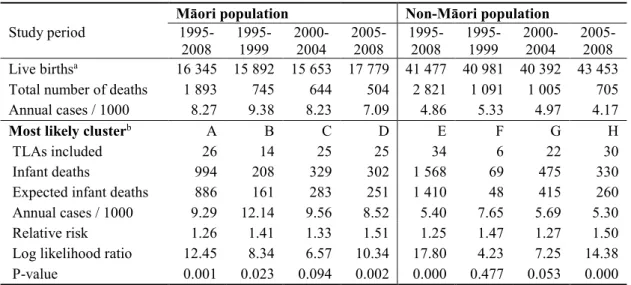
Table 1. Purely spatial analyses according to ethnicity
Māori population Non-Māori population
Study period 1995- 2008 1995- 1999 2000- 2004 2005- 2008 1995- 2008 1995- 1999 2000- 2004 2005- 2008 Live birthsa 16 345 15 892 15 653 17 779 41 477 40 981 40 392 43 453 Total number of deaths 1 893 745 644 504 2 821 1 091 1 005 705 Annual cases / 1000 8.27 9.38 8.23 7.09 4.86 5.33 4.97 4.17
Most likely clusterb A B C D E F G H
TLAs included 26 14 25 25 34 6 22 30
Infant deaths 994 208 329 302 1 568 69 475 330 Expected infant deaths 886 161 283 251 1 410 48 415 260 Annual cases / 1000 9.29 12.14 9.56 8.52 5.40 7.65 5.69 5.30 Relative risk 1.26 1.41 1.33 1.51 1.25 1.47 1.27 1.50 Log likelihood ratio 12.45 8.34 6.57 10.34 17.80 4.23 7.25 14.38 P-value 0.001 0.023 0.094 0.002 0.000 0.477 0.053 0.000 a Average population during the study period. b For the location of each cluster, see Figure 2. Only the statistically significant clusters are reported (with P<.10), with the exception of the F cluster.
Table 2. Degrees of concordance between purely spatial clusters according to time period and
ethnicity (simple kappa coefficient)
Māori population Non-Māori population
Study period 1995- 2008 1995- 1999 2000- 2004 2005- 2008 1995- 2008 1995- 1999 2000- 2004 2005- 2008 1995-2008 -- 0.60 0.97 0.79 -- n.d. 0.60 0.83 1995-1999 0.60 -- 0.62 0.49 n.d. -- n.d. n.d. 2000-2004 0.97 0.62 -- 0.75 0.60 n.d. -- 0.41 2004-2008 0.79 0.49 0.75 -- 0.83 n.d. 0.41 -- Non-Māori 0.77 n.d. 0.59 0.56 -- -- -- -- n.d.: because the most likely cluster of the Non-Māori population (1995-1999) contains only six TLAs for the 1995-1999, the kappa coefficient cannot be computed.
Table 3. T-test for significant difference in population density and deprivation level between the
TLAs included into the most likely cluster and those not included by the purely spatial analyses
Cluster Census Māori population Non-Māori population
analysis Variable Mean Difference Mean Difference (period) (year) N.I.a MLCb Mean Pr c N.I.a MCLb Mean Pr c
Pop. density (log) 1995-1999 1996 2.80 2.87 -0.07 0.907 2.99 0.84 2.15 0.012 2000-2004 2001 2.68 3.08 -0.40 0.428 2.45 3.65 -1.20 0.021 2005-2008 2006 2.59 3.37 -0.77 0.130 2.47 3.41 -0.95 0.054 1995-2008 1996 2.67 3.06 -0.39 0.434 2.33 3.35 -1.02 0.031 1995-2008 2001 2.68 3.06 -0.38 0.448 2.34 3.35 -1.02 0.034 1995-2008 2006 2.73 3.09 -0.36 0.475 2.39 3.38 -0.99 0.041 Dep. score 1995-1999 1996 1001 1025 -24 0.054 1008 983 25 0.155 2000-2004 2001 990 1027 -37 0.001 989 1034 -45 <.0001 2005-2008 2006 987 1031 -44 <.0001 991 1019 -28 0.009 1995-2008 1996 993 1029 -36 0.000 987 1027 -39 <.0001 1995-2008 2001 989 1027 -38 0.000 983 1025 -42 <.0001 1995-2008 2006 988 1028 -40 0.000 982 1025 -43 <.0001 a N.I.: TLAs not included in a most likely cluster. c MLC.: TLAs included in the most likely cluster (area with a high infant mortality incidence rate). b If the variances of the two groups are unequal (with P<0.05), the Satterthwaite variance estimator is used for the T-Test, otherwise, the pooled variance estimator is used.
Table 4. Purely spatial analyses adjusted for area-level deprivation according to ethnicity
Māori population Non-Māori population
Study period 1995-
2008 1995- 1999 2000- 2004 2005- 2008 1995- 2008 1995- 1999 2000- 2004 2005- 2008
Most likely clustera A B C D E F G H
TLAs included 1 4 1 1 1 7 1 8
Infant deaths 12 71 6 9 40 91 17 83
Expected infant deaths 3 44 1 2 22 69 8 58 Annual cases / 1000 3.15 15.02 45.92 27.79 8.60 7.06 11.11 5.99 Relative risk 3.82 1.66 5.63 3.97 1.84 1.36 2.26 1.49 Log likelihood ratio 7.21 7.28 5.41 5.64 6.03 3.48 4.32 5.30 P-value 0.045 0.054 0.169 0.146 0.109 0.661 0.380 0.189 a For the location of each cluster, see Figure 3. Only the most likely clusters are reported due to the very low level of significance of the secondary clusters.
Figure 1. Trends of infant mortality rates in some OECD countries, 1970-2008
Figure 4. Purely spatial clusters of infant mortality incidence adjusted for area-level deprivation,