FLIGHT TRANSPORTATION LABORATORY
REPORT R 86-5
CONGESTION DELAYS AT HUB AIRPORTS
Martin
J.
St. George
CONGESTION DELAYS AT HUB AIRPORTS
byMartin J. St. George
Abstract
A deterministic model was developed to study the effects of inefficient scheduling on flight delays at hub airports. The model bases the delay calculation on published schedule data and on user-defined airport capacities. Data from the Official Airline Guide of May, 1977 and May, 1985 was used for the analysis. Twelve large airports were studied in the hopes of finding a correlation between airport delay due to congestion and hubs. Data for both time
periods was analyzed for the twelve airports in order to find historical trends in the growth of hubbing.
Among the airports studied, those that were hubs had significantly more delays due to inefficient scheduling than the non-hubs, even for an equivalent number of operations. Also, these relative inefficiencies were shown to exist from hub to hub. Delays at hubs of similar
I would like to take this opportunity to thank a few people whose help was instrumental in the completion of this thesis. First, I would like to thank Professor Bob Simpson, whose
insight and guidance transformed an idea into a thesis. I would also like to thank Lyman Hazleton of the Flight Transportation Laboratory and Bill Sommerfeld of SIPB. Their technical assistance at a crucial time saved me from a September graduation. Just a thank you seems insufficient to offer to Ginny Agresti. Her support and prodding kept me going when things were at their darkest. Finally, I would like to thank my parents, who haVe stood behind me fgom the start. Without their love and support, I'd probably be loading baggage at Logan Airport today instead of graduating.
Table of Contents
Abstract 2 Acknowlegements 3 Table of Contents 4 List of Figures 5 1. Introduction 62. The Transformation of the Industry 7
2.1 Changing the Network Structure 7
2.2 Hub-and-Spoke Networks 8
2.3 Economic Rationale for Hub-and-Spoke Networks 8
2.4 Criteria for the Choice of a Hub Airport 11
2.5 Delays at Hub Airports 12
3. Description of the Model 14
3.1 Data Inputs 14
3.2 Data Preparation 14
3.3 Airport Information Input 15
3.4 Delay Calculation and Output 15
3.5 Graphical Output 16
4. Description of Output and Discussion of Results 17
4.1 Determination of Delay 17
4.2 A Note About Interpretation of the Output 18
4.3 Comparison of Delay in 1985 Against Delay in 1977 18
4.4 A Comparison Between Hubs and Non-Hubs 21
5. Conclusion and Recommendations 24
5.1 Inefficient Scheduling 24
5.2 Computer Reservation Systems and Delays 25
5.3 Making Schedules More Efficient 27
Appendix A. Deterministic Schedule Delay at an Airport 29
A. 1 Limitations of the Model 30
Appendix B. FORTRAN code for the Model 31
Appendix C. Graphical Representation of Delays 47
Appendix D. Sample Output for Atlanta 96
List of Figures
Figure 2-1: Figure 2-2:
Figure 4-1: Figure 4-2:
Market Penetration: Hub and Spoke Networks Peaking of Arrivals: Atlanta, February, 1984 Delay Analysis for Selected Airports
Introduction
The passage of the Airline Deregulation Act of 1978 has transformed the United States' domestic airline infrastructure from a network emphasizing point-to-point service into one where the majority of service is provided within a hub-and-spoke network. Although the hub-and-spoke network has enabled the airlines to enter more markets and provide better service, it has placed. a serious strain on the airports chosen as hubs. One manifestation of the increased demands on hub airports is the large number of delays due to congestion. The actual changes that the larger airports have undergone since deregulation will be discussed in this thesis. The analysis will be performed with a deterministic model that will indicate where delays are likely to occur because of peaks in scheduling. It will show that delays are caused in part by the practice of scheduling too many flight operations at an airport in too short a period of time.
The Transformation of the Industry
The most important aspect of the Airline Deregulation Act was that it allowed free entry and exit into or out of a market by any airline. Before deregulation, the Civil Aeronautics Board had the power to decide what airlines flew what routes. Although the CAB was constantly hearing cases about new routes, it was a time-consuming process and route awards were few and far between for most airlines. The rule for almost all of the airlines was an extensive point-to-point network. A few airlines were able to center their operations in one or two cities, but these early hubs were exceptions to the rule. These airlines also flew a significant number of flights that did not involve their hub.
2.1 Changing the Network Structure
The onset of deregulation saw a new spurt of growth on the part of almost every airline. An airline had the ability to choose its routes as it saw fit. Also, the Act allowed new companies to form, buy aircraft and fly scheduled service.
The airlines first used their new-found freedom to enter into markets that they had been kept out of by the CAB. In general, this meant service between the large business centers. The airlines started the deregulated era with limited resources, and the best way to make a profit was to serve the most profitable routes.
Also, the carriers tried to tune their networks to smooth out the cyclical aspect of the business. Most carriers flew predominantly north-south or east-west routes. In the United States, traffic on the east-west routes peaked in the summer and traffic on the north-south routes peaked in the winter. Because of this, most of the carriers had substantial excess
markets that peaked when their traditional markets were in their slack period. For example, Eastern Airlines, whose profitability depended heavily on routes to Florida, entered the transcontinental market to best utilize their fleet. At the same time, TWA, whose
transcontinental and European route structure peaked during the summer months, entered
the New York - Florida market.
2.2 Hub-and-Spoke Networks
The next strategy attempted by the airlines was the hub-and-spoke network. In this system, the airline tried to maximize the number of markets served while minimizing the number of aircraft needed.
Before deregulation, it was common for a typical airline passenger to use two or three different airlines to get from one place to another. This process, called "interlining," was taken for granted by many of the smaller trunks as a source of traffic. When deregulation was enacted, some of the airlines realized that they could make more money if they could serve the interlining passengers from origin to destination instead of sacrificing some of their revenue. The airlines who failed to detect this trend soon found that their interlining
passengers were being served from origin to destination by other airlines. However, the airlines did not have the resources to fly to enough new cities to meet the chhallenge. The hub-and-spoke network was the answer to the problem.
2.3 Economic Rationale for Hub-and-Spoke Networks
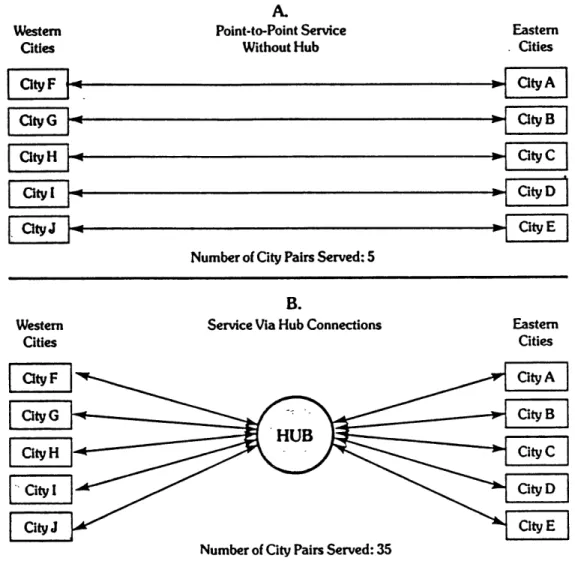
The hub-and-spoke network gave the airlines the ability to offer high-quality service to a city with a much smaller commitment of resources. To demonstrate, I will describe a fictitious airline ("Westair") whose network provides service to a large number of western cities.
Oa-ty F City G +wo City H + City I
+
City J
.
+
Western Citiesaty F
C.ty A
+o city B + CityCNumber of City Pairs Served: 5 B.
Service Via Hub Connections Eastern
Cities
Number of City Pairs Served: 35
Figure 2-1: Market Penetration: Hub and Spoke Networks Source: Brenner, et.al., Airline Deregulation .
Westair has a very large market share at the cities it serves along the West Coast. If the management at Westair wanted to enter the transcontinental market from its West Coast cities and it weren't using a hub-and-spoke network, it would try to find markets in which it could fill an aircraft and make money. To completely serve its five West Coast
cities from five East Coast cities would require fifty aircraft, one leaving each origin city going to each of the destination cities on the opposite coast. This number is not only prohibitively large but it is also wasteful. It is unlikely that a planeful of travelers could be generated daily within most of the markets. Even if the airline relaxed its desired service level and let each aircraft fly a one-stop flight, it would still need twenty five aircraft to serve each origin-destination market.
The choice of a hub-and-spoke network brings about a much more efficient way of entering the fifty markets with many fewer planes. The key to this type of network is that the airline picks a city to serve as a hub for its flights. Westair might pick Denver, the easternmost of its pre-deregulation cities. Now instead of flying a plane from each of the five West Coast cities to each of the East Coast cities, it flies one plane from each city to its hub. Now each aircraft can effectively serve five markets instead of one. Each plane carries its load of passengers to Denver, where the passenger gets on another plane to take him or her to the final destination. If each plane could make one round-trip daily, Westair would require ten aircraft to serve fifty markets. These planes would serve twenty additional markets, those between Denver and the ten East and West Coast cities, for a total of seventy markets served with ten planes. Also, it is more likely that the aircraft can be operated at a profit, since load factors should be higher.
The key to the success of this system is that the airline must coordinate the flights so that a passenger on any one of the planes arriving at the hub is able to transfer to any of the other planes. The most efficient way to ensure this is to schedule the flights so that they all arrive and depart the hub at or near the same time. This coordination of flights to allow connections is called a "complex" or a "connecting bank."
There are four main considerations that are taken into account when an airline picks a city to be its hub. First and foremost, the city has to be well-situated geographically. The general area is determined by the markets that the airline hopes to serve. It is clear that the most efficient routing for a passenger is a non-stop routing. However, if the passenger must go through a hub, the hub should be located as to minimize the circuity of the routing. .For example, if an airline wanted to enter the north-south market along the East Coast, Chicago would be a poor choice.
Although geography is very important, equally important is the size of the city chosen. Besides serving all of the new markets on a connecting basis, the airline is also providing extensive non-stop service to the hub city itself. The connecting traffic alone is sometimes
not enough to guarantee the economic success of a hub, and the hub-originating traffic alone can sometimes make a hub economically viable.
Another consideration is the quality of the facilites at an airport. The airport must be able to handle a large number of aircraft at the same time (for the reasons detailed above.) The airline must also have the facilities to serve many flights on the ground at the same time. The most obvious constraint is a sufficient number of gates, but the baggage handling facility, ticket counters, and waiting areas must also be sufficiently large. Also, the airline should have the ability to perform repairs and maintenance at the hub. Insufficient facilities
(or an inability to expand) are usually the biggest factor in rejecting an airport as a hub. The last major consideration is the competition that an airline is likely to have at an airport. Generally, only the largest cities can handle more than one airline providing the same "class" of service. For example, Denver has become a hub for three airlines, People Express/Frontier, Continental, and United. However, United markets its service to the business traveler while Continental and People Express aim for the price-sensitive customer.
American has announced that it will make Denver its next western hub as soon as it can secure sufficient facilities, so United will have another competitor for the business traveler. However, it is unlikely that another airline will set up a hub at Salt Lake City to compete with Western because of the small size of the Salt Lake City market.
2.5 Delays at Hub Airports
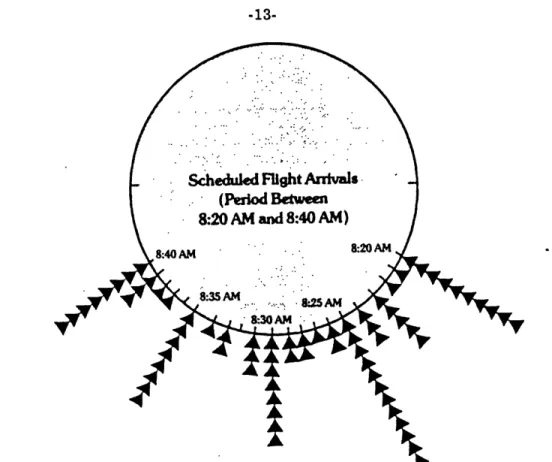
The opeation of hubs fosters delays. The most efficient schedule for an airline at a hub is one where all of the flights within a connecting complex arrive at the same time, then all leave at the same time. This is, of course, impossible, but airlines try to get as close as possible to this goal.
Most airlines have their own guidelines for scheduling at their hubs: for example, Republic tries to schedule three operations every two minutes at its hubs. However, this thumbnail rule fails because it doesn't take into account the other airlines at the airport. During the "rush hour" connecting complexes, the major airlines at the hub may have a complex, but most of the other airlines at the hub will probably schedule flights during the time period. This problem worsens every summer on Friday and Sunday evenings, the two busiest periods of the week. During these busy times last summer, it was common at many hubs for flights to sit on the ground for a length of time longer than the flight itself. The delays latent in a schedule are often compounded during periods of bad weather, when the airport capacity often drops up to fifty percent.
.Scheduled Flight Arrivals
(Peod Beteen
8:20 AM and8:40 AM) 8:40 AM -. 8:20 AM 8:35 AM 8:30AM-Figure 2-2: Peaking of Arrivals: Atlanta, February, 1984 Source: Brenner, et.al., Airline Deregulation .
Chapter 3
Description of the Model
The model used was written in FORTRAN 77 language and implemented on a DEC VAX 11/750 minicomputer. Data for the analysis comes from a tape created for the M.I.T. Flight Transportation Laboratory by the Boeing Commercial Aircraft Co. The tape contains data comparable to that found in the Official Airline Guide, with all domestic operations in May, 1977 and May, 1985.
3.1 Data Inputs
The model first asks the user to enter the three-letter code assigned to the desired airport. It then proceeds with reading the records, rejecting those records that do not involve the airport in question. It then checks to make sure that all of the flights selected operate on Friday, the day that was chosen for the analysis.
3.2 Data Preparation
The program then calls a function, TJLN, that converts the 24-hour format for schedule times into a number representing "seconds past midnight" of the given Friday. This is done to simplify the delay calculation. The array of operating times is then passed to a subroutine called DOSORT. This subroutine creates an array of pointers the same length as the time array. It then sorts the times into ascending order. Instead of moving each piece of a record into its new order, the subroutine uses the array of pointers to represent the proper order of the file.
The model can analyze up to three sets of takeoff and landing capacities. The user is asked how many sets he or she wants to enter. The model prompts the user for each capacity, and the values entered are converted from "operations per hour" to "service time
per operation."
3.4 Delay Calculation and Output
The model lets the first takeoff and landing operate at their scheduled times, and initializes two variables that hold the actual time of the previous takeoff and landing. The model then selects the next record and determined if it is a takeoff or a landing. If it is a takeoff, the scheduled time is compared to the sum of the time of the previous takeoff and the service time. If the scheduled time is later that this sum, the flight is allowed to operate at the designated time and no delay is accrued. If the flight is scheduled to leave earlier than this sum, the flight is held until takeoff is allowed, namely at the time when the runway clears, or the previous departure time plus the service time. The difference between the actual and scheduled departure times is the delay accrued. This calculation is done in a similar way for landings, as well as for each of the sets of service times.
The model finally creates a file that has the flight number, the scheduled time of operation, and one to four sets of actual times of operation and delay. For a more thorough explanation of the theory underlying this technique, see Appendix A.
3.5 Graphical Output
A provision was made for graphical output of the delay data. The output data from the original program created files that were up to 40 pages long. The volume occasionally made it difficult for the user to interpret the data. To help solve this problem, four more computer programs were created: DDEL77, ADEL77, DDEL85 AND ADEL85, These programs calculate the 1977 departure delays, 1977 arrival delays, 1985 departure delays and 1985 arrival delays, respectively. They are structured identically to the original model until the output section. These models call a series of graphing subroutines that.plot the delays versus time. The models compute average delays for fifteen-minute periods
Chapter 4
Description of Output and Discussion of Results
The model was used to analyze twelve large domestic airports in the United States. These airports are: Atlanta, Boston, Washington -National, Denver, Dallas/Fort Worth,
Houston Intercontinental, New York - La Guardia, Chicago -O'Hare, St. Louis, Detroit, Seattle and Pittsburgh. These airports were chosen because they are among the busiest airports in the United States. The list does not include such airports as John F. Kennedy in New York, Los Angeles International, San Francisco International and Miami International because the data set available does not include international flights. It also does not include Newark International, because the low level of traffic there in 1977 made a comparison inconclusive.
4.1 Determination of Delay
The model is set up to analyze only three pairs of takeoff and landing capacities per run. However, these combinations were carefully chosen. The first combination, sixty takeoffs and sixty landings per hour, is often the limit at a typical non-hub airport. This capacity suggests two independent runways, one devoted to takeoffs and one devoted to landings.
The second combination is ninety takeoffs and ninety landings per hour. This level represents three independent runways, one handling takeoffs, one handling landings, and one handling mixed takeoffs and landings. This level is close to peak capacity at all but a few hub airports.
twenty landings per hour, representing four independent runways, two for takeoffs and two for landings. Currently, Dallas/Fort Worth International is the only airport capable of handling sustained operations at this level.
The first combination is used as a basis for comparison between airports. There was a significant tradeoff in deciding on this level. One hundred and twenty operations per hour is too low to give significant results for Chicago O'Hare. O'Hare, and to a lesser extent
Atlanta, are so busy that running the model at this level indicates continual delays. Both airports can operate at a level significantly higher than one hundred and twenty operations per hour. However, the next level, ninety takeoffs and ninety landings per hour, is too high to give significant data for most of the other airports analyzed.
4.2 A Note About Interpretation of the Output
It is important to emphasize that the model is not designed to "predict" exact delays, and the output should not be taken as an indicator of actual daily delay at a certain airport. Congestion delay is only a component of the total delay that a flight can accrue. One major cause of delay that the model does not address is Air Traffic Control delays, or "ground holds." During peak periods, aircraft are often held on the ground because the air traffic control center that will control it on part or all of its flight is too busy to handle it safely. Ground holds are often accrued because of weather problems at the destination or because of anticipated congestion.
4.3 Comparison of Delay in 1985 Against Delay in 1977
In 1977, as was described earlier, there were only a few hubs. The four major hubs in 1977 are all included in this analysis: Chicago O'Hare, Denver, Atlanta and Dallas/Fort Worth. These airports are the only 0w that show multiple connecting complexes. United
-19-City Atlanta Boston Was.DCA Denver Dallas Houston NYC-LGA O'Hare St.Louis Detroit Seattle Pittsburgh Daily Ops 1209 654 702 737 1236 492 777 1721 566 443 386 663 1977 Average arrv/dept Delay (minutes) 6.60/ 8.61 0.46/ 1.24 0.53/ 1.13 1.02/ 1.70 2.65/ 3.25 0.22/ 0.59 0.49/ 1.39 11.73/13.84 0;23/ 0.63 0.23/ 0.63 0.22/ 0.56 0.60/ 0.91 Daily Ops 1924 990 780 1272 1410 813 987 2071 1023 968 563 892 1985 Average arrv/dept Delay (minutes) 26.71/31.03 0.86/ 2.19 1.18/ 1.49 7.68/ 7.80 8.82/13.88 1.63/ 1.93 1.68/ 2.27 56.53/70.25 3.24/ 5.57 3.82/ 4.25 0.47/ 0.93 2.29/ 4.00
Note: Delay data for 60 takeoffs/60 landings per hour
and American (and to a lesser extent, TWA) all had hub and spoke networks centered on O'Hare. For example, United had seventeen aircraft scheduled to arrive between 0900 and
0930, follwed by nineteen departures between 1000 and 1030. American had a complex beginning and ending at the same time as United with twelve arrivals and departures. Atlanta showed similar patterns of complexes for the two airlines that had hubs there, Delta and Eastern. Delta even had a complex between 2330 and 0030, for connecting night coach passengers. Braniff had a large hub and spoke network centered on Dallas/Fort Worth. American had a somewhat smaller hub at Dallas/Fort Worth in 1977, but there were obvious complexes throughout the day. Denver is probably the least-developed hub studied in 1977. United had a few complexes there daily, but they usually involved less than ten flights arriving and departing.
The eight other airports studied had no significant connecting complexes in 1977. Although the Official Airline Guide listed connections that could be made through many of these cities, many of them were from one airline to another. Besides Washington National and La Guardia, both of which were operating near capacity, the largest delays at the eight non-hubs were at Boston. (See Figure 4-1.) This could be partly due to a mini-hub that Delta operated there, with flights from the South connecting with flights from northern New England and Montreal. Also, a significant percentage of traffic at Boston is made up of flights to New York and Washington. These two routes mainly serve business travelers, and demand on both routes peaks at the same time of the day. However, the delays at Boston and the other non-hubs were still significantly smaller than at any of the hubs. The average delay per plane hovered around the one minute mark. As a comparison, average delays at Dallas/Fort Worth were around 2.65 minutes per arriving flights and 3.25 minutes per departing flight. Average delays at Atlanta were 6.60 minutes per arrival and 8.61 minutes per departure, and average delays at O'Hare were 11.73 minutes per arrival and 13.84 minutes per departure. Graphs showing arrival and departure delays for the airports
D.
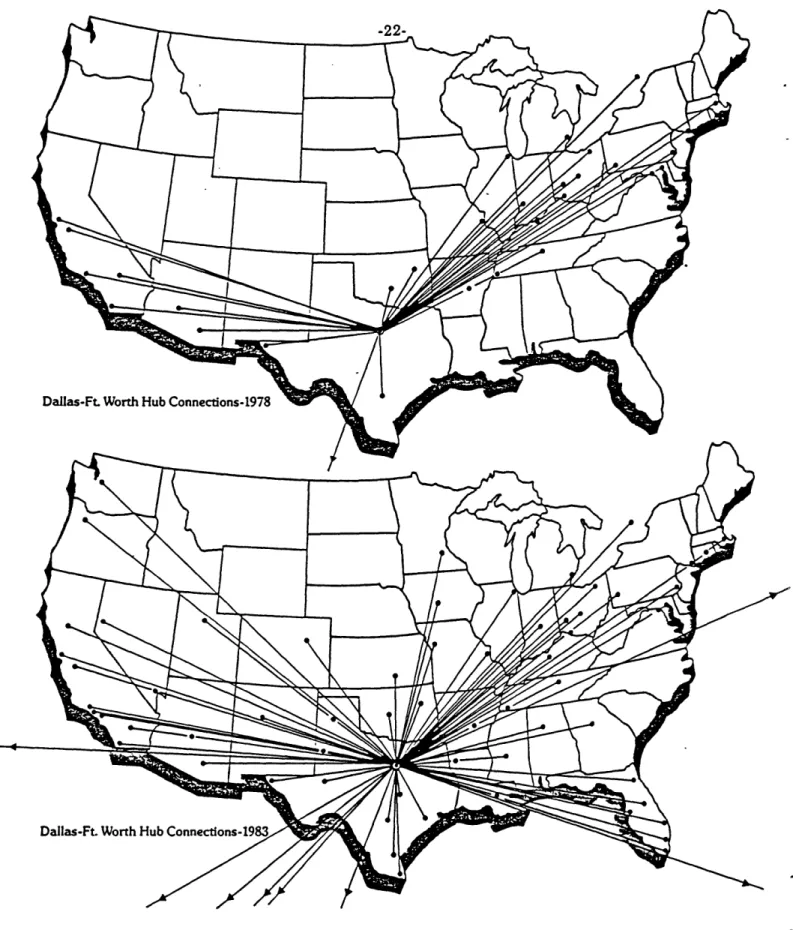
The data for 1985 shows the growth in the number of hub airports as well as the general growth of the industry. As was stated earlier, delay values at the one hundred and twenty operations per hour level are less than useful for the largest airports because they can and do operate well above this level. However, the data is quite useful for the smaller airports. Instead of four hubs and eight hubs, there are now eight hubs and four non-hubs. Along with the start of a hub came significant increases in traffic. Most cities experienced a fifty percent growth in operations: for example, Detroit went from four hundred and forty three operations per day to almost one thousand. See Figure 4-2 for an example of the development of a hub after deregulation.
Along with the increase in flights came an increase in average delay per flight, even for the non-hubs. However, the averages for non-hubs do not approach the averages for hub airports. In Atlanta, the number of operations went up fifty percent, but the average delay went up over three hundred percent. A better example of this trend is St. Louis, now a hub for both TWA and Ozark. Operations there went up over ninety percent, and delays went up six hundred percent.
4.4 A Comparison Between Hubs and Non-Hubs
The best way to discover delay caused by schedule peaking is to compare two airports, one hub and one non-hub. Since there is a correlation between traffic level and delay, the two airports must have roughly the same number of operations per day. Two airports that fulfill these requirements are Boston and St. Louis. Boston had 990 flights with an average delay of 0.86 minutes per arrival and 2.19 minutes per departure. St. Louis had 1023 operations, with average delay of 3.24 minutes per arrival and 5.57 minutes per departure.
Dallas-Ft. Worth
Figure 4-2: Development of AA hub at Dallas/Fort Worth
flights were more evenly distributed. Although there are many other factors influencing delays at these airports, and the previous statement may not prove true in practice, the
delays should be reduced by a significant amount if the flights at St. Louis were scheduled more like they are at Boston.
This comparison is also valid for higher traffic levels as well as between two hubs. In 1977, Dallas/Fort Worth had 1236 operations, and in 1985, Denver had 1272. Delay at Dallas/Fort Worth (1977) was 2.65 minutes per arrival and 3.25 minutes per departure. Delay at Denver (1985) was 7.68 minutes per arrival and 7.80 minutes per departure. Although Dallas/Fort Worth was a hub in 1977, delays there were one third those at Denver for roughly the same number of flights.1 Therefore, the fact that an airport serves as a hub does not in itself predict a certain amount of delay. Dallas/Fort Worth in 1977 and Denver in 1985 are both hubs, yet one is three times as efficient as the other.
1
The first response to this may be "D/FW is such a more efficient airport than Stapleton- of course delays there are lower." For this analysis, that fact is irrelevant. The model sets all of the airports on an even level when the capacities are specified. The actual facility is irrelevant. The point is that the schedule at the two airports show a different amount of peaking.
Chapter 5
Conclusion and Recommendations
This study has shown how delays at hub airports have increased since deregulation. The growth of the industry is not the only cause of the increase in delays. Inefficient scheduling has also had a significant impact. The question that must be asked now is why airlines continue to schedule in an inefficient way.
5.1 Inefficient Scheduling
One example of a scheduling complex has already been given: that of United at Chicago in 1977. In that example, there were seventeen scheduled arrivals within thirty five minutes, followed by nineteen departures within thirty minutes. At first glance, this does not seem unusually difficult for the airport to handle.
However, the problem is not so clear-cut. American also scheduled a complex during the same time period, with twelve flights in each time period. Besides all of these flights, thirty six other flights were scheduled to arrive during the first part of the complex and thirty three were scheduled to depart during the second half. This adds up to a total of sixty five arrivals within thirty minutes, or just over two arrivals per minute, greater than airport capacity. This complex was about as large as was found in 1977. This was because no one had a route structure that was well-developed enough to have more than seventeen cities participate in a complex at once.
If the problem is studied in 1985, the delays get worse. There are sixty four flights scheduled to depart O'Hare between 0830 and 0900. There are forty five departures scheduled between 0958 and 1010, a rate of two hundred and twenty five departures
late.
.1
5.2 Computer Reservation Systems and Delays
One technological development that has had a great impact on the way airlines do business has been the Computerized Reservation System, or CRS. The CRS has changed the way travelers pick their flights. In the past, a traveler who wanted to go to city X called his or her travel agent, who picked up an Official Airline Guide and looked up flights to city X. The agent picked the best flight for the customer, called the airline and made the reservation. Today, that agent is likely to have a computer terminal on his or her desk connected directly to the airline computer.
Although the airlines have been using computers to keep track of their advance reservations since the 1960s, they didn't start to sell terminals to outsiders until the late 1970s. The airlines that had their own computer reservation systems suddenly realized that they were sitting on top of a new marketing tool. Most travel agencies only need one CRS hookup. Any CRS can make a reservation on almost any airline. Therefore, since it can control the information presented to the agent, an airline that installed its CRS into a travel agency can greatly increase the amount of business that the agency shifts to their airline.
The CRS does not work exactly like the Official Airline Guide. The user is asked for the origin - destinaion pair and a desired departure time. The computer suggests the flights
that fit the requirements of the customer. However, the airline has little or no incentive to help other airlines get its traffic, so it will generally bury the flight information of its competitors deep on the list. The great majority of the reservations are made from the first set of choices presented to the agent. Therefore, the airline that owns the CRS, the "host," can direct traffic to itself even if it is not the customer's best option.
This practice was extremely unpopular with the smaller airlines. The only way to get themselves on an equal footing with the host carriers was to pay an exhorbitant "co-host" fee to the host. The practice was eventually ruled anticompetitive by the Department of Justice, and new rules were put forth for the hosts. Flights are to be listed on a CRS with non-stops presented first, then connecting flights, in order of elapsed time. This is where delays
germinate.
As was described earlier, one of the major benefit of hubs is that it helps an airline enter many more markets than it could before. Instead of one or two airlines that could serve a market before deregulation, now any airline that fed a hub from both these cities could enter this market. For example, any airline that served, say Hartford and Seattle, for example, could list itself as an option for the traveler, routing the traveler through their hub. Since the majority of bookings are made from the "first screen" presented by the CRS, there is a great incentive for an airline to get its flights listed on the first screen. The way to maximize the chances of your flight being displayed before your competitors' flights is to minimize the total elapsed time. Because of this, airlines have an incentive to schedule as tightly as possible. The realities of the CRS force the airline to schedule as a function of the competition's service time, not its own capacity.
The effects of this policy are felt more severely at the airports that are the most congested. It has been shown earlier that the level of activity has an effect on delays. Therefore, the smaller hubs have an advantage over the large ones because it is easier to get a flight in and out in a shorter period of time. However, the larger airports overcome this advantage because they generally have higher peak capacities.
Another reason that the airlines schedule so many flights at the same time may be based on gambling. If there are ten departures at 1000, and the airport capacity is one departure per minute, one plane will depart on time, one will depart one minute late, etc. An airline may decide that the chance of operating on time or within a few minutes is worth the risk of being ten minutes late if the stakes are a higher slot in the CRS.
The only way that airlines will change the way that they schedule their complexes is if it is proven that it is economically sound to change the schedules to reflect reality. That is not possible within the scope of this thesis. However, it is possible to present reasons why the inefficient scheduling hurts the airline.
The time accrued by a flight makes the airline run inefficiently. The time spent on the ground because of congestion is time that a plane is not in the air earning money. Once the flights do get airborne, the crew generally wastes fuel by flying at top speed to try and regain the time lost. If there are arrival delays, the crew must wait in a holding pattern, a feat that requires total concentration on the part of the crew. Also, the crew will accumulate overtime pay for the extra flight time. Also, with the generally tighter aircraft tours
common today, a plane that is delayed in the morning is likely to carry that delay along throughout the day.
However, one of the biggest incentives may be that passengers will change airlines if an airline's flights are always late. Most airlines still depend on the business traveler for most of their revenue, and the typical business traveler has a long memory. It is often said that a passenger will remember the one time an airline lost their bags before they remember the ninety nine perfect flights before. If a passenger is consistently late when traveling through one airline's hub, he or she will fly one of the many other airlines that want the revenue. For example, Western Airlines is capitalizing on the horrible reputation of its competitors' Denver hub with advertisements touting its own hub, Salt Lake City, as a "hassle-free alternative to Denver."
This thesis has shown that even a hub airport can be scheduled in efficient and inefficient ways without sacrificing the complexes. It is possible that the power of the consumer may be force that brings about more reasonable and efficient scheduling.
However, as long as there is a direct relationship between elapsed time and booking rates in a market, this change is unlikely.
Appendix A
Deterministic Schedule Delay at an Airport
There have been many models written that simulate airport departures and arrivals. Although most use queueing models that take into account aircraft speed and other
parameters, the model used to perform the delay analysis in this thesis uses a more -deterministic approach. Its success depends on the knowlege of the hourly takeoff and landing capacity for the airport in question.
Suppose an airport can handle n operations per hour, or 1/n hours per operation. The model is designed to determine the actual time of operation for each scheduled flight. The first flight of the day is assumed to operate at its scheduled time, t = tj. If the next
operation is scheduled for t
=
t2, the problem is to determine whether or not it will be able tooperate at its scheduled time. If t2>t +1/n
the flight is allowed to operate at the scheduled time, t = t2. However, if the flight is
scheduled to operate at t2<4-t+1/n
it will not be allowed to operate until the runway is cleared from the operation of the previous flight. This clearing time is 1/n, or the service time, and the flight is allowed to operate at
t2=
ti+1/n The general case is
tn tn-1+ 1/n
This stochastic can be expanded to handle departures and arrivals separately, by modeling two independent queues.
A.1 Limitations of the Model
The model depends on a few key assumptions. First of all, the data set contains only scheduled passenger flights between North American cities. Therefore, the queues are somewhat shorter than they would have been if the model contained all of the scheduled operations. However, most freight airlines tend to operate at night, so their absence should not affect the data too severely.
The absence of international flights was more of a problem. For this reason, it was necessary to omit analysis of airports that had a significant percentage of international operations, such as John F. Kennedy International in New York, Los Angeles International, Miami International and San Francisco International. This was especially regrettable because these airports have experienced significant delays during peak periods. Most of the airports that were studied receive some international service, but the frequency was typically less than ten flights per day and the absence had little affect on the data.
The omission of general aviation from the analysis was somewhat unavoidable, since the operations are unscheduled. The impact on the model's accuracy is unclear: general aviation aircraft usually have high runway occupancy times, but many airports have a runway dedicated to serving these flights.
Appendix B
PROGRAM DEL78
C C
C THIS PROGRAM HAS BEEN WRITTEN TO PERFORM ANALYSIS OF DELAYS
C AT AIRPORTS USING A SIMPLE DETERMINISTIC MODEL. IT READS DATA
C FROM A TAPE OF GAG SCHEDULES AND PRODUCES A SCHEDULE MAP FOR C THE DESIRED CITY. IT THEN PROMPTS THE USER TO ENTER I TO 4
C SETS OF TAKEOFF/LANDING CAPACITIES. IT CONVERTS THE CAPACITIES
C INTO SERVICE TIMES. AND PROCEDS TO -PUSH- THE SCHEDULE THROUGH
C THE CONSTRAINING CONDITIONS. IT HANDLES TAKEOFFS AND LANDINGS AS
C SEPARATE PROCESSES - IT IS ASSUM.ED THAT THE CAPACITIES ENTERED
C BY THE USER WILL TAKE MIXED OPERATIONS INTO ACCOUNT.
C
C FOR MORE INFO. SEE DDEL77FOR
C
CHARACTER*S CITY. OCITY. DCITY. SERVES(2506)
CHARACTER*81 CYAR
REAL TIME(2566). TOJLN(2500).DELD(4)
REAL TOUT(2500.4) .DELAY(2506.4).DELTO(4) .DELDG(4).DETO(4 REAL LSVC (4).TSVC(4).LASLDG(4).LASTO(4) .ARDEL(4) .DPDEL (4)
INTEGER N. NSTOPS. NPOINT(2500).NINJCAP.NTCAP(4).NLCAP(4) INTEGER DTIME.ATIME.DAYS.DATE
CHARACTER.8 FLIGHT(2500). FLYTE 04ARACTER*4 TOFRM(2500)
CHARACTER. 11 BUFF CCCCCCCCCCCCCCCCC!CCCCCCC
C THE USER IS PROMPTED FOR THE 5-LETTER AIRPORT CODE C
CCCCCC: --- nnc.ccc.
PRINT *, 'ENTER 5-LETTER AIRPORT CODE' READ '(AS)'. CITY
N-I
BUFF-'DELAY77. 'I/CITY
OPEN(UNIT-8.FILE-'SCHEDULE.DAT' .STATUS-'OLD' ,ACCESS-'SEQUJENTIAL') OPEN ( UNIT-0.FILE-BUFF.STATUtS-'NEW')
CCCCCCCCC CCC cCCC CCCCCCCCCC C --- f crcccY, ---C THE PROGRAM STARTS READING THE DATA FILE
~~C~~tCC~cCCcCC~C:::---
-- : 1 READ(8.81 ,ENO-2)CVAR 81 FORMAT(ASI) READ(CVAR. 109)FLYTE.OCITY.DCITY.DTIME.ATIMEDAYS.DATE 100 FORMAT(A6.4X.2A5.18X.2I4.12X.II11X.I3) IF( DATE.NE.577) GO TO 1 IF( (OCITY.NE.CITY).AND.(DCITY.NE.CITY)) G0 TO 1(
IF DAYS.NE.I) GO TO 1 IF OCITY.EQ.CITY) THEN TIME(N)-REAL(DTIME) TOFRM(N)-'to# SERVES (N) -OCITY FLIGHT (N )-FLYTE ELSE TIME(N)-REAL(ATIME) TOFRM(N)m' f rc' SERVES (N) -OCITY FLIGHT (N )-FLYTE END IF TOJLN(N)-TJLN(TIME(N)) N-N 0i GO TO 1 2 N-N-1 WRITE (6.10) N16 FORMAT(15. ' RECORDS ACCEPTED FOR PROCESSING')
C CALL DOSORT(TIME.N.NPOINT)
C
WRITE (6.11) WRITE (6.12)
11 FORMAT (iX.' DELAY CAN ANALYZE UP TO THREE SETS OF AIRPORT') 12 FORMAT (lX.' CAPACITIES. ENTER NUMBeER OF SETS TO BE STUDIED:1-3')
READ (6.13) .NUMCAP
1S FORMAT 1IS
14 FORMAT (IX.' ENTER HOURLY TAKEOFF CAPACITY FOR SET Ili1
15 FORMAT 1IX.' ENTER HOURLY LANDING CAPACITY FOR SET '.11
DO S. 1I-1 NUMCAP WRITE (6.14) I READ (6.16) NTCAP(I) WRITE (6.15) I READ (6.16) NLCAP(I) 16 FORMAT i)
-33-LSVC I =1./(REAL NLCAP(I))/3600.) TSVC I -1./(REAL NTCAP(I ))/3600.) PRINT ., LSVC(I) PRINT ., TSVC(I) 3 CONTINUE CC- CCCCCCCCCC
C INITIALIZATION OF DELAY MATRIX n::s:::cc~f..n. -- -- ---cc c--
00 4 J-1,NUMCAP
TOUT(NPOINT(1).J)-TOJLN(NPOINT(1))
DELAY(NPOINT(1).J )-TOUT(NPOINT(1) , J)-TOJLN(NPOINT(1))
IF(TOFRM(NPOINT(1)).EO.'FROM') THEN LASLDG(J)-TOJLN(NPOINT(1)) LASTO(J)-0 ELSE LASTO(J)-TOJLN(NPOINT(1)) LASLDG(J)-0 ENDOIF DELTO( J )-OELAY(NPOINT(I .J
DELDG( J )-OELAY (NPOINT (I) .J
4 CONTINUE C DELAY CALCULATION C 00 5, I-2.N 00 6. J-1.NUICAP DELAY(NPOINT(I) , )-0 IF(TOFRM(NPOINT(I)).EO. 'from') 00 TO 777
C DEPARTURE DELAY LOOP
IF(TOJLN(NPOINT(I)).GT.(LASTO(J)+TSVC(J))) THEN TOUT(NPOINT(I) .J)TOJLN(NPOINT(I)) LASTO(J)-TOUT(NPOINT(I) .J) ELSE TOUT(NPOINT(I),J)-LASTO(J)+TSVC(J) DELAY(NPOINT(I).J)-TOUT(NPOINT(I) .J)-TOJLN(NPOINT(I)) LASTO (J)-TOUT(NPOINT(I).J) ENDIF DELTO(J)-OELTO(J)+OELAY(NPOINT(I) .J) 00 TO 778
C ARRIVAL DELAY LOOP
777 IF(TOJLN(NPOINT(I)).GT.(LASLDG(J)+LSVC(J))) THEN TOUT(NPOINT(I).J)-TOJLN(NPOINT(I)) LASLDG(J)-TOUT(NPOINT(I).,J) ELSE TOUT(NPOINT(I).J)-LASLDG(J)+LSVC(J) DELAY(NPOINT(I).J)-TOUT(NPOINT(I).J)-TOJLN(NPOINT(I)) LASLDG(J)-TOUT(NPOINT(I) .J) ENDIF DELDG(J)-OELDG(J)+OELAY(NPOINT(I) .J) 778 CONTINUE 6 CONTINUE 5 CONTINUE C OUTPUT SECTION C C C WRITE 9,401 CITY 'WRITE(9,400)
WRITE(9.402 NTCAP(1).NTCAP(2) NTCAP(3) WRITE(9.403 NLCAP(1).NLCAP (2) NLCAP(3)
WRITE (9.404
WRITE (9.405 400 FORMAT 3X)
401 FORMAT '1','DELAY ANALYSIS FOR '.A3,': MAY.1977') 402 FORMAT 24X.4(13,' tkfs/hr' 14X))
403 FORMAT 24X.4(13,' Idgs/hr',14X))
404 FORMAT 1X,'AIRLINE/FLIGHT ',IX.SKED'.3X,3(' ARRV'. &2X.* DEPART',IX,' DELAY'.2X))
405 FORMAT(IX. '.IX'--'.3X,3( &X,# ---. 1X,0 -- ,2X))
C DO 7. I-1.N IF((MOO(REAL(I),66.)).EQ.o) THEN WRITE 9.401 CITY WRITE 9,400 WRITE 9,402 NTCAP(1).NTCAP(2).NTCAP(3) WRITE 9.403 NLCAP(1),NLCAP(2).NLCAP(3) WRITE 9.404 WRITE 9.405' ELSE GO TO 791 ENDIF 791 CONTINUE C DO 790 J-1.NUMCAP
IF(TOFRM(NPOINT(I)).EO. 'from') then
ARDEL( J-RTIME(TOUT(NPOINT(I).J)) DPDEL(J-4 ELSE OPOEL (J)-RTIME(TOUT(NPOINT(I).J)) ARDEL(J) -0 ENDIF 790 CONTINUE C
IF(TOFRM(NPOINT(I)).EQ. 'from') THEN
WRITE(9.101) FLIGHT(NPOINT(I)),
&TOFRM(NPOINT(I)).SERVES(NPOINT(I)).INT(TIME(NPOINT(I))). &ARDEL(1).RTIME(DELAY
& NPOINT I ARDEL(2) RTIME(DELAY
& NPOINT .2) .ARDEL(3) RTIME(DELAY
&( NPOINT 1I .3) 101 FORAT(1XA6.X.A4.X,A3.X,I4.3X.3(F7.2.7X.F7.2.2X)) C ELSE WRITE(9, 102) FLIGHT(NPOINT(I)), &TOFRM(NPOINT(I)).SERVES(NPOINT(I)).INT(TIME(NPOINT(I))). &DPDEL(1) ,RTIME(DELAY
&(NPOINT .1 DPOEL(2) RTIME(DELAY
&NPOINT ,2 ,DPOEL(3) RTIME(DELAY
102 FORMAT(1XA6,X.A4,X.A3,X, I4.3X.3(7X.F7.2.F7.2.2X)) ENOIF 7 CONTINUE WRITE 9,400 WRITE 9,400 WRITE 9.400) DELTO 1 -OELTO(1 /60 DELTO -DELTO /60 DELTO -OELTO(3 /60 DELDC I -OELD /60 DELDG 2 -DELD 2 /60 DELDG 3)-OELDG (3/60
WRITE 9.103) DELDG(1),DELDG(2) DELDG(3) WRITE 9.105) DELTO(1) .DELTO(2) DELTO(3) WRITE 9.400 WRITE 9,400 WRITE 9.1041 NF WRITE 9.400 DO 202 1-1.3 DETO(I)-2oDELTO(I)/NF DELD ()-2*DELDG(I)/NF 202 CONTINUE
WRITE(9,108) DELD(1) .DELD(2 ,DELD (3)
WRITE(9.107) DETO(1) .DETO(2) .DETO(3)
103 FORMAT IX,' ARRIVAL DELAY:'.4X,3(F1O.2.12X),'MINS)
105 FORMAT(1X, 'DEPARTURE DELAY: *.3(F1O.2.12X). 'MINS')
104 FORMAT1X,' A TOTAL OF ',14.' FLIGHTS')
108 FORMAT1 'MINS DELAY/ARRIVAL:'.3(F1O.2.12X)) 107 FORMAT IX.MINS DELAY/DEPARTURE '.3(F1O.2.12X))
CLOSE(UNIT-9.STATUS-'KEEP') CLOSE (UNIT-8.STATUS-'KEEP')
WRITE (6.106)
106 FORMAT (1X, ' AT LAST LINE OF PROGRAM') STOP
PROGRAM DEL85
C C
C THIS PROGRAM HAS BEEN WRITTEN TO PERFORM ANALYSIS OF DELAYS C AT AIRPORTS USING A SIMPLE DETERMINISTIC MODEL. IT READS DATA
C FROM A TAPE OF OAG SCHEDULES AND PRODUCES A SCHEDULE MAP FOR
C THE DESIRED CITY. IT THEN PROhPTS THE USER TO ENTER I TO 4
C SETS OF TAKEOFF/LANDING CAPACITIES. IT CONVERTS THE CAPACITIES
C INTO SERVICE TIMES. AND PROCEDS TO "PUSH" THE SCHEDULE THROUGH
C THE CONSTRAINING CONDITIONS. IT HANDLES TAKEOFFS AND LANDINGS AS
C SEPARATE PROCESSES - IT IS ASSUIED THAT THE CAPACITIES ENTERED
C BY THE USER WILL TAKE MIXED OPERATIONS INTO ACCOUNT.
C
C FOR MORE INFO. SEE DOEL77.FOR
C
CHARACTER*3 CITY. OCITY. OCITY. SERVES(2500) CHARACTERe81 CVAR
REAL TIME(2560), TOJLN(2500).DELD(4)
REAL TOUT 2500.4) .DELAY(2500.4).DELTO(4) ,DELDG(4).DETO(4) REAL LSVC 4). TSVC(4). LASLOG(4). LASTO(4) .ARDEL(4) ,DPOEL(4)
INTEGER N. NSTOPS. NPOINT(2500).NWCAP.NTCAP(4).NLCAP(4)
INTEGER DTIME.ATIME.DAYS.DATE CHARACTERe8 FLIGHT(2500). FLYTE CHARACTER.4 TOFRM(2500)
CHARACTERel1 BUFF
cC c- c
C THE USER IS PROMPTED FOR THE 3-LETTER AIRPORT CODE C
C CCCCC::aa
CC"1" --
---
b-u---:
A
PRINT ., 'ENTER 3-LETTER AIRPORT CODE' READ '(A3)'. CITY
BUFF-'DELAY85.'//CITY
OPEN(UNIT-8.FILE-'SCHEDULE.DAT' STATUS-'OLD' ACCESS- SEQUENTIAL) OPEN(UNIT-9.FILE-eUFFSTATUS-'NEW')
CCCCCCCC:~CC~C: r
C THE PROGRAM STARTS READING THE DATA FILE
CCC- - - - -- -I READ(8.81.END-2)CVAR 81 FORMAT(A81) READ(CVAR. 100)FLYTE.OCITY.DCITY.DTIME.ATIMEDAYS.DATE 100 FORMAT(A64X.2A318X.214.12X.I1.11X,13) IF( DATE.NE.585) GO TO 1 IF( (OCITY.NE.CITY).ANO.(DCITY.NE.CITY)) GO TO 1 IF(DAYS.NE.1) GO TO 1 IF OCITY.EQ.CITY) THEN TIME(N)=REAL(DTIME) TOFRM(N)-'to SERVES N -DCITY FLIGHT N -FLYTE ELSE TIME(N)-REAL(ATIME) TOFRM(N)-' f ro' SERVES N-OCITY FLIGHT N -FLYTE ENDIF TOJLN(N)-TJLN(TIME(N)) GO TO 1 2 N-N-1 WRITE (6.10) N
10 FORMAT(I5. * RECORDS ACCEPTED FOR PROCESSING')
CALL DOSORT(TIME.N.NPOINT)
C
WRITE (6,11 WRITE (6.12)
11 FORMAT (1X.' DELAY CAN ANALYZE UP TO THREE SETS OF AIRPORT') 12 FORMAT (lX.' CAPACITIES. ENTER NUABER OF SETS TO BE STUDIED:1-3')
READ (6,13).NUMCAP 13 FORMAT 13)
14 FORMAT IX.' ENTER HOURLY TAKEOFF CAPACITY FOR SET ',11)
15 FORMAT IX.' ENTER HOURLY LANDING CAPACITY FOR SET ',I1)
DO 3. I-1.NUMCAP WRITE (6.14) 1 READ (6.16) NTCAP(I) WRITE (6.15) I READ (6,16).NLCAP(I) 16 FORMAT (I3)
LSVCI -1./(REAL(NLCAP (I )/3600.) TSVC I.1./(REAL(NTCAP 3600. PRINT ., LSVC(I) PRINT ., TSVC(I) 3 CONTINUE r lrlrrcCC P rc-- MD *.ccncc r~rcrcrcrErccccccccCCcCCCC
C INITIALIZATION OF DELAY MATRIX DO 4 J-1.NUMCAP
TOUT(NPOINT(1).J)TOJLN(NPOINT(1))
DELAY(NPOINT(1).J -TOUT (NPOINT (1) ,J)-TOJLN(NPOINT(1))
IF(TOFRM(NPOIN(1).EO.'FROM') THEN LASLDG(J)=TOJLN(NPOINT(1)) LASTO(J)-0 ELSE LASTO(J)-TOJLN(NPOINT(1)) LASLDG(J)-0 ENDIF
DELTO (J )-OELAY NPOINT , J
DELDG (J)-DELAY NPOINT I J 4 CONTINUE C DELAY CALCULATION C DO 5. I-2,N DO 8, J-1,NUCAP DELAY(NPOINT(I) , J)0
IF(TOFRM(NPOINT(I )).EQ. 'romo) GO TO 777 C DEPARTURE DELAY LOOP
IF(TOJLN(NPOINT (I)).GT. (LASTO(J)+TSVC(J))) THEN TOUT(NPOINT(I) .J)-TOJLN(NPOINT(I)) LASTO(J)-TOUT(NPOINT(I).J) ELSE TOUT(NPOINT(I)J)-LASTO(J )+TSVC(J) DELAY(NPOINT(I),J)=TOUT(NPOINT(I).J)-TOJLN(NPOINT(I)) LASTO(J)=TOUT(NPOINT(I).J) ENDIF DELTO(J)-DELTO(J)+OELAY(NPOINT(I) .J) GO TO 778
C --- AR-iVAL DELAY LOOP
778 6 5 C C C C C C 400 401 402 403 404 405
--TOUT (NPOINT (I) ,.J)=-TOJLN(NPOINT (I)) LASLDG(J)-TOUT(NPOINT(I) ,.J) ELSE TOUT(NPOINT(I) .J)=LASLDG(J)+LSVC(J) DELAY(NPOINT(I).J)-TOUT(NPOINT(I)J)-TOJLN(NPOINT(I)) LASLDG(J)-TOUT(NPOINT(I).J) ENDIF DELDG(J)-OELDG(J)+0ELAY(NPOINT(I).J) CONTINUE CONTINUE CONTINUE OUTPUT SECTION WRITE (9,401 CITY WRITE 9,400
WRITE 9.402 NTCAP(1) NTCAP(2).NTCAP(3)
WRITE 9,403 NLCAP(1),NLCAP(2) NLCAP(3) WRITE 9.404
WRITE 9,405) FORMAT (3X)
FORMAT( 1.DELAY ANALYSIS FOR .A3,': MAY.1985') FORMAT(24X.4(13,' tkft/hr',14X))
FORMAT 24X.4(13.' Idge/hr'.14X)
FORMAT 1X,'AIRLINE/FLIGHT *.1X,'SKED'.3X,3(' ARRY'.
&2X.- DEPART'.IX,' DELAY',2X))
FORMAT(1X, ** 1X.'---',3X.3('
Xj, #--- ,1lX, --- ,2X))
C
C
DO 7. I-1.N
IF((MOD REAL( ).66.)).EQ.0) THEN
WRITE 9.401 CITY WRITE 9.400 WRITE 9.402 NTCAP(1).NTCAP(2).NTCAP(3) WRITE 9.403 NLCAP(1).NLCAP(2).NLCAP(3) WRITE 9.404 WRITE 9,405 ELSE GO TO 791 ENDIF 791 CONTINUE C DO 790 J-1.NUICAP IF(TOFRM(NPOINT(I)).EO.'from') then ARDEL(J)-RTIME(TOUT(NPOINT(I).J)) DPDEL(J -O ELSE DPOEL (J-RTIME(TOUT(NPOINT(I).J)) ARDEL J-0 ENDIF 790 CONTINUE C
IF(TOFRM(NPOINT(I)).EO. 'from') THEN
WRITE(9,101) FLIGHT(NPOINT(I)).
&TOFRM(NPOINT()),SERVES(NPOINT(I)).INT(TIME(NPOINT(I))).
&ARDEL(1) .RTIME(DELAY
& (NPOINT ,) ,ARDEL(2), RTIME(DELAY
&(NPOINT I.2 ,ARDEL(3) RTIME(DELAY
&(NPOINT(1 .3 101 FORMAT(1X.A6.X.A4.X.A3.X.I4.3X.3(F7.2.7X.F7.2.2X)) C ELSE WRITE(9.102) FLIGHT(NPOINT(I)). &TOFRM(NPOINT(I)).SERVES(NPOINT(I)).INT(TIME(NPOINT(I))). &DPDEL(1) .RTIME(DELAY
& NPOINT , ,1)).DPDEL(2),RTIME(DELAY
& NPOINT 2 ,DPDEL(3) RTIME (DELAY
& NPOINT ) .3 102 FORMAT(1X.A6.X.A4.X.A3.X.14.3X.3(7X.F7.2.F7.2.2X)) ENDIF 7 CONTINUE WRITE 9,400 WRITE 9,400 WRITE 9,400) DELTO 1 -DELTO1 1/60 DELTO 2 -OELTO /60 DELTO 3 -DELTO 3)/60 DELDG 1 -OELDG 1 /60 DELDG 2 -OELDG 2 /60 DELDG 31-OELDG3 (/60 WRITE 9.103) DELDG(1),DELDG(2),DELDG(3) WRITE 9,105) DELTO(1) DELTO(2) DELTO(3) NF-N-1 WRITE 9.400) WRITE 9.400 WRITE 9.104 NF WRITE 9.400 DO 202 1-1.3 DETO(I)-2*DELT0(I)/NF DEL2 (I)-2*DELDG(I)/NF 262 CONTINUE
WRITE(9.108) DELD(1).DELD(2 )DELD(3) WRITE(9.107) DETO(1) .DETO(2) ,DETO(3)
103 FORMAT( IX,' ARRIVAL DELAY:'.4X.3(F10.2.12X).'MINS') 105 FORMAT 1X, 'DEPARTURE DELAY: '.3(F1.2.12X). 'MINS')
104 FORMAT(1X,' A TOTAL OF '.14.' FLIGHTS')
108 FORMAT( 1X,'MINS DELAY/ARRIVAL:'.3(F16.2.12X)) 107 FORMAT IX. 'MINS DELAY/DEPARTURE '.3(F1.2.12X))
CLOSE(UNIT-9,STATUS-'KEEP')
CLOSE (UNIT-8.STATUS-'KEEP')
WRITE (6,106)
106 FORMAT (IX, * AT LAST LINE OF PROGRAM') STOP
C PROGRAM ADEL77
C
C THIS PROGRAM HAS BEEN WRITTEN TO PERFORM ANALYSIS OF DELAYS C AT AIRPORTS USING A SIMPLE DETERMINISTIC MODEL. IT READS DATA
C FROM A TAPE OF OAG SCHEDULES AND PRODUCES A SCHEDULE MAP FOR
C THE DESIRED CITY. IT THEN PROMPTS THE USER TO ENTER1ITO 4
C SETS OF TAKEOFF/LANDING CAPACITIES. IT CONVERTS THE CAPACITIES C INTO SERVICE TIMES, AND PROCEDS TO "PUSH" THE SCHEDULE THROUGH
C THE CONSTRAINING CONDITIONS. IT HANDLES TAKEOFFS AND LANDINGS AS
C SEPARATE PROCESSES - IT IS ASSUMJED THAT THE CAPACITIES ENTERED
C BY THE USER WILL TAKE MIXED OPERATIONS INTO ACCOUNT. C
C
CHARACTER.3 CITY. OCITY. OCITY. SERVES(2560) CHARACTERe81 CYAR
REAL TIME (2500). TOJLN(2580).DELD(4).TDEL.DELOUT(288)
REAL TOUT( 2500. 4). DELAY (2500. 4). DELTO(4). D ELDG (4). D ETO (4)
REAL LSVC (4) .TSVC(4).LASLDG(4),LASTO(4) .ARDEL(4) ,DPDEL (4)
REAL TIMOUT(288) .TIMDEC(2500)
INTEGER N, NSTOPS, NPOINT(2500).NLNJCAP.NTCAP(4),NLCAP(4)
INTEGER DTIME.ATIMEDAYS.DATEINDEX.NC
CHARACTER*8 FLIGHT(2500). FLYTE CHARACTER.4 TOFRM(2500) CHARACTERoll BUFF C EQUIVALENCE(TIMOUT(1) ,TIMOUT (97)) C EQUIVALENCE(TIMOUT(1I ,TIMOUT( 193) CHARACTER*69 TITLE.PLTI TL INTEGER IOPT(3).NN(3)
C H USER IS PROMP~TED FOR THE 5-LETTER AIRPORT CODE C
PRINT s. OENTER 3-LETTER AIRPORT CODE* READ '(A3)'. CITY
N-1
OPEN (UN IT-8 FI LEWSCHEDULE. DAT', STATUS-*OLD, .ACCESS--SEQUENTIAL)
C THE PROGRAM STARTS READING THE DATA FILE
READ(8,81 ,END-2)CVAR 81 FORMAT(Aa1) READ(CVAR, I 0)FLYTE.OCITY.DCITY.OTIME.ATIME.DAYS,DATE 100 FORMAT(A6.4X.2A3.18x,2I4,12X.111.IS1) IF (DATE.NE.577) GO TO I IF( DCITY.NE.CITY) GO TO 1 IF(DAYS.NE.1) GO TO 1 IF (DCITY.EQ.CITY) THEN TIME(N)-REAL(ATIME) TOFRM(N)m f romu SERVES (N )-OCITY FLIGHT (N)-FLYTE END IF TOJLN(N)-TJLN(TIME(N)) GO TO 1 2 N-N-i WRITE (6.10) N
18 FORMAT(I3, -RECORDS ACCEPTED FOR PROCESSING-)
CALL DOSORT(TIME.N.NPOINT) C
WRITE (6,11) WRITE (6.12)
11 FORMAT (1X. - DELAY CAN ANALYZE UP TO THREE SETS OF AIRPORT-)
12 FORMAT (IX. * CAPACITIES. ENTER NUMWBER OF SETS TO BE STUOIED:1-3-) C READ (6.13),NM~CAP
NUMCAP-3
13 FORMAT (3)
14
FORMAT (Ix,' ENTER HOURLY TAKEOFF CAPACITY FOR SET '.I1)
15 FORMAT 1lX,' ENTER HOURLY LANDING CAPACITY FOR SET -.11)
DO 3. I-1.NUMCAP C WRITE (6,14) I C READ (6,16) NTCAP(I) NTCAP( I)-(I+1 ).30 C WRITE (6.15) I C READ (6,16).NLCAP(I) NLCAPi( I)-(I+1).50 16 FORMAT (I3)
LSCI-1./(REAL(NLCAP (I ))/3600.)
TSVC( -1./(REAL(NTCAP(I))/3600.) C PRINT .. LSVC (I
C PRINT ., TSVC(I
3 CONTINUE
C INITIALIZATION OF DELAY MATRIX
DO 4 J-1.NUCAP
TOUT(NPOINT(1).J)-TOJLN(NPOINT(1))
DELAY(NPOINT(1).J )-TOUT(NPOINT(1),J)-TOJLN(NPOINT(1)) IF(TOFR(PINT(l)) .EO. 'FROM' THEN
LASLG(J)-TOJLN(NPOINT(1 ) LASTO(J)-0 ELSE LASTO(J)-TOJLN(NPOINT(1)) LASLDG(J)-0 ENOIF
DELTO( J )-DELAY( NPOINT , J)
DELDG( J )-OELAY NPOINT I J
4 CONTINUE C DELAY CALCULATION C CC-- - CCCCCCCCC CCCCCCCCCCC DO 5. I-2.N DO 6. J-1.NUACAP DELAY(NPOINT(I),J)-0 IF(TOFRM(NPOINT(I)).EQ.'from') GO TO 777
C DEPARTURE DELAY LOOP
- CC
IF(TOJLN(NPOINT(I)).GT.(LASTO(J)+TSVC(J))) THEN TOUT (NPOINT(I) .J)-TOJLN(NPOINT(I))
LASTO(J)-TOUT(NPOINT(I).J) ELSE TOUT(NPOINT(I) .J)-LASTO( J)+TSVC(J) DELAY(NPOINT(I),J)-TOUT(NPOINT(I).J)-TOJLN(NPOINT(I)) LASTO(J)-TOUT(NPOINT(I),J) ENDIF DELTO(J)-OELTO(J)+OELAY(NPOINT(I) .J) GO TO 778 C ARRIVAL DELAY LOOP
777 IF(TOJLN(NPOINT(I)).GT.(LASLDG(J)+LSVC(J))) THEN 778 6 5 C cc TOUT (NPOINT(I).J)-TOJLN(NPOINT(I)) LASLDG(J)-TOUT(NPOINT(I).J) ELSE TOUT(NPOINT(I).J)-LASLDC(J)+LSVC(J) DELAY(NPOINT(I).J)-TOT(NPOINT(I).J)-TOJLN(NPOINT(I)) LASLDG(J)-TOUT (NPOINT(I) .J) ENOIF DELDG(J)-DELDG(J)+0ELAY(NPOINT(I).J) CONTINUE CONTINUE CONTINUE OUTPUT SECTION CCC -~ 2CCCCC DO 300 I-1.N HRS-INT(TIME(NPOINT(I))/100.) MINS-MOD(TIME(NPOINT(I) ,100.) TIhOEC(I)-HRS+(MINS/6. 300 CONTINUE TIMOUT(1)-6.25 DO 301 1-2.96 TIMOUT(I)-TIMOUT(I-1)+.25 301 CONTINUE DO 3011 1-97,192 TIMOUT(I)-TIMOUT(I-96) 3011 CONTINUE DO 3012 1-193,288 TIMOUT(I)-TIMOUT(I-96) 3012 CONTINUE TDEL-0 C
00 302 J-1.3 INDEX-1 DO 303 I-1.N IND-(96*(J-1))+INDEX IF(TIWEC(I).LT.TIMOUT(INDEX)) THEN TDEL=T1DEL+0ELAY(NPOINT(I)%J NC-NC+1 ELSE IF(NC.EQO) THEN DELOUT(IND)-0 00 TO 3009 ENDIF DELOUT(IND)-TDEL/(NC.60) NC-8 TDEL-0 3009 INDEX-INDEX+1 ENDIF 303 CONTINUE 302 CONTINUE cCC CO CC
C CALLING "GRAFIC" PACKAGE
CCCCCCCCCCC CCCCCCCCCCCCCCC
TITLE-' ARRIVAL DELAY ANALYSIS. MAY 1977 AT '//CITY INDGR-28
PLTITL-' Time Delay 60.90,120 arrv/hr cap.
NLINE-3 NN 1-96 NN(2 -96 NN -96 IOPT(1)-2 IOPT -2 IOPT 3 -2
CALL GRINIT (5.6.TITLE) CALL GRSSET (0,24,0.60)
CALL GRLINE( IOPT.NLINE.PLTITL.INDGR.TIMOUT.DELOUT.NN) CLOSE(UNIT-8.STATUS'KEEP')
STOP
PROGRAM DCEL77
C C
C THIS PROGRAM HAS BEEN WRITTEN TO PERFORM ANALYSIS OF DELAYS C AT AIRPORTS USING A SIMP~LE DETERMINISTIC MODEL. IT READS DATA
C FROM A TAPE OF OAG SCHEDULES AND PRODUCES A SCHEDULE MAP FOR
C THE DESIRED CITY. IT THEN PROMPTS THE USER TO ENTER ITO 4
C SETS OF TAKEOFF/LANDING CAPACITIES. IT CONVERTS THE CAPACITIES
C INTO SERVICE TIMES. AND PROCEDS TO *PUSH" THE SCHEDULE THROUGH
C THE CONSTRAINING CONDITIONS. IT HANDLES TAKEOFFS AND LANDINGS AS
C SEPARATE PROCESSES - IT IS ASSUMIED THAT THE CAPACITIES ENTERED
C BY THE USER WILL TAKE MIXED OPERATIONS INTO ACCOUNT.
C
C THIS PROGRAM DIFFERS FROM THE ORIGINAL PROGRAM "DELAY" IN THAT IT C IS DESIGNED TO PRODUCE GRAPHICAL OUTPUT. THE PLOTTING PACKAGE
C USED IS CALLED "GRAFIC" AND IT WAS WRITTEN BY SOMEONE IN CFDL. C THE MAJOR DIFFERENCE IN THE RUNNING OF THE PROGRAM IS THAT. WHEN
C LINKING. THE USER TYPES
C "LINK DDEL77 .TJLN.DOSORT.SYSSPLOT:GRAFIC/LIB.SYS$PLOT:PLOTLIB/LIB"
C THEN. THE MODEL PRODUCES A GRAPH. WITH A MENU. TYPE L FOR
C A HARDCOPY. THIS PROGRAM HANDLES DEPARTURES IN 1977. ALSO ON C THIS DIRECTORY ARE DOEL77.ADELB5 AND DDEL85. THEY WORK THE SAME WAY.
C IF ANY QUESTIONS ARISE. WRITE PLEASE FEEL FREE TO WRITE: C MARTIN ST. GEORGE
C 11 ANDREWS ISLE
C HINGHAM. MA 02043
C
CHARACTER*3 CITY. OCITY. OCITY. SERVES(2500)
CHARACTER.81 CVAR
REAL TIME (2500)._TOJLN(2500).DELD(4).TDEL.DELOUT(2aa) REAL TOUT (2500.4). DELAY (2500. 4). DELTO(4). DELDG (4). DETO ( 4)
REAL LSVC ( 4). TSVC (4). LAS LDG (4). LASTO(4) . ARDEL(4). DPOEL (4) REAL TIMOUT(288) .TINCEC(2560)
INTEGER N. NSTOPS, NPOINT(2500).NLNJCAP.NTCAP(4).NLCAP(4) INTEGER DTIME.ATIME.DAYS.DATE, INDEX.NC
CHARACTEReg FLIGHT(2500). FLYTE CHARACTER.4 TOFRM(2500)
CHARACTERll BUFF
C EQUIVALENCE (TIMOUTl (1 TIMOUT (97))
C EQUIVALENCE(TIMOUT(1) .TIT(193)
CHARACTER.6e TITLE.PLTITL
INTEGER IOPT(3) .NN(3)
C THE USER IS PROI.PTED FOR ThE 3-LETTER AIRPORT CODE C
PRINT s. 'ENTER 3-LETTER AIRPORT CODE& READ '(A3)'. CITY
OPEN(UNIT-8. FI LE-SCHEDULE. DAT* STATUS--OLD .ACCESS- SEQUENT IAL)
C THE PROGRAM STARTS READING THE DATA FILE
1 READ(8.81 .END-2)CVAR 61 FORMAT(A81) READ(CVAR.IO)FLYTE.OCITY.DCIY.DTIME.ATIME.DAYS.DATE 100 FORMAT(A84X.2A31X.24.12X.11,11X.13) IFI(DATE.NE.377) GO TO 1 IF (OGITY.NE.CITY) GO TO 1 IF(DAYS.NE.1) GO TO I IF(OCITY.EQ.CITY) THEN TIME(N)-REAL(DTIME) TOFRM(N)-'to SERVES (N) -OCITY FLIGHT (N) -FLYTE ENDIF TOJLN(N)-TJLN(TIME(N)) GO TO 1 2
~NNI
WRITE (6.10) N10 FORMAT (15. - RECORDS ACCEPTED FOR PROCESSING-)
CALL OOSORT(TIME.N.NPOINT) C
WRITE (6.11) WRITE (6,12)
11 FORMAT (IX. * DELAY CAN ANALYZE UIP TO THREE SETS OF AIRPORT-)
C READ (6.13).NUMCAP
NLCAP-3
13 FORMAT 13)
14 FORMAT 1X,' ENTER HOURLY TAKEOFF CAPACITY FOR SET '.11) 15 FORMAT IX,' ENTER HOURLY LANDING CAPACITY FOR SET .I1)
00 3. I-I.NUMCAP C WRITE 6,14 C READ (6.16) NTCAP(I) NTCAP( )-(I+1).30 C WRITE (6.15) I C READ (6.16).NLCAP(I) NLCAP(I)-(I+1)*30 16 FORMAT (13) LSVC()-1 ./(REAL(NLCAP(I))/3600.) TSVCI)-1. REAL(NTCAP()/3600. PRINT
eLSVC(I
PRINT ., TSVC (I 3 CONTINUE CCCCCCCCCCCCCCCCCCCCC cCCCCCCCCccccccccccccccccCCCCCCCCCCCCCCCCCCCCCCC C INITIALIZATION OF DELAY MATRIXCC--- CCCCMCCCCCCCC CCC
DO 4 J-1,NUMCAP
TOUT(NPOINT(1).J)-TOJLN(NPOINT (1))
DELAY(NPOINT(1).J JTOUT(NPOINTM(1) , )-TOJLN(NPOINT(1)) IF(TOFRM(NPOINT (1)) .EO.'FROM') THEN
LASLDG(J)-TOJLN(NPOINT(1) LASTO(J)-O ELSE LASTO(J)-TOJLN(NPOINT(1)) LASLDG(J)-s ENDIF DELTO(J)-OELAY(NPOINT (I) ,4)
DELDG( J)-DELAY(NPOINT (I) , )
4 CONTINUE C DELAY CALCULATION C DO 5. I-2.N 00 6, J-1.NLCAP DELAY(NPOINT(I).J)-IF(TOFRM(NPOINT(I)).EQ.'from') GO TO 777 CCCCCCCCCC ---A CCCCCCCCCCCCCCCCCC-=-cct
C DEPARTURE DELAY LOOP
IF(TOJLN(NPOINT(I)).GT.(LASTO(J)+TSVC(J))) THEN TOUT(NPOINT(I) .J)-TOJLN(NPOINT(I)) LASTO(J)-TOUT(NPOINT(I).J) ELSE TOUT(NPOINT(I) .J)-LASTO(J)+TSVC(J) DELAY(NPOINT(I),J)-TOUT(NPOINT(I),J)-TOJLN(NPOINT(I)) LASTO (J)-TOUT(NPOINT(I).J) ENDIF DELTO(J)-OELTO(J)+DELAY(POINT(I) .J) GO TO 778 ---
o-o7a---C ARRIVAL DELAY LOOP
777 IF(TOJLN(NPOINT(I)).GT.(LASLDG THE 778 6 5 C CC TOUT(NPOINT(I).J)-TOJLN(NPOINT(I)) LASLDG(J)-TOUT(NPOINT(I).J) ELSE TOUT(NPOINT(I) .J)-LASLOG(J)+LSVC(J) DELAY(NPOINT(I).J)-TOUT(NPOINT(I).J)-TOJLN(NPOINT(I)) LASLDG(J)-TOUT(NPOINT(I).J) ENDIF DELDG(J)-DELDG(J)+0ELAY(NPOINT(I) .J) CONTINUE CONTINUE CONTINUE CCC--- COCCCCCCcCCCCCCCC OUTPUT SECTION DO 300 I-1.N HRS-INT(TIME(NPOINT(I) )/100.) MINS-MOD(TIME(NPOINT(I)).100.) C