1
T
HE PHYSICAL AND BIOLOGICAL
CONTROLS ON THE DISTRIBUTION OF
GASES AND SOLUTES IN SEA ICE FROM
ICE GROWTH TO ICE DECAY
Dissertation présentée par
JIAYUN ZHOU
En vue de l’obtention du titre de Docteur en sciences
Thèse réalisée en cotutelle, sous la supervision du Prof. Jean-Louis TISON,
Université Libre de Bruxelles – Laboratoire de glaciologie, et du Dr. Bruno
DELILLE, Université de Liège - Unité d’océanographie chimique
Septembre 2014
T
HE PHYSICAL AND BIOLOGICAL
CONTROLS ON THE DISTRIBUTION OF
GASES AND SOLUTES IN SEA ICE FROM
ICE GROWTH TO ICE DECAY
Contrôles physiques et biologiques sur la répartition des gaz et
solutés dans la glace de mer de la croissance à la fonte de la glace
Dissertation présentée par
JIAYUN ZHOU
En vue de l’obtention du titre de Docteur en sciences
Thèse réalisée en cotutelle, sous la supervision du Prof. Jean-Louis TISON,
Université Libre de Bruxelles – Laboratoire de glaciologie, et du Dr. Bruno
DELILLE, Université de Liège - Unité d’océanographie chimique
Thèse soumise le 6 septembre 2014
i The ongoing changes in the extent and the properties of sea ice, associated with the warming climate, are affecting the polar ecosystem and the interactions between the atmosphere, sea ice and the underlying waters. How sea ice biogeochemistry will change in the foreseeable future is currently uncertain, but is a crucial problem to tackle.
To better understand how sea ice biogeochemistry could change, we investigated the factors regulating the distribution of some dissolved compounds (e.g., nutrients, dissolved organic matter (DOM)) and gaseous compounds (e.g., Ar, O2, N2, CH4) in sea ice, from ice growth to ice decay. The results were obtained from a 19-day indoor experiment in Hamburg (Germany) and a five-month-long field survey in Barrow (Alaska). They were then compared to the physical properties of the ice (temperature, salinity, and other derived parameters such as brine volume fraction) and different biological parameters (bacterial activity, bacterial abundance, chlorophyll-a and phaeopigments).
Our work indicates that the physical properties of sea ice exert a strong influence on the distribution of the biogeochemical compounds in the ice, through their impact on brine dynamics, gas bubble formation and ice permeability. We have described 4 stages of brine dynamics, which affect the distribution of the dissolved compounds (e.g., silicate and DOM) in sea ice. However, inert gas (Ar) shows a different dynamic in comparison to the dissolved compounds, indicating a different transport pathway. We suggest that the formation of gas bubbles in sea ice is responsible for that different transport pathway, because gas bubbles should move upward owing to their buoyancy in comparison to brine, while dissolved compounds are drained downward due to gravity. Our observations further indicate that the critical permeability threshold for the upward gas bubble transport should range between 7.5 and 10 % of brine volume fraction, which is higher than the 5 % suggested for the downward brine transport. Increasing ice permeability and prolonged gas exchange tend to draw gas concentrations toward their solubility values, except when the under-ice water is supersaturated relative to the atmosphere (e.g., CH4) or when in-situ production occurs in sea ice (e.g., O2).
ii Because ammonium and O2 obviously accumulate in the ice layers where convection is limited, we suggest that the changes of these biogeochemical compounds in sea ice depend on the competing effect between the physical transport and the biological activity; the biological impact on these biogeochemical compounds in sea ice is obvious when the biological production rate exceeds largely the physical transport rate. We further discussed on the potential of using Ar and N2 as inert tracers to correct the physical controls on O2 and to determine the net community production in sea ice.
In addition to the physical and biological controls, the chemical properties of some biogeochemical compounds (e.g., nitrate, ammonium, DOM) may further influence their distribution in sea ice; further investigations are however needed to confirm this.
Finally, based on our findings, we present an update of the processes regulating the distribution of gases in sea ice, with references to recent observations supporting each of the process. We also provide some insights on how sea ice biogeochemistry could change in the future and the research priorities for an accurate quantification of these changes.
iii
RESUME
Les changements dans l’extension et les propriétés de la glace de la mer, liés au réchauffement climatique, affectent l’écosystème polaire, ainsi que les interactions entre l’atmosphère, la glace de mer et l’eau sous-jacente. Cependant, des incertitudes subsistent quant aux changements potentiels qui affecteront la biogéochimie de la glace de mer dans un futur proche.
Afin de mieux comprendre les changements potentiels qui affecteront la biogéochimie de la glace de mer, nous avons étudié les facteurs qui influencent la distribution de certains composés dissouts (e.g., nutriments, matière organique dissoute (DOM)) et gazeux (e.g., Ar, O2, N2, CH4) au sein de la glace de mer, depuis la croissance de la glace, jusqu’à sa fonte. Les résultats ont été obtenus à partir d’une expérience de 19 jours dans un bassin expérimental à Hambourg (Allemagne) et une étude de terrain de 5 mois à Barrow (Alaska). Ils ont été ensuite comparés aux propriétés physiques de la glace (température, salinité et autres paramètres dérivés) et à des paramètres biologiques (activité bactérienne, abondance bactérienne, chlorophylle-a et phaeopigments).
Nos travaux ont montré que les propriétés physiques de la glace exercent une forte influence sur la répartition des composes biogéochimiques dans la glace de mer, à travers leur impact sur la dynamique des saumures, la formation de bulles de gaz et la perméabilité de la glace. Nous avons décrit 4 stades dans la dynamique des saumures qui influencent la distribution des composés dissouts (e.g., silice et DOM) dans la glace. Cependant, le gaz inerte étudié (Ar) montre une dynamique différente de celle des composés dissouts, indiquant un mécanisme de transport différent. Nous suggérons que la formation de bulles de gaz dans la glace de mer est le mécanisme responsable de cette différence, parce que les bulles de gaz devraient migrer vers le haut, à cause de leur différence de densité par rapport aux saumures, alors que les saumures sont drainées vers le bas à cause de la gravité. Nos observations montrent également que le seuil critique de perméabilité pour l’ascension des bulles de gaz devrait se trouver entre 7.5 et 10 % de volume relatif en saumure ; seuil qui est plus élevé que les 5 % suggérés pour le transport de saumure vers le bas. L’augmentation de la perméabilité de la glace et les échanges de gaz prolongés tendent à amener les concentrations de gaz vers leur valeur de solubilité, sauf lorsque l’eau sous-jacente présente une sursaturation par
iv rapport à l’atmosphère (e.g., CH4), ou lorsque une production in-situ se produit au sein de la glace (e.g., O2).
Etant donné que l’ammonium et O2 s’accumulent clairement dans les couches de glace où la convection est limitée, nous suggérons que les variations de ces composés biogéochimiques dans la glace dépendent de la balance entre le transport physique et l’activité biologique ; l’impact de cette dernière sur les composés biogéochimiques est particulièrement visible lorsque le taux de production biologique du composé excède largement la vitesse d’élimination du composé par le transport physique. Nous avons ensuite discuté du potentiel d’utiliser Ar et N2 comme traceurs inertes pour corriger l’impact des processus physiques sur les variations de O2, afin de déterminer la production communautaire nette dans la glace de mer.
Les propriétés chimiques de certains composés biogéochimiques (e.g., nitrate, ammonium, DOM) pourraient également influencer leur répartition au sein de la glace de mer, en plus des processus physiques et biologiques. Cependant, il est nécessaire d’avoir plus d’études à ce sujet pour confirmer cela.
Enfin, sur base de nos résultats, nous présentons une mise à jour des processus qui régulent la répartition des gaz dans la glace de mer, avec des références à des observations récentes qui illustrent chacun des processus. Nous donnons également un aperçu des changements qui pourraient affecter la biogéochimie de la glace de mer à l’avenir, et des pistes de recherches pour une quantification précise de ces changements.
v
ACKNOWLEGMENTS
Mes remerciements vont d’abord à mes promoteurs, Louis Tison et Bruno Delille. Jean-Louis, un tout grand merci à toi pour m’avoir transmis ta passion sur la glace à travers les cours de Master, et puis de m’avoir donné l’opportunité de faire cette thèse chez toi. Merci aussi pour tes relectures détaillées de chacun de mes documents et tes impulsions d’énergie. Bruno, un tout grand merci à toi, surtout pour ta patience, ton attention et ton soutien durant les deux mois d’hiver à Scott Base. Merci également pour ta confiance en cette fin de thèse. Encore un tout grand merci à tous les deux pour avoir veillé sur moi durant ces 4 années de thèse ; merci pour votre écoute et conseils tant sur le plan professionnel que personnel. Vous êtes comme mon papa et ma maman de la vie professionnelle (je vous laisse choisir qui veut être le papa et qui veut être la maman)… Bien sûr, comme tout enfant qui détient des marques de ses parents, je constate que moi aussi, je commence à mettre des points de suspension dans mes mails, et que je traine un peu longtemps au téléphone… Vraiment, je me sens chanceuse de vous avoir tous les deux comme promoteurs : déjà, avoir un promoteur exceptionnel, qui est rigolo et humain, est une grande chance, mais avoir un deuxième, tout aussi gentil et humain, c’est quand même le jackpot !
I would like then to thank my thesis committee members, Lei Chou, Bernard Heinesch, David Thomas and Martin Vancoppenolle for their comments on my thesis. Lei, thank you for your kindness and attention. Bernard, thanks for teaching me the fundamentals of eddy covariance and for coming to my committee presentations from Gembloux. Martin, thanks for initiating me into the mysteries of modeling and for inviting me to give a talk at the LOCEAN. David, thank you for my mobile phone! (I HAVE to place that first, as it was so unbelievable); thank you also for your support during the Interice V experiment and your trust for the general paper afterwards.
I would like to extend my gratitude to my other collaborators: Hajo Eicken and Tim Papakyriakou, who have considerably improved my scientific writing skills; Gerhard Dieckmann, for his warm welcome at the AWI and his help during the Interice V experiment; Gerhard Kattner, Colin Stedmon, Harry Kuosa, and Hermanni Kaartokallio, for filling my gaps in river biogeochemistry and bacterial metabolism; one more “like” for Harry, for the guided tour and boat tour in Tvärminne! Thanks also to Linda Jørgensen, Riitta Autio,
Anne-vi Mari Luhtanen and Marie Kotovitch for the great time we had in Finland (especially, in the sauna); Karl-Ulrich Evers and the rest of the ice tank crew of the Hamburg Ship Model Basin (HSVA) for their support throughout the Interice V experiment, and Sébastien Moreau for his tolerance towards my mistakes (no no, I will not touch the remote anymore) and his patience during all the long meetings between modellers and experimentalists.
A special thanks to the New Zealanders: Tim Haskell, Simon Trotter, Peter McCarthy, Paul Woodgate and the others staffs of Antarctica New Zealand, for their help in organizing our stay in Scott Base and field survey in Cape Evans. Special thanks plus a big big hug to the winter-over team 2011-2012: Caro and Cliff for their efficient help on the field; Bobby for the yummy food supply; Tank and Jody, (the AHT’s) Martin, Jena for their great company; and of course!!! … *jingles*… Brian Staite! Brian, you are an amazing guy, my super-hero and secretly adopted grandpa. Despite the cold and harsh conditions during our winter-over, your cleverness made all the fieldworks much more easy-going than what they could have been without you. Your attention, kindness and positive attitude also make you the best-ever field-partner.
Ensuite, je voudrais remercier mes collègues de bureau de l’ULB. Merci à Gauthier Carnat, mon grand frère en sciences, que j’admire et envie secrètement pour sa connaissance encyclopédique. Merci pour ta compagnie à Scott Base, ton écoute, tes conseils et nos discussions philosophiques sur les choix d’un doctorant. Merci à Morgane, ma collègue de bureau talentueuse. Merci de ta compagnie durant le magnifique voyage que nous avions entrepris en Tasmanie ; merci de m’avoir soutenu dans mes délires annuels de réaménagement de bureau et d’avoir accepté de prendre la place de la secrétaire ; merci aussi pour tous les spectacles et fêtes auxquels tu m’as invité et qui m’ont permis de découvrir tes talents de danse, de chants, de cuisine, d’élevage … (euh… j’arrête ici parce que je suis limitée en nombre de pages :p). Merci au duo de choc, Saïda El Amri et Claire Lelouchier pour votre aide en laboratoire et pour ce qui est de l’administratif. Merci au chef, Frank Pattyn, pour tous les pizza break-outs et le partage des tes goûts artistiques. Ta sélection de jazz et tes cartes postales de peintures contrastent avec le bruit des machines du laboratoire et le couloir qui ne demande qu’à être rénové. Cela donne un petit côté surréaliste et inattendu, comme ton personnage. Merci à Véronique Schoemann, ma roommate à Scott Base, qui a bien veillé sur moi, surtout le jour de notre retour ;). Merci à Célia de m’avoir accueilli à Utrecht et de m’avoir appris plein de choses sur les isotopes et le méthane. Merci aux
vii modélisateurs et/ou matlab-users, Denis Callens, Brice Van Liefferinge, David Docquier, Reinhard Drews, Lionel Favier, qui m’ont certainement aidé à un moment ou un autre pour mes routines matlab. Merci aussi aux derniers arrivés, Thomas Goossens, Ceri Middelton, Sophie Berger et Mathieu Depoorter. Un nouvel arrivé = un anniversaire et d’autres évènements à fêter en plus = plein de drinks et de goûters ! Yeaaaah ! Encore un grand merci à Ceri, Morgane, Véro, Gauthier et Lionel, pour avoir relu des parties de ma thèse, et merci à tous pour la bonne ambiance au labo. Vous allez me manquer l’année prochaine Merci à mes ex-collègues de bureau, aînés et coachs, Marie Dierckx, Charlotte Delcourt, Lt. Dr. Ir. Frédéric Brabant, Thierry Boerenboom, Nicolas-Xavier Geilfus, et François Fripiat, pour vos conseils, en matière de gestion de la thèse et des papiers administratifs… même si, j’arrive quand même à me retrouver dans une situation administrative hyper compliquée... Merci d’ailleurs à l’administration de l’ULB, pour les petits coups d’adrénaline de dernières minutes.
Merci aussi à mes collègues à l’ULg : Alberto Borges, François Darchambeau, Willy Champenois, Jérôme Harlay, Marc-Vincent Commarieu, Aurore Beulen, Fleur Roland, Gaëlle Speeckaert, Sandro Petrovic et Thibault Lambert. Merci pour votre accueil et pour le partage de vos passions sur les estuaires belges et les lacs africains. Un grand merci à Willy aussi pour les superbes photos durant la mission Yrosiae, et le partage de ton bureau (que tu ne savais peut-être pas) quand je suis à l’ULg.
Of course, I would like to thank the F.R.S.-FNRS for all the financial supports. These were crucial for my attendance to diverse conferences, summer school, etc., where I had to opportunity to share my findings and where I met several super-friendly scientists. Thanks to Alice Pestiaux, François Massonnet, and Daniel Price for the funny and unforgettable games in Svalbard; Philipp Griewank for the great time we had in Svalbard and in Hamburg; Cecilia Peralta Ferriz, for the great time in Ventura, and for hosting me in Seattle; Paul Cziko for the ice fishing near Scott Base; Denis Poëhler, for the tour in New Zealand; Inka Koch, Inga Smith, Greg Leonard and Pat Langhorne for their warm welcome when I was in Dunedin, and thanks to Inga and Greg for hosting me in their amazing house. Merci aussi à Julie pour ton hospitalité à Hobart, tes conseils sur les endroits à visiter en Tasmanie et tes tuyaux pour repérer la présence des wombats hihihi.
viii Je remercie bien évidemment Isabelle Jacobs et Benoît Collet, pour m’avoir fait découvrir tous des styles de musiques différentes, sans oublier les deux autres flûte2, Sophie Verschuren et Philippine Stalins, et le reste de l’ensemble Anacruz, pour les super concerts (oui, c’est peut-être bien un euphémisme) et surtout la dernière soirée de barbecue chez Anne-Laure qui a été agréablement surréaliste. C’était vraiment chouette d’avoir pu travailler avec vous. Et promis, je continuerai à m’entraîner aux states pour notre rendez-vous en Argentine ;)
Merci aussi à ceux et celles qui ont veillé sur ma vie sociale : Stéphane Vranckx, Aurore Woller, Mathieu Caby et Guillaume Jumet, pour les après-midis sushis et rédaction ; mais également, Nathalie Meganck, Cindy Wilvers, Laurie Massaad, Laura Marcus, Thomas Still, Deborah Manderlier, David Mathieu, Emilie La, Alex Chen, Manu Chiambretto, Lucien Culot (Le Maître du monde pour les intimes), Thibault De Laet, Olivier Vossen, Gregory De Greef, Sophie Schools, Thomas Hofer, Caroline Veiders, pour les nombreux voyages ; les soirées toujours bien arrosées avec les PAF ; les discussions délirantes, surtout avec Lucien ; les concours de celui-qui-mange-le-plus-de-bidoche chez Greg, etc. etc.
謝謝我教會裡的弟兄姊妹,尤其是青少年團契的張潔,唐嘉鴻,林芳儀和應懷媛。和你們一起 帶領敬拜和青少年團契真的是讓我學習和領受到很多。 最後我要謝謝我的爸爸,媽媽和妹妹。爸爸,雖然你已經回天家了,但跟你在一起的點點滴滴 我都沒有忘記。記得從小你就教導我要好好讀書,將來要做一個有用的人。。。我不知道我現 在算不算是個有用的人,但最起碼,我有好好讀書,用心工作;我希望你會為今天的我而自豪 。媽媽,謝謝你。謝謝你的愛心湯水,謝謝你的照顧,謝謝你為我禱告。雖然你愛我的方法有 點與眾不同,有時候會讓我不知所措,但我知道那是因為你太過愛護我。 我也謝謝嘉慧。謝謝傻乎乎的你令嚴肅的我多了笑容。
ix
CONTENT
ABSTRACT ... i RESUME ...iii ACKNOWLEGMENTS ... v CONTENT ... ix Chapter I – Motivation ... 1Chapter II – State of the art ... 4
1 The crystal structure of sea ice ... 6
2 Sea ice formation and the incorporation of impurities in sea ice ... 7
2.1 Frazil ice ... 10
2.2 Columnar ice ... 11
2.3 Platelet ice ... 12
2.4 Snow ice ... 14
2.5 Superimposed ice ... 14
2.6 Large-scale deformation of sea ice covers ... 14
2.7 Implications of sea ice texture and morphologies on the distribution of biogeochemical compounds ... 14
3 Characterization of the physical properties of sea ice ... 15
3.1 Brine volume fraction ... 16
3.2 Brine salinity ... 17
3.3 Water stable isotopes in sea ice (δ18O, δD)... 18
4 Initial incorporation and transport processes in sea ice ... 19
4.1 The transport of brine ... 19
4.1.1 Processes regulating the vertical distribution of salinity in sea ice ... 19
4.1.2 Significance of each process regulating the vertical distribution of salinity in sea ice ... 23
4.1.3 The mushy-layer theory and its implications ... 24
4.1.4 The relationship between the brine volume fraction and sea ice permeability ... 27
4.1.5 A synthesis on the relationship between the brine volume fraction, sea ice permeability, and brine transport ... 29
4.2 Transport of gaseous compounds ... 29
4.2.1 Comparison with the transport of sea salt ... 29
4.2.2 Gas exchange at the air/ice interface, the specific particularity of the transport of gases in comparison to salts ... 30
x
5 Biogeochemical processes in sea ice ... 32
5.1 Abiotic processes ... 32
5.1.1 Mineral precipitation... 32
5.1.2 Gas bubble formation ... 33
5.1.3 The particular case of calcium carbonate precipitation ... 34
5.2 Biotic processes... 35
5.2.1 Inorganic nutrient dynamics ... 36
5.2.2 Organic matter ... 38
5.2.3 Biogas production and consumption ... 39
6 Constraints on observations and measurements ... 41
6.1 Demand for long-time survey ... 41
6.2 Spatial variability ... 42
6.3 Measurement methods ... 42
Chapter III – Objectives ... 44
Chapter IV – Thesis outline ... 45
1 Manuscript presented in the present thesis ... 45
2 Additional contribution to the peer-reviewed literature ... 48
Chapter V - Physical and bacterial controls on the distribution of inorganic nutrients and DOC in sea ice during an experimental ice growth and decay cycle ... 51
Abstract ... 52
1 Introduction ... 52
2 Material and methods ... 54
2.1 Experimental setting and sampling routine ... 54
2.2 Physical characteristics of the ice ... 58
2.3 Nutrients and DOC ... 59
2.4 Bacterial abundance and production ... 59
2.5 Data normalization and enrichment factor ... 60
3 Results ... 61
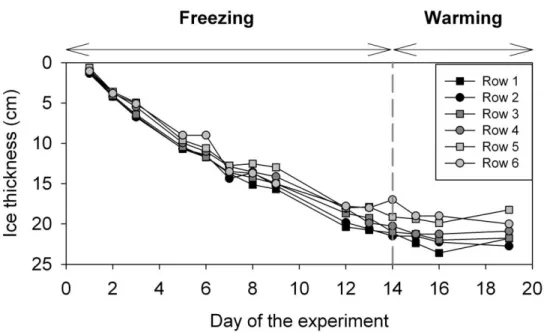
3.1 Ice thickness ... 61
3.2 Physical properties of the ice ... 61
3.3 Nutrients and DOC ... 63
3.4 Bacterial abundance and production ... 66
4 Discussion ... 69
4.1 Physical imprints on nutrient incorporation ... 69
4.2 Bacterial growth, production and imprints on nutrient concentrations ... 71
xi
4.4 Conclusion and perspectives ... 73
Acknowledgments ... 74
Chapter VI - Physical and biogeochemical properties in landfast sea ice (Barrow, Alaska): Insights on brine and gas dynamics across seasons ... 76
1 Introduction ... 77
2 Material and Methods ... 78
2.1 Study site and sampling scheme ... 78
2.2 Thin sections ... 78
2.3 Ice temperature and salinity ... 78
2.4 Brine volume fraction and brine salinity ... 79
2.5 Rayleigh number ... 79
2.6 Stable isotope of water ... 80
2.7 Nutrients and Chl-a ... 80
2.8 Argon ... 80
3 Results ... 80
3.1 Physical framework ... 80
3.2 Isotopic Composition ... 81
3.2.1 Sea ice isotopic composition ... 81
3.2.2 Brine isotopic composition ... 81
3.3 Nutrients ... 83 3.4 Chlorophyll-a... 84 3.5 Argon ... 85 4 Discussion ... 86 4.1 Physical framework ... 86 4.2 Isotopic composition ... 87
4.2.1 Sea ice isotopic composition ... 87
4.2.2 Brine isotopic composition ... 87
4.3 Nutrients ... 87
4.4 Chlorophyll-a... 88
4.5 Argon ... 89
5 Conclusion and perspectives ... 92
Acknowledgments ... 93
Chapter VII - Physical controls on the storage of methane in landfast sea ice ... 94
Abstract ... 95
1 Introduction ... 95
xii
2.1 Study site and physical framework ... 96
2.2 CH4 concentrations in seawater ... 96
2.3 CH4 concentrations in bulk ice and brine ... 97
3 Results ... 97
3.1 CH4 concentrations in ice CH4 concentrations in brine ... 97
3.1 CH4 concentrations in brine ... 98
3.2 CH4 concentrations in seawater ... 98
3.3 Discussion ... 98
3.3.1 Impact of biological activity on CH4 concentrations... 98
3.3.2 Impact of physical processes on CH4 concentrations ... 100
4 Conclusions and perspectives ... 102
Appendix A: Relationships between chlorophyll a and CH4 concentrations and between phosphate and CH4 concentrations in sea ice ... 103
Acknowledgments ... 103
Chapter VIII - Insights into oxygen transport and net community production in sea ice from oxygen, nitrogen and argon concentrations ... 104
Abstract ... 105
1 Introduction ... 105
2 Materials and methods ... 107
2.1 Sampling area and sampling events ... 107
2.2 Chlorophyll a and phaeopigment ... 108
2.3 O2, Ar and N2 concentrations in ice and their respective solubility ... 108
2.4 O2/Ar and O2/N2 ... 110
2.5 Deviation of the O2/Ar from saturation ... 112
3 Results ... 113
3.1 A general overview from the standing stocks ... 113
3.2 Gas saturation levels ... 113
3.3 O2 concentrations ... 114
3.4 Chlorophyll a and phaeopigment concentrations ... 116
3.5 O2/Ar and O2/N2 ... 116
4 Discussion ... 117
4.1 Overview on the dynamic of O2 in comparison to those of Ar and N2 ... 117
4.2 Gas incorporation during ice growth ... 118
4.3 Gas accumulation subsequent to ice formation ... 119
4.3.1 Gas bubble formation due to biological activity ... 119
4.3.2 Void formation in warming sea ice ... 121
xiii
4.4 Difference in the changes of standing stocks between O2 and both Ar and N2 ... 121
4.5 Gas exchange at the bottom of the ice ... 123
4.6 Caveats and uncertainties when calculating NCP from O2/Ar with O2/N2 in sea ice124 4.6.1 O2/N2 and O2/Ar trends in this study ... 124
4.6.2 Biases on [O2]eq/[Ar]eq and [O2]eq/[N2]eq due to physical processes ... 125
4.6.3 Biases on [O2]eq due to physical processes ... 126
4.7 Estimate of [O2]bio and NCP and in sea ice ... 126
4.7.1 The impermeable layers ... 126
4.7.2 The permeable layers ... 128
5 Conclusion and perspectives ... 129
Acknowledgements ... 131
Chapter IX – Conclusions ... 132
1 The most relevant processes affecting the dynamics of solutes and gases in sea ice ... 132
2 Implications of our findings on regional scale and in a climate change perspective... 134
2.1 Sea ice retains the more labile form of DOC ... 135
2.2 Gas bubble formation enhances gas accumulation in sea ice, and possibly their transfer towards the atmosphere... 135
2.3 The 3 main stages of brine dynamics from ice growth to ice decay ... 136
2.4 The role of sea ice in the CH4 cycle ... 136
2.5 O2/Ar, a new method for studying net community production in sea ice ... 137
3 Revision of the processes regulating the distribution of gases in sea ice ... 137
4 Research perspectives ... 139
4.1 Multi-year sea ice ... 139
4.2 Exchanges at the ice-water and ice-air interfaces ... 139
1 Sea ice forms from the freezing of seawater [WMO, 1970]. It covers about 7 % of the Earth’s ocean surface [Vaughan et al., 2013] and plays an important role in the climate system, the ocean circulation and the global biogeochemical cycles. Indeed, sea ice formation increases the albedo of the ocean surface and reduces the exchange of heat, moisture and momentum between the ocean and the atmosphere. Sea ice formation further leads to the rejection of brine in the upper layers of the ocean, inducing thereby deep-water formation, while sea ice melt induces water mass stratification. Finally, sea ice affects the global biogeochemical cycles either directly, through the biogeochemical processes within the ice, or indirectly, through the exchanges of gases and fluid at the air-ice and ice-ocean interfaces [Vancoppenolle et al., 2013b, for a review]. The significance of that last role of sea ice is the less well quantified at large scales, because the involved processes are not precisely understood or quantified [Vancoppenolle et al., 2013b]. The most relevant processes are given here below.
First, sea ice biogeochemistry affects the primary production in the polar oceans. Sea ice hosts microorganisms, which produce organic matter depending on the light and nutrient availability. Therefore, by hosting microorganisms, sea ice extents the duration of the primary production in the polar oceans and provides food source for the higher trophic-level species in winter and early spring. The thickness of sea ice and the snow cover further alter the light available for the phytoplankton production in the under-ice water. In addition, when sea ice melts, it stratifies the surface water, releases organic matter and nutrients, and in particular trace metals like iron, which affect phytoplankton growth in the iron-limited Southern Ocean. However, one main uncertainty is the partitioning of the released materials: how much is in-situ remineralized, and how much is exported to the seafloor?
Second, sea ice affects the exchanges of gases between the atmosphere and the ocean, and in particular, the exchanges of climate-active gases, like carbon dioxide CO2, dimethylsulfide DMS and methane CH4. Although sea ice has long been assumed to be an inert and impermeable ice layers that impede all gas exchanges between the atmosphere and the ocean, recent measurements of CO2 [Delille et al., 2007; Geilfus et al., 2012; Nomura et al., 2010; Papakyriakou and Miller, 2011], DMS [Nomura et al., 2012; Zemmelink et al., 2008] and CH4 fluxes [He et al., 2013] at the ice-air interface indicates that sea ice is permeable.
2 Theoretical considerations [Golden et al., 1998] and laboratory experiments [Gosink et al., 1976; Pringle et al., 2009] further support that sea ice may be permeable under specific conditions of temperature and salinity. Therefore, by assuming that sea ice is impermeable, we underestimate the duration of gas exchange between the ocean and the atmosphere. In addition, brine rejection associated with sea ice formation may also drain gases to the surface ocean [Rysgaard et al., 2007]. The issue of gas exchange through sea ice is further complicated by the biogeochemical processes that occur within the ice: carbonate precipitation [Geilfus et al., 2013; Rysgaard et al., 2011] and microbial activity within the ice change the amount of CO2 in transit through sea ice [Geilfus et al., 2012], and in-situ biological production affects oxygen O2 and DMS [Delille et al., 2007]. Thus, sea ice is not simply a physical barrier across which a certain amount of gases transits, it is also a platform where the production and consumption of some biogases occur.
CO2 is one of the most studied gases in sea ice. The concentrations of CO2 in the ice not only depends on the air-ice exchange of CO2, but also the export of inorganic carbon transport with brine rejection, calcium carbonate precipitation and biological activity in sea ice. Although the mechanisms responsible for the changes in CO2 concentrations in sea ice are identified, their significance has been rarely quantified [Vancoppenolle et al., 2013b]. As a result, the overall contribution of sea ice in terms of air-ocean gas exchange is still debated. Some claim that Antarctic sea ice may accounts for 58 % of the annual uptake of CO2 in the Southern Ocean [Delille et al., 2014], while others claim that sea ice from the Bering Sea accounts for less than 2 % of the annual CO2 fluxes [Cross et al., 2014].
DMS has drawn considerable interest, because the oxidation of DMS may produce sulphate aerosols, which affect the radiative properties of the atmosphere, with a potential cooling effect on the planet [Charlson et al., 1987]. Sea ice has been suggested to be a potentially important source of DMS in the polar oceans, because the microorganisms in sea ice produce large amounts of dimethylsulfoniopropionate DMSP, the precursor of DMS. Sea ice melt is indeed associated with an increase of the DMS concentration in the surface water, which may contribute to the regional oceanic DMS emission [Levasseur et al., 1994; Tison et al., 2010; Trevena and Jones, 2012]. DMS fluxes through sea ice before ice melt may represent an additional source of DMS, but very few measurements have been done [Nomura et al., 2012; Zemmelink et al., 2008]. Therefore, a general picture of DMS emission over the whole Arctic and Antarctic sea ice is missing, and the contribution of sea ice to the global DMS emission is currently unknown.
3 CH4 is an important greenhouse gas which accounts for 20 % of the global radiative forcing of well-mixed greenhouse gases [Myhre et al., 2013]. Its emission from the destabilized permafrost and hydrates in the Arctic shelf regions, associated with the ongoing climate warming may have positive feedback on the climate, as it occurred in the past [O'Connor et al., 2010]. The role of sea ice in that scenario is uncertain. To date, CH4 measurements in sea ice are scarce [Lorenson and Kvenvolden, 1995; Shakhova et al., 2010b], but some suggest that sea ice impedes air-ice CH4 exchange [He et al., 2013; Kitidis et al., 2010; Kort et al., 2012; Shakhova et al., 2010b], and that CH4 oxidation could occur in the ice [He et al., 2013] and in the under-ice water [Kitidis et al., 2010], based on CH4 measurements in air and seawater. It has also been suggested that the degradation of DMSP could produce CH4 in seawater [E. Damm et al., 2010], but whether the same pathway could occur in sea ice where large DMSP concentrations are found is currently uncertain.
In the Arctic, sea ice extent has drastically decreased over the last thirty years (decrease of 13.5 % and 4.1% per decade for multi-year ice and first-year ice respectively) [Vaughan et al., 2013]. In Antarctica, despite the overall increase of sea ice extent (1.8 % per decade), regional variability is large [Vaughan et al., 2013], and model simulations project significant decrease of the Antarctic sea ice extent by the end of this century [Arzel et al., 2006]. In that context, we may wonder how the sea ice related biogeochemical cycles will change; in particular, how the exchanges of the climate-active gases will be affected, and would it have feedbacks on the climate. Earth system models could help to answer these questions, but since they currently represent sea ice as a biogeochemically inert blanket, a first step would be to identify the most relevant processes to implement in the models.
The overarching objective the thesis is thus to identify the most relevant processes regulating the dynamics of solutes and gases in sea ice. The work is based on observations made on experimental ice and Arctic first-year sea ice. The focus on first-year ice is motivated by its proportion to the total amount of ice; it accounts for 60 and 80 % of the maximum sea ice extent in the Arctic and Antarctica, respectively [Vaughan et al., 2013]. That percentage is increasing in the Arctic, because the loss of multi-year ice was more drastic than the loss of first-year ice (Figure 3a on http://nsidc.org/arcticseaicenews/2014/09/). Focusing on Arctic first-year ice is also relevant for studying the interactions between sea ice and the emission of CH4 from the Arctic shelf regions as described earlier.
4 Before identifying the most relevant processes affecting the dynamics of solutes and gases in sea ice, we will first review the state of the art on the biogeochemical compounds in sea ice, with a focus on the differences compared to seawater. The most important concepts are synthesized here below, with references to the more detailed explanations in the next sections.
1. Sea ice is a heterogeneous material
Although sea ice is formed from the seawater, the biogeochemical compounds are not homogeneously distributed as they were in seawater (section 1). Most of the solutes and gases are concentrated in the brine inclusions within the pure ice matrix. Therefore, the physical transport of solutes and gases (section 4) are mainly exchanges between the atmosphere, the brine inclusions and the ocean; not with the pure ice matrix.
The brine volume fraction, which is the percentage of the total ice volume occupied by brine, is a function of the ice temperature and ice salinity (section 3). Assuming that all the solutes and gases are in brine inclusions, dividing the measured concentrations in bulk ice by the brine volume fraction (section 3) allow to assess the concentration in brine.
The heterogeneous structure has also implications on the measurement techniques. Ice melting may induce biases in the estimate of the biological activity, due to the realted osmotic shock on the microorganisms. It may also dissolve some mineral precipitates, which change the concentrations of some dissolved compounds. Other examples are given and further described in section 6.
2. The concentrations of solutes in sea ice
Both physico-chemical and biological processes may affect the concentrations of solutes in sea ice (section 5). To assess the significance of the concentration of a solute in sea ice, we need to compare it with a reference value; that reference value could be determined by the dilution curve. A solute is said conservative against salinity, i.e., it was incorporated (section 2) and transported (section 4.1) in the same way as salts, if its concentration in the ice increases linearly with the ice salinity, along the dilution curve. Deviation of the solute concentration from the dilution curve is generally attributed to biological processes (section 5.2).
5 3. The concentrations of gases in sea ice
Similarly to the solutes, physico-chemical and biological processes also affect the concentrations of gases in sea ice (section 5). However, the transport of gases through sea ice may be different to that of the solutes for two reasons. First, gas exchange could occur at the air-ice interfaces (section 4.2); while most of the solutes are drained out of the ice, at the ice-ocean interfaces, through brine drainage (section 4.1). Second, gases may be present in the form of gas bubbles, which should tend to move upward – if the ice is permeable – while the dissolved gases tend to move downward, as the other solutes, due to brine drainage (section 4.1).
The saturation level of a gas is a crucial parameter determining the gas fluxes at the ice-air interfaces, and affects gas bubble formation (section 5.1.2). Gas supersaturation, i.e., gas concentration that is higher than its solubility, could easily occur during ice growth, because of the brine concentration effect and the decrease of gas solubility. First, decreasing ice temperature decreases the brine volume fractions, which increases the concentration of the dissolved gases in brine; this is the so-called brine concentration effect (section 3). Second, decreasing ice temperature tends to increase gas solubility, but its associated increase of brine salinity (section 3.2) over-compensates the effect of cooling on the solubility, and induces a net decrease of gas solubility. In addition to these physical processes, biological activity and mineral precipitation could also affect gas saturation. Gas supersaturation could lead to ice-air gas fluxes if the ice is permeable, and the formation of gas bubbles, if the sum of the partial pressures of all the dissolved gases is higher than the local hydrostatic pressure.
6 The detailed section of the state of the art starts from here. It first describes the crystal structure (section 1) and the different textures of sea ice (section 2), which play an important role in the distribution of the biogeochemical compounds (e.g., gases, nutrients) in sea ice during sea ice formation. Section 3 describes the physical parameters of sea ice which have been proven to affect the transport of the biogeochemical compounds (section 4) and the biogeochemical processes in sea ice (section 5). Section 6 further highlights the observational constraints related to the sampling and the measurements of the biogeochemical compounds.
1 The crystal structure of sea ice
At the Earth’s surface, water crystallises in the Ih structure, with the « h » indicating the hexagonal crystal system, as described in Figure 1 [Weeks, 2010]. The water molecules (H2O) are arranged tetrahedrally around each other, and the so-formed crystal system is
characterized by four axes: three equivalent a-axes, which lie in a basal plane separated by angles of 120°, and the c-axis, which is oriented perpendicular to the basal plane [Weeks, 2010]. The c-axis is the principal crystallographic axis, because it is the axis of maximum (six-fold) rotational symmetry; it is also referred to as the optic axis of the crystal, i.e., the direction along which a ray of transmitted light can go through the crystal without undergoing double refraction, and perpendicular to which the ray cannot pass [Hobbs, 1974, p. 200-205]. It is based on the optical properties of the c-axis that the universal stage system determines the exact orientation of each crystal in a thin section [Langway, 1958].
Because of the tetrahedral arrangement of the water molecules, the ice Ih has a lower density than liquid water; this allows sea ice to float [Weeks, 2010]. However, despite the low density of the ice Ih, only few species of ions and molecules, with specific size and/or electric charge, may be incorporated in the ice crystal lattice (e.g., F-, HF, NH4+, NH3 and to a minor extent,
HCl, HBr and HI) [Hobbs, 1974, p. 112-119 and references therein]. In contrast, most of the impurities that were present in seawater (e.g., Na+, Cl-, K+, Ca2+, Mg2+, SO42-, CO32-) are not
incorporated into the ice crystal lattice, and are rejected ahead the advancing ice-water interface during ice growth [Petrich and Eicken, 2010]. Therefore, although sea ice is formed from seawater, the biogeochemical compounds that were initially present in seawater are no longer homogeneously distributed in sea ice. Instead, the water molecules form a matrix of pure ice, whereas most of the biogeochemical compounds are concentrated in the brine inclusions.
7 Figure 1 Crystal structure of sea ice (from Weeks and Ackley [1986]) on the left. The central panel presents the arrangement of oxygen atoms along (top) and perpendicular (bottom) to the c-axis (symmetry axis of order-6). The 3 a-axes (symmetry of order-2) are lying within the basal plane (left panel).
2 Sea ice formation and the incorporation of impurities in sea ice
Macroscopically, the matrix of pure ice presents different types of ice textures depending on the conditions of sea ice formation.There are three main types of ice textures associated with ice growth (frazil ice, columnar ice and platelet ice) and two others associated with the presence of snow on the top of the ice and ice melt (snow ice and superimposed ice); these are summarized by Petrich and Eicken [2010] in Figure 2. At larger scale, sea ice cover presents different morphologies which are classified according to their genetic processes (ice growth, melt or deformation), their ice age and their thickness [Petrich and Eicken, 2010] (Figure 3) (see also aspect.antarctica.gov.au for a glossary based on WMO [1970] and an image library of the most commonly encountered ice types).
8 Figure 2 Scheme summarizing the main ice textures encountered in different ice growth conditions and at time scales for first-year ice [Petrich and Eicken, 2010]
9 Figure 3 Large-scale morphologies of sea ice cover associated with ice growth, melt and deformation processes [Petrich and Eicken, 2010]
10 2.1 Frazil ice
The top of sea ice cores generally consists of frazil ice, because they are the first ice crystals to form in the open ocean, under agitated conditions (wind and waves). They have granular texture, with rounded millimetre-sized crystals, but could take the shape of needles, spicules or platelet, and are often intertwined with aggregates [Weeks and Ackley, 1986].
According to Weeks and Ackley [1986], the frazil ice found at the surface of sea ice forms as following. In winter, when seawater cools down, it becomes denser than the underlying (relatively warmer) seawater. This is because the temperature of the maximal density of seawater is below its freezing point (Figure 4). As a result, the relatively cooler and denser body of seawater sinks, while the relatively warmer and less dense water at depth rises, causing a mixing process [e.g., Foster, 1968] termed “convection” or “convective overturning” [Petrich and Eicken, 2010]. Theoretically, that convection will continue until the entire mixed layer is at the freezing point. In practice, however, frazil ice crystals may form before that the entire mixed layer has reached the freezing point, because the aggregates in seawater may serve as nucleation site for ice crystals [Petrich and Eicken, 2010]. Frazil ice has a granular texture, because the convective overturning is usually supported by wind and waves, which break the new protrudes of the growing ice crystals; it is often intertwined with aggregates, which are entrained with the ice crystals in suspension during the convective overturning [Weeks and Ackley, 1986]. That process of entrainment is also referred to as harvesting or scavenging [Garrison et al., 1983; Weissenberger and Grossmann, 1998].
Figure 4 Temperature of the maximum of density tρmax and the freezing point tg of seawater for
11 While the layer of frazil ice is millimetre-thick in the Arctic, it is generally much thicker in the Southern Ocean, because the higher wind speeds and the open-configuration of the Southern Ocean allow a larger number of openings in the ice (i.e., leads and polynyas – see ice deformation, divergent regimes in Figure 3), which favour the formation of frazil ice [Weeks and Ackley, 1986]. Frazil ice growing in these turbulent waters may also aggregate into larger floes of crystals than in the Arctic (e.g., pancake ice, Figure 3) [Lange et al., 1989]. 2.2 Columnar ice
Following the consolidation of a surface ice layer composed of frazil ice, which reduces the wind- and wave-driven turbulence, a relatively quiet ice growth condition develops; the formation of columnar ice may then take place through downward congelation. The process leading to congelation ice formation is well described in Petrich and Eicken [2010] and is summarized here below.
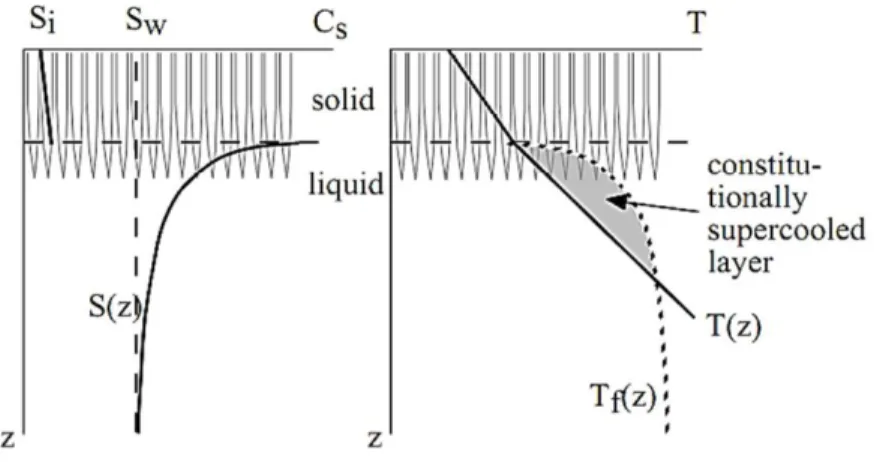
As described in section 1, growing sea ice rejects most of the impurities in brine (including salt), because they are not incorporated in the ice crystal lattice. The rejected salt thus increases the salinity of a thin layer, which is a few millimetres to a few centimetres thick, ahead of the advancing interface; this results in a transport of salt from the more saline ice/water interface toward the less saline seawater (see section 4 for a detailed description of the transport process). At the same time, assuming thermodynamic equilibrium, the increase of salinity at the ice-water interface goes along with a decrease of the freezing point and a decrease of the temperature (Figure 4). As a result, there is a heat flux in the opposite direction (i.e., from the seawater towards the ice-water interface). Because heat transport occurs faster than the transport of salt, the thin layer ahead of the ice-water interface is said constitutionally supercooled; in other words, the temperature of the layer is below the salinity-dependent freezing point (Figure 5).
Any ice crystal that protrudes into the constitutionally supercooled zone will have an advantaged ice growth, because the heat released from the formation of the protrusion is conducted away from the ice-water interface (either upward through the ice, or downward, into the heat sink of the supercooled water layer). In addition, that ice crystal will grow faster than adjacent crystals, because it will reject the salt, which reduces the freezing point of the brine along its boundaries, making ice growth more difficult just next to it. Further, because ice grows faster in the basal plane, crystals with horizontal axes will outgrow those with c-axes off the horizontal (this is the so-called “geometric selection”). As a result of the previous
12 processes, the ice/water interface generally consists of submillimetre-thick vertical lamellar blades of ice crystals (termed “columnar ice” texture), separated by narrow films of brine (termed “brine layers”) (Figure 5), and the layer where the ice volume fraction varies from 0 to 30 % is referred to as the skeletal layer.
Figure 5 Drawing of the lamellar ice crystals and representation of the changes of salinity (left) and temperature (right) below the ice/water interface (dashed horizontal line). Tf(z) is the freezing
temperature for the actual salinity (S(z)). The shaded area where (T(z)) is below the Tf(z) is the
constitutionally supercooled layer [Petrich and Eicken, 2010] .
As the skeletal layer further grows (i.e., addition of ice underneath), the ice temperature will decrease in the upper part of the skeletal layer; the water molecules in brine will freeze, adding ice to the existing ice blades, and resulting in a decrease of brine volume fraction. Eventually, the ice lamellae join up to form the so-called pure ice matrix, with isolated brine inclusions which concentrate almost all the impurities of the ice.
2.3 Platelet ice
Although platelet ice may have resulted from the processes described for granular frazil ice or columnar ice, it has neither the granular or columnar texture. Platelet texture is made of elongated (needle-like) grains, both in the vertical and horizontal thin sections [Lange, 1988] and could present a mixed platelet/congelation facies [Jeffries et al., 1993] (see [Tison et al., 1998] for a detailed description and illustrations of the different types of platelet textures). The highly disorganized texture of platelet ice (i.e., with crystals extending in all directions) results from a repetitive cycle of in-situ ice growth and freezing of voids in between the randomly orientated platelets [Dempsey and Langhorne, 2012]. The process of platelet formation is still discussed, but appears that to be associated with the presence of supercooled
13 water [Crocker and Wadhams, 1989; Eicken and Lange, 1989; Jeffries et al., 1993; Lewis
and Perkin, 1983].
In the vicinity of Antarctic ice shelves, platelet ice may form at deep water-depths [Dieckmann et al., 1986], in supercooled ice shelf waters (ISW) which formation is associated with the deep thermohaline convection (DTC). Sea ice growth and the associated salt rejection contribute to the formation of the cold and saline high salinity shelf water (HSSW), which adiabatically descends to the ice shelf grounding line and melts the continental glacial ice (as it is warmer than the local freezing point at depth). The mixing between the meltwater and the HSSW forms the ISW, which rises adiabatically under its buoyancy and becomes supercooled (due to the changes of freezing point with depth) [Crocker and Wadhams, 1989; Eicken and Lange, 1989; Foldvik and Kvinge, 1974; Jacobs et
al., 1992]. Frazil ice crystals that unrestrainedly nucleate and grow from that supercooled
ISW form platelet ice crystals [Jeffries et al., 1993], which may then float or be dragged by the ISW to the front of the ice shelf, where they accrete at the bottom of sea ice [Tison et al., 1998].
Direct nucleation and growth of platelet ice at the bottom of an existing ice cover from a supercooled water mass is also possible [Gow et al., 1998]. The formation mechanism is thus similar to that of columnar ice, but since platelet ice directly grows into the supercooled water, while columnar forms its own pool of supercooled water through salt rejection (section 2.2), in-situ grown platelet ice presents a more disorientated texture than columnar ice, although less random than the “buoyant” platelet ice (described here above) [Gow et al., 1998].
In Arctic, where large ice shelves are absent, platelet ice is scarce and supercooling is more usually associated with under-ice melt ponds [Eicken, 1994; Jeffries et al., 1995] where double diffusion occurs (i.e, supercooling induced by the more rapid transfer of heat than salt between the under-ice meltwater and the surrounding water mass) [Martin and Kauffman, 1974].
14 2.4 Snow ice
Snow ice is frequently observed in the Southern ocean, where the snow is sufficiently thick, in comparison to the ice thickness, to depress the ice under the sea level (i.e., negative freeboard). Seawater may thus infiltrate laterally and vertically, floods the ice surface and subsequently refreezes with the water-saturated snow to form snow ice [Fritsen et al., 1998]. Because snow ice has also a granular texture as for frazil ice, stable water isotope measurements are useful to discriminate the two ice types [Eicken, 1998; Lange et al., 1990] (section 3.3).
2.5 Superimposed ice
In late summer, surface snow melt may percolate into the underlying snow. Depending on the snow permeability and the thermal regime of the ice, the meltwater can refreeze as a distinct bubble-free layer of pure ice within the snow or at the snow/ice interface, forming the superimposed ice [Haas et al., 2001; Nicolaus et al., 2003].
2.6 Large-scale deformation of sea ice covers
Depending on the intensity and the direction of winds and depending on the ocean circulation, sea ice cover may experience a convergent or divergent regime over a large extent (Figure 3). Divergent regimes may results in the formation of opening in the pack of ice: (with increasing width) cracks or fractures, leads or polynyas. Cracks and fractures do not allow the navigation of surface vessels, in contrast to leads and polynyas [WMO, 1970]; the latter may extend over tens to tens of thousands of square kilometres [Brandon and Wadhams, 1999]. Convergent dynamics result in the overlap of ice layers on the top of each other [e.g., Eicken and Lange, 1989]. Thin ice layers (e.g., frequently new ice) that slide on the top of each other are referred to as “rafting”, while thicker ice layers that fracture and pile on the top of themselves are referred to as “ridging” [WMO, 1970].
2.7 Implications of sea ice texture and morphologies on the distribution of biogeochemical compounds
The identification of sea ice texture not only provides information on the history of the sea ice cover, but also on the development of the different biological communities in it. It has been suggested [Garrison et al., 1983] and verified experimentally [Garrison et al., 1989] that the scavenging associated with the formation of frazil crystals leads to the incorporation of microorganisms at the beginning of the ice growth, forming thereby the surface
15 community. As sea ice further grows, it may serve as a substrate for the development of the internal-, the bottom-, and the sub-ice communities [Horner et al., 1992]. For the surface- and the internal communities, where nutrient availability is often restricted [Arrigo et al., 2010], the infiltration of seawater associated with snow ice formation, rafting or ridging, appears crucial for the nutrient supply of the surface and internal communities [Ackley and Sullivan, 1994; Kattner et al., 2004]. For the bottom communities, where nutrient supply is less restricted because of the proximity to seawater, the formation of platelet ice, which is more porous than the columnar ice and any other ice types, is known to be associated with a much larger concentrations of microorganisms [Arrigo et al., 2010].
The influence of sea ice texture on gases has been little studied. Theoretical considerations suggest that the formation of the “primary ice layer” (i.e., frazil ice) and “infiltration ice” (i.e., snow ice and superimposed ice) should induce the incorporation of gases from both seawater and the atmosphere [Tsurikov, 1979]. Observations show that turbulent conditions enhance gas incorporation in sea ice [Tison et al., 2002], and there are both evidence indicating that superimposed ice affects gas exchanges through sea ice [Tison et al., 2008] and the contrary [Nomura et al., 2010].
3 Characterization of the physical properties of sea ice
For the interpretation of biogeochemical dynamics in sea ice, it is recommended to provide data about the physical framework [Miller et al., under revision]. These data – namely temperature, salinity, brine volume fraction, brine salinity, ice texture and water stable isotopes – are often referred to as the physical properties of sea ice, although the term “physical properties” may have a wider meaning, including properties like thermal conductivity, albedo, dielectric properties and ice strength [Petrich and Eicken, 2010].
Ice temperature and bulk salinity (i.e., the salinity of a melted ice sample) are arguably the two most important physical variables for understanding the physical constraints on biogeochemical processes on non-deformed sea ice [Hunke et al., 2011]. Indeed, using temperature and salinity, and assuming thermodynamic equilibrium between ice and brine, we may calculate the brine volume fraction and the brine salinity of sea ice, which determine the permeability of the ice [Golden et al., 1998] (section 3.1), and whether mineral precipitation [Assur, 1958] (section 5.1.1) or brine convection could occur [Notz and Worster, 2009] (section 4.1.1).
16 3.1 Brine volume fraction
Based on the data compiled by Assur [1958] for the phase relations and based on the continuity equations for a multiphase sea ice mixture, Cox and Weeks [1983] derived a set of equations describing the brine volume fraction (φ) as a function of ice temperature (T) and salinity (S):
φ= (1 −𝑉𝑎𝑉) (𝜌𝑖⁄1000)𝑆
𝐹1(𝑇)−(𝜌𝑖⁄1000)𝑆 𝐹2(𝑇) (Eq. 1)
The density of pure ice is given as:
𝜌𝑖 = 917 − 0.1403 𝑇 (Eq. 2)
with ρi in kg m-3 and T in °C. F1 (T) and F2 (T) are empirical polynomial functions Fi(T) = ai
+ biT + ciT2 +diT3, based on the phase relations. The coefficients for different temperature
intervals are listed in Table 1. Va/V is generally neglected in the calculation of brine volume fraction in eq.1, because it is typically much smaller than φ in first-year ice. However, in multiyear or deteriorated ice [Timco and Frederking, 1996], where Va/V may be significant,
it is important to either measure the density of a sea ice sample or its total gas content, in order to subtract the air volume fraction (Va/V) for accurate estimate of φ.
Table 1 Petrich and Eicken [2010]’s compilation of the coefficients for F1(T) and F2(T) for different
temperature intervals, based on Cox and Weeks [1983] and Leppäranta and Manninen [1988].
With the introduction of the mushy layer theory to sea ice, describing sea ice as a mixture of solid ice and liquid brine (i.e. assuming an ideal gas-free sample) [Wettlaufer et al., 1997], bulk salinity S is given by the salinity of brine Sbr multiplied by the brine volume fraction (φ ), and the salinity of the pure ice (Sice) multiplied by the fraction of solid ice (1- φ) (eq. 3).
17
S = φ *Sbr + (1- φ) * Sice (Eq. 3)
Rearranging eq. 3 and assuming that Sice equals to 0:
φ = S / Sbr (Eq. 4)
In comparison to the previous equations from Cox and Weeks [1983] (eq. 1), this mushy-layer formulation only considers two phases (ice and brine), and thus is only valid for ideal gas-free samples. However, the main advantage is that eq. 3 is much easier to grasp (i.e, to represent physically) than the eq. 1.
φ fraction is often used as a proxy of sea ice permeability, following Golden et al. [1998], who suggested that the permeability for fluid in sea ice increases drastically when the φ fraction exceeds 5 %. Since this corresponds to an ice temperature of 5 °C for a typical ice salinity of 5, that theory is also referred to as “the law of fives”. However, as discussed later, this is probably not fully accurate (section 4.1.4).
3.2 Brine salinity
Phase equilibrium between the brine and its surrounded pure ice matrix implies that changes in ice temperature result in changes in φ and Sbr [Hunke et al., 2011]. Indeed, when cooling a sea ice sample, some of the liquid water of the brine freezes, reducing the volume of the brine inclusion (i.e., φ) and increasing Sbr. In contrast, when warming a sea ice sample, some of the freshwater ice dissolves in brine, increasing the φ and decreasing the Sbr [Hunke et al., 2011]. Notz et al. [2005] determined an empirical function for BrS as a function of the ice temperature (T) based on the data of [Assur, 1958]:
Sbr = −1.2 − 21.8T − 0.919T2 − 0.0178T3. (Eq. 5)
Vancoppenolle et al. [2013a] noted that a simpler, linear relationship between Sbr and T is sometimes used [e.g., Bitz and Lipscomb, 1999; Schwerdtfeger, 1963] (eq. 6). That relationship is based on a linear extrapolation of the dependence of the freezing point to seawater salinity (seen in Figure 4) and gives quite different results in comparison to eq. 5 (about a difference of 100 in Sbr at -15 °C). As Sbr strongly affects the calculation of φ (eq. 4) and Ra (eq. 8), it is recommended to use eq. 5 rather than eq. 6 [Vancoppenolle et al., 2013a].
18
3.3 Water stable isotopes in sea ice (δ18O, δD)
The measurement of water stable isotopes (δ18O and δD) has been shown useful for distinguishing snow ice and superimposed ice from naturally frozen sea ice (which all have a granular texture; section 2.1), and for highlighting the changes in water masses and sea ice growth rate (section 4.1.2) [Eicken, 1998].
δ18O of a sample describes the relative abundance of the 18O/16O ratio of the sample in comparison to that of the standard VSMO (Vienna Standard Mean Ocean Water), as in the following equation where 18O and 16O are two isotopes of oxygen:
𝛿 𝑂18 (‰) = ( 𝑂 18 𝑂 16 )𝑠𝑎𝑚𝑝𝑙𝑒− ( 𝑂 18 𝑂 16 )𝑠𝑡𝑎𝑛𝑑𝑎𝑟𝑑 (18𝑂 𝑂 16 )𝑠𝑡𝑎𝑛𝑑𝑎𝑟𝑑 𝑥 1000 (Eq. 7)
δD of a sample can be expressed with the same equation, but with 2H/1H instead of 18O/16O, and where 2H and 1H are two isotopes of hydrogen.
The interest in measuring δ18O and δD is based on the isotope fractionation (i.e. changes in the abundance of 18O/16O and 2H/1H respectively) that occurs during a phase transition. When a water mass evaporates, the vapour phase is enriched in light isotopes (16O and 1H), leaving the parent water mass with a higher abundance of heavy isotopes (18O and 2H). When precipitation occurs, the rain droplets or snow are enriched in heavy isotopes in comparison to the clouds, but as they are derived from the vapour phase, they are still more depleted in heavy isotopes than the parent water mass. Now, as seawater freezes, the solid phase (ice) is enriched in heavy isotopes in comparison to the parent seawater. As a result of the isotope fractionation described here above, the δ18O and δD of snow are more negative than those of seawater, which are more negative than those of sea ice (from the same location).
Because δ18O and δD have a conservative property (i.e. they do not change due to chemical or biological processes), knowing the distinct δ18O or δD of snow, ice and seawater (e.g., δ18O of -21, 2.1 and 0.3 ‰ respectively in Fram Strait [Meredith et al., 2001]), it is possible to highlight the influence of snow meltwater in superimposed ice and the influence of seawater in snow ice [Eicken, 1998; Eicken et al., 2002].
In addition, since the δ18O and δD of sea ice depend on those of the parent water, and the fractionation efficiency (i.e., the difference of δ18O and δD between sea ice and the parent
19 water) partly depends on sea ice growth rate, δ18O and δD of sea ice have been used for the study of under-ice water circulation and mixing in estuaries [Macdonald et al., 1999; Macdonald et al., 1995], and for deducing ice growth rate [Eicken, 1998; I J Smith et al., 2012; Souchez et al., 1987].
4 Initial incorporation and transport processes in sea ice
Among all the transport processes, those related to the transport of brine have been the most extensively discussed. As some concepts for describing the transport of gases directly derive from those established for the transport of brine [Tsurikov, 1979], this section begins with a state-of-art on the transport of brine, in non-deformed ice.
4.1 The transport of brine
4.1.1 Processes regulating the vertical distribution of salinity in sea ice
It is well known that the bulk salinity of sea ice is lower than that of the seawater from which it has formed, and that the bulk salinity profile changes across seasons [e.g., Malmgren, 1927; Nakawo and Sinha, 1981]. Nine processes have been suggested to explain these observations; five of which are associated with the ice growth (the initial rejection of salt at the ice-ocean interface during ice growth, the diffusion of salt, brine expulsion, gravity drainage and flushing), two others, with snow load (flooding and flushing), one, with tidal effect, and the last one, with EPS (extracellular polymeric substances) secretion. Each of these processes will be described here below, and their significance discussed in the next section (see Weeks [2010, p.156-170] for a more detailed discussion).
Initial entrapment or initial rejection
The initial rejection of salt has been described using the “Burton-Prim Slichter” model [Cox and Weeks, 1975; Cox and Weeks, 1988], also referred to as the stagnant boundary-layer diffusion model [Eicken, 1998]. This model is based on the concept of Burton et al. [1953], where the solidification of a multi-component melt (e.g., a mixture of two metal melts) leads to a fractionation, so that the mixing ratio of the two components in the solid is different from that in the initial liquid. Applied to sea ice, the BPS model suggests that the mixing ratio of salt and water in sea ice is different from that in seawater, due to the salt rejection during ice growth. That fractionation is described by the effective distribution coefficient keff (=Si/Sw), which is derived from empirical functions of ice growth velocity and the thickness of the
![Figure 4 Temperature of the maximum of density t ρmax and the freezing point t g of seawater for different temperatures and salinities [Weeks and Ackley, 1986]](https://thumb-eu.123doks.com/thumbv2/123doknet/6858625.191884/26.892.242.649.790.1030/figure-temperature-maximum-freezing-seawater-different-temperatures-salinities.webp)
![Table 1 Petrich and Eicken [2010]’s compilation of the coefficients for F 1 (T) and F 2 (T) for different temperature intervals, based on Cox and Weeks [1983] and Leppäranta and Manninen [1988].](https://thumb-eu.123doks.com/thumbv2/123doknet/6858625.191884/32.892.134.745.762.965/petrich-compilation-coefficients-different-temperature-intervals-leppäranta-manninen.webp)
![Figure 8 Vertical permeability as a function of total porosity from Petrich et al. [2006]](https://thumb-eu.123doks.com/thumbv2/123doknet/6858625.191884/44.892.200.665.268.572/figure-vertical-permeability-function-total-porosity-petrich-et.webp)