Competition Among Securities Markets: Can the Canadian Market Survive?
38
0
0
Texte intégral
(2) CIRANO Le CIRANO est un organisme sans but lucratif constitué en vertu de la Loi des compagnies du Québec. Le financement de son infrastructure et de ses activités de recherche provient des cotisations de ses organisations-membres, d’une subvention d’infrastructure du Ministère du Développement économique et régional et de la Recherche, de même que des subventions et mandats obtenus par ses équipes de recherche. CIRANO is a private non-profit organization incorporated under the Québec Companies Act. Its infrastructure and research activities are funded through fees paid by member organizations, an infrastructure grant from the Ministère du Développement économique et régional et de la Recherche, and grants and research mandates obtained by its research teams. Les organisations-partenaires / The Partner Organizations PARTENAIRE MAJEUR . Ministère du Développement économique et régional et de la Recherche [MDERR] PARTENAIRES . Alcan inc. . Axa Canada . Banque du Canada . Banque Laurentienne du Canada . Banque Nationale du Canada . Banque Royale du Canada . Bell Canada . BMO Groupe Financier . Bombardier . Bourse de Montréal . Caisse de dépôt et placement du Québec . Développement des ressources humaines Canada [DRHC] . Fédération des caisses Desjardins du Québec . GazMétro . Hydro-Québec . Industrie Canada . Ministère des Finances du Québec . Pratt & Whitney Canada Inc. . Raymond Chabot Grant Thornton . Ville de Montréal . École Polytechnique de Montréal . HEC Montréal . Université Concordia . Université de Montréal . Université du Québec à Montréal . Université Laval . Université McGill . Université de Sherbrooke ASSOCIE A : . Institut de Finance Mathématique de Montréal (IFM2) . Laboratoires universitaires Bell Canada . Réseau de calcul et de modélisation mathématique [RCM2] . Réseau de centres d’excellence MITACS (Les mathématiques des technologies de l’information et des systèmes complexes) Les cahiers de la série scientifique (CS) visent à rendre accessibles des résultats de recherche effectuée au CIRANO afin de susciter échanges et commentaires. Ces cahiers sont écrits dans le style des publications scientifiques. Les idées et les opinions émises sont sous l’unique responsabilité des auteurs et ne représentent pas nécessairement les positions du CIRANO ou de ses partenaires. This paper presents research carried out at CIRANO and aims at encouraging discussion and comment. The observations and viewpoints expressed are the sole responsibility of the authors. They do not necessarily represent positions of CIRANO or its partners.. ISSN 1198-8177.
(3) Competition Among Securities Markets: Can the Canadian Market Survive? Cécile Carpentier*, Jean-François L’Her†, Jean-Marc Suret ‡ Résumé / Abstract Selon Coffee (2002), le nombre de Bourses dans le monde devrait diminuer radicalement, sous l’effet de la mondialisation et de la technologie. On peut alors s’interroger sur la survie des Bourses de petite taille. Peu d’informations sont actuellement disponibles quant à la position compétitive du marché boursier canadien et son évolution au cours de la dernière décennie. Deux visions de son développement sont avancées. Certains pensent que ce marché est florissant. Ils ne constatent aucune trace d’un abandon par les entreprises canadiennes. À l’opposé, d’autres décrivent le TSX comme une Bourse en perte de vitesse, qui serait en train de disparaître. En fait, les entreprises canadiennes constituent le plus important groupe de titres étrangers listés aux ÉtatsUnis, même si leur nombre semble diminuer depuis 1998. Notre étude analyse l’évolution du marché boursier canadien et sa position compétitive actuelle. Nous tentons de prévoir l’effet qu’aura la concurrence sur ce marché. Notre conclusion générale est que son plus grand défi est certainement sa survie. Mots clés : marché boursier, concurrence, titres interlistés According to Coffee (2002), the number of securities exchanges in the world is likely to eventually shrink radically, under the effects of globalization and technology, thus leading to the question of the survival of relatively small exchanges. However, little information exists regarding the current competitive position of the Canadian market, and there exists but scant evidence to document its evolution over the last decade. Two visions of the development of Canadian securities markets are proposed. Some view this market as thriving, observing no evidence that domestic capital markets have been abandoned by Canadian firms. In contrast, other authors depict the TSX as the “Incredible Vanishing Exchange,” asserting that it symbolizes the hollowing out of corporate Canada. In fact, Canadian firms represent the largest group of foreign stocks listed in the U.S. market, even though their number has apparently been decreasing since 1998. Our study presents evidence relative to the evolution and current competitiveness of the Canadian securities market. We also attempt to predict the effect competition will likely have on this market. Our general conclusion is that survival will probably constitute a real challenge for the Canadian securities market. Keywords: securities exchange, competition, cross-listed securities *. Associate Professor, Laval University and CIRANO Researcher, email: [email protected]. † Vice President, Investment Policy Research, La Caisse de dépôt et placement du Québec, email: [email protected]. ‡ Corresponding author, Professor, Laval University and CIRANO Fellow, Faculty of Administrative Sciences, School of Accountancy, 5226, Palasis-Prince, Québec (Québec), G1K 7P4, Canada, Phone 1 418 656-7134, Fax 1 418 656-7746, email: [email protected]..
(4) According to Coffee (2002), the number of securities exchanges in the world is likely to eventually shrink radically, under the effects of globalization and technology. For Steil (2001), technology is the main force that drives international exchange consolidation. Di Noia (2001) argues that in theory, competition among securities exchanges will ultimately result in a single market, except when exchanges negotiate alliances that convert them into cooperative networks. Steil (2002) sees the integration of the U.S. and the E.U. securities markets through a mutual agreement. He argues that this initiative will reduce trading costs, increase investment returns, lower the cost of capital, and increase economic growth on both sides of the Atlantic. In such a context, the question can be asked if, and how, small securities markets can survive. It can be asserted that it is not necessary for all countries to have full-fledged securities markets for economic development, when capital markets are open and accessible internationally. Di Noia demonstrates that the consolidation of the European exchanges into one may produce a welfareefficient outcome. However, if increased competition among stock markets should result in the disappearance of a market such as the Canadian market, then there will be major consequences in terms of public policy and economic activity. Coffee (2002) contends that consolidation will occur, but that there might be at least four possible outcomes. Firstly, exchanges could merge, as some have already done in Europe. Secondly, the more successful market centers could drain liquidity from local exchanges, leaving the latter hollowed out. Another scenario is that a market center might expand globally by implementing workstations in foreign markets, as the NASDAQ has attempted to do. Finally, international brokerage firms could route domestic orders to distant foreign exchanges in order to minimize transactions costs. Three reasons motivate the analysis of the evolution of Canadian securities markets. Firstly, the Canadian market is, by far, the market that is most closely linked with the U.S. market. The interlisting of Canadian corporations has been facilitated by the implementation of the Multijurisdictional Disclosure System, which allows Canadian corporations to list their stocks in the U.S. under less rigorous criteria than those that apply to other non-American corporations. This system comes close to the recommendation that Steil (2002) proposes between the U.S. and the E.U. Secondly, according to Coffee (2002, p.16), by far, the principal mechanism that produces competition among market centers has been the issuer decision to cross-list its securities on a foreign exchange. Canadian firms are the single largest group of. 1.
(5) foreign firms listed on U.S. securities exchanges, with more than 240 (180) of them cross-listed in 1998 (2003). The observed decrease is on line with a worldwide decrease in the number of cross-listed stocks (Karolyi, 2004). Finally, opinions about the evolution of the Canadian securities market are totally opposed. Several authors hold a relatively optimistic view. Boisvert and Gaa (2002) mention that in Canada, the number of shares on the Toronto Stock Exchange has doubled in the last five years, while the dollar value of trading has increased three-fold. Jenkinson and Ljungqvist (2001) place Canada among countries that saw the highest increases in stock exchange listings from 1981 to 1998, far ahead of the United States, Japan, and the United Kingdom. Freedman and Engert (2003) of the Bank of Canada, conclude that data do not provide much support for the view that domestic capital markets have been abandoned by Canadian firms or hollowed out in recent years. By contrast, Reguly (1999) argues that the TSE is a clear example of the hollowing out of corporate Canada. He calls the TSE “the Incredible Vanishing Exchange,” and notes that the liquidity of the TSE is evaporating. Reguly maintains that the TSE is powerless to stop companies from marching across the border. In a second paper (2002), he questions whether Toronto is becoming the next Montreal, in terms of its stock exchange. Similar concerns about liquidity and loss of firms are also expressed by Oliver (2002), CEO of the Investment Dealers Association of Canada. He notes that over the last two years, 120 Canadian companies have been deleted from the TSE300. Clearly, the discrepancy of opinions relative to the evolution of the Canadian stock markets merits an in-depth analysis. The goal of this study is to present evidence relative to this evolution and to discuss the competitiveness of the Canadian securities market. We also attempt to predict a probable outcome of competition for this country. We start by discussing the known factors that help, or hinder, the development of modern markets, and attempt to determine the significance of these factors in Canada. This section includes three propositions relative to the evolution of the Canadian securities markets. Secondly, we characterize the evolution of the Canadian securities market since 1990, relatively to other developed markets. This task is made difficult as available data is generally incomplete or contradictory, and as restructuring of the exchanges distorts the analysis. In the third section, we analyze the competitive position of the Canadian market based on the evolution of the trading of interlisted securities. Section four presents our concluding remarks.. 2.
(6) 1 Competitive advantages of securities markets In a context of intense competition among stock markets and trade globalization, the development of stock markets is strongly linked to their capacity to attract foreign stocks and to limit foreign trades of domestic stocks. This challenge is particularly formidable in Canada, due to the closeness and strength of the U.S. markets. Moreover, Eun and Sabherwal (2003, p. 1) observe that attracting non-US listing is now a top priority of the U.S. stock exchanges. 1.1. Advantages and costs of U.S. listing for Canadian firms. The competition between exchanges relies mainly on the decision of firms to list abroad, while the success of the cross-listing depends on the willingness of brokers to trade on a market. Two main arguments are invoked to justify cross-listing. The first is market segmentation, in the context of which cross-listing was a means of integrating segmented markets and thus enabling the issuer to access trapper pools of liquidity (Coffee, 2002). The growing integration of markets has weakened this hypothesis. The second explanation is the bonding hypothesis. This hypothesis suggests that firms from countries with poor protections of minority shareholders signal their desire to respect the rights of shareholders by listing in a jurisdiction with higher scrutiny, tougher regulation, and better enforcement (King and Segal, 2004). As Coffee writes (2002): issuers migrate to U.S. exchanges in particular because by voluntarily subjecting themselves to the U.S.'s higher disclosure standards and greater threat of enforcement (...), they partially compensate for weak protection of minority investors under their own jurisdiction's law and also credibly signal their intention to make fuller disclosure, thereby achieving a higher market valuation and a lower cost of capital. This effect is described by researchers as piggybacking (Black, 2001, Licht, 2001). Businesses seek to increase their market value by complying with more strict disclosure and governance standards than those prevailing in their countries of origin (Pagano et al., 2002). Moreover, listing in the U.S. can increase coverage by financial analysts. Lang et al. (2002) show that securities listed on a market other than their markets of origin attract increased interest from financial analysts, enjoy an improved quality of their forecasts and achieve higher prices. Cross-listing is also of interest to traders. Transaction costs can be lower, and liquidity better, on foreign and larger markets. According to Domowitz et al. (2001), the execution costs are generally smaller and liquidity is generally higher in the U.S. than in other countries 3.
(7) The interlisting of Canadian corporations has been facilitated by the implementation of the Multijurisdictional Disclosure System (MJDS), which allows Canadian corporations to list their stocks in the U.S., under less rigorous criteria than those that apply to other non-American corporations1. According to Steil (2002), the main obstacle to the full operation of the mutual recognition system is the fact that Canadian companies still face potential civil and criminal liability resulting from U.S. civil court action2, particularly class-action suits, related to inadequate or inaccurate disclosure. Steil argues that despite the stated aim of the MJDS to facilitate reciprocal access for U.S. and Canadian companies to each other’s national capital markets, the MJDS is actually a unilateral concession from the Security exchange commission to ease new issues of Canadian companies. According to Karolyi (2004), much evidence has been assembled challenging the conventional wisdom that firms benefit from cross-listing. He observes that the number of cross-listed stocks retreated worldwide from 4700 (1997) to 2300 (2002), and proposes several research avenues. We contend that Canada is a special case in the world of cross-listing, because of the economic and financial integration of the Canadian and U.S. markets, regulatory adjustments such as the MJDS, and the high proportion of highly capitalized Canadian stocks traded in the U.S. Moreover, numerous studies have been conducted on the effects of cross-listing in Canada, and they generally conclude that the effects are positive. 1.2 Empirical evidence Karolyi (1998) posits that the impacts of listing abroad are generally positive. They include: 1) favorable share price reactions to cross-border listings in the first month after listing even if this effect is only observable for foreign stocks listing in the U.S., while the price effect of U.S. companies listing in Toronto appears to be negligible (p. 18); 2) post-listing trading volume increase on average, and similar increase in home-market trading volume; 3) overall improvement in the liquidity of trading in shares; and 4) significant reduction of domestic market 1. The multi-jurisdictional disclosure system is a joint initiative of the CSA and the SEC. Canadian issuers, with market capitalization of at least $75 million, may use their home disclosure documents rather than carry out the more detailed U.S. filing, except in the case of an initial public offering. See National Instrument 71-101: http://www.cvmq.com/upload/fichier_pdf/norme/71-101ang.pdf 2 Under Rule 10b-5 of the 1934 Exchange Act. 4.
(8) risk, associated with only a slight increase in global market risk and foreign exchange risk, resulting in a net reduction in the cost of equity. This reduction, together with increased growth opportunities and decreased agency costs, can explain why foreign companies listed in the U.S. are worth more than non interlisted firms (Doidge et al., 2003). King and Segal (2004) compare cross-listed and non-cross-listed Canadian firms, over twelve years. They conclude that cross-listing has a positive impact on valuation over and above the positive impacts associated with firm size, profitability, cost of equity, and past sales growth. The cross-listed firms that are subject to stricter SEC supervision and greater scrutiny by U.S. investors are valued more highly than Canadian firms that are listed exclusively on the TSX. This finding is consistent with the predictions of the bonding hypothesis. Cross-listed firms that are actively traded in the U.S. market experience a significant increase in valuation over the long term. Cross-listed Canadian firms that fail to develop active share turnover in the U.S. and remain traded predominantly in Canada are valued no differently from non-cross-listed Canadian firms. Greater share turnover on the U.S. stock markets may be viewed as a proxy for reputational bonding. These results are confirmed by Foerster and Huen (2003), who observe that the governance score of firms interlisted on the New York Stock Exchange is higher than that of firms that list only in Canada or that interlist on NASDAQ. Moreover, over a five-year period, a value-weighted portfolio of 54 stocks rated in the top governance score quintile outperforms other portfolios by 9% per year on average. The reaction to information related to a firm’s governance score is thus significant. Foerster and Karolyi (1998) analyze the evolution of spreads following the decision of Canadian corporations to list their stocks on the U.S. market. They document a significant drop following the listing of stocks on an American market3, especially relative to stocks with the highest degree of transfer of trading to the U.S. This decrease is measured on the Canadian market, and shows that the Canadian market adjusts to a more competitive environment as soon as stocks are widely traded on a competitive market. Trading costs may thus be lower on the American market than in. 3. They measured both the posted bid-ask spread and the effective spread, and took into account the different factors influencing the spreads, such as the price level, size and the volume of trading. The effective spread is the difference (in absolute value) between the price of the trade and the middle of the range.. 5.
(9) the Canadian market, and interlisting may reduce these costs on the Canadian market as well. There is little evidence to support this theory, however, as cost measurement is a difficult exercise. Costs depend on volume and liquidity, size of trade and stock price (Cleary et al., 2002). Doukas and Swidler (2000) observe an abnormally positive return for Canadian companies interlisted in the U.S., which results in a reduction in the cost of capital. Foerster and Karolyi (1993 and 1998) assert that the transfer of trading to the NYSE leads to increased volume, a lower cost of capital and decreased trading costs. Mittoo (1997) shows that when a TSE security is cross-listed, both trading volume and stock turnover almost double from their pre-listing levels. Mittoo (2002) confirms the attractiveness of the U.S. stock exchanges for Canadian firms for 108 new listings of Canadian stocks over the 1991-1998 period. The abnormal positive return associated with a U.S. listing is lower than in previous studies, and is associated with a gain in liquidity. The trading volume increases after the U.S. listing, and is mainly captured by the U.S. stock exchange. However, the effects of a U.S. listing on liquidity vary depending on the firm. Mittoo observes a significant decrease in trading costs only in the case of volume–increasing and non-resources stocks. The effect of a U.S. listing on transaction costs is lower than the strong drop reported by Foerster and Karolyi (1998). The significantly negative long-term performance of Canadian stocks newly listed in the U.S. can be partly explained by the fact that listings in the U.S. follow strong market performances. Overall, longterm performance aside, the U.S. listing of Canadian stocks seems to imply positive short-term price effects, an increase in liquidity, and a decrease in transaction costs, albeit on a lower scale than previous studies indicated. While Canada and the U.S. may indeed have largely integrated markets, the equity trading cost differs greatly between the two countries. According to Domowitz et al. (2001, Table 1), total one-way trading costs are 52.4 basis points in Canada, and 38.1 in the U.S. The estimations cover the 1990-98 period. The difference is essentially due to the explicit costs (25.3 in Canada versus 8.3 in the U.S.). According to this estimation, if a portfolio turns over every 4 months, annual excess costs of 85.8 basis points4 are incurred if the trades are executed in Canada versus in the. 4. 3 x 2 x (52.4 – 38.1). 6.
(10) U.S.5. This wide difference in costs is likely to impair the competitive position of the Canadian market. 1.3 Propositions In light of the evidence described above, we test the first proposition below relative to the global evolution of the market. The Canadian securities market lacks attraction for foreign stocks, and the strong competition between stock markets, combined with the recognition by Canadian managers of the advantages of foreign listings, should lead to lower growth of the Canadian securities market relative to other developed markets. The advantages of foreign listing for Canadian issuers should imply a growth in the number and proportion of interlisted stocks6. Mittoo (2002) confirms that the gain in liquidity for Canadian firms listing in the U.S. declines over time. But the U.S. stock exchanges should continue to attract Canadian stocks and trades on these cross-listed securities. Our proposition 2.a. is the following: the number and proportion of largely capitalized interlisted Canadian stocks increased significantly during the 1990s. However, the proportion of trade of interlisted Canadian securities carried out in Canada should also decrease over time. Theoretical models explaining the growth of trading volume in interlisted securities show the emergence of a dominant market in accordance with the “winner take most” rule (Chowdhry and Nanda, 1991). These models distinguish liquidity traders from informed traders. Liquidity traders trade without 5. Trading costs, however, constitute only one aspect of the problem. Order fragmentation and price centralization are also very important factors. A fragmented system has little liquidity and requires setting up a centralized data system. The problem of fragmentation is crucial in a small market, where 80% of trading volume originates from institutional investors. Fragmentation results in Canada from the splitting of trading in the most active stocks into two relatively equal parts: in Canada and the U.S. It also results from internal trades, which happen when a broker combines the orders of his own clients. Upstairs trading is allowed by TSX rules, but is greatly restricted by the NYSE, and covers most trading by institutional investors (54% in 1997, according to Smith et al., 2000). Moreover, a broker does not need to reveal such trades immediately, which may have a significant information effect on price. Upstairs trading is used both by brokers and by specialized systems such as Instinet. Canadian brokers, however, are required to report internal trading volume, which is included in total trading volume. 6 The advantages obtained by moving the transactions toward the U.S. market were not eliminated but only reduced by the measures implemented by the TSE in response to increased competition from U.S. stock exchanges. According to Mittoo (2002, p. 9), on April 1996, the TSE switched to decimal pricing for stocks trading at $5 per share or more, and implemented a Minimum Quotation Increment Reduction (MQIR) for two stock categories, but the NYSE and NASDAQ reacted by reducing their MQIR.. 7.
(11) any specific base of information and are attracted to the market where trading costs are lower and create liquidity. Informed traders base their trading on analysis and information. This group primarily comprises institutional investors that maximize their returns by trading in the most liquid markets. Accordingly, even if the total trading volume increases when a stock is listed on a secondary market7, the trading volume in the country of origin may increase or, on the contrary, decrease sharply, depending on whether or not the country has a dominant market position. The models predict that the transfer of trading will continue to gravitate to the country offering the most favorable trading conditions, but, according to Karolyi (2004), why and how the order flow gravitates to one market or the other, and how this changes over time, is not clear. Baruch, Karolyi and Lemmon (2003) hypothesize that trading volume is likely to migrate to the exchange in which the cross-listed asset returns are most closely correlated with returns of other assets traded on that market. They find strong empirical support for the prediction. Due to a lack of competitive advantages, the Canadian market is presumably not a dominant market for foreign stocks, and has been progressively relinquishing its role as the principal market for high-volume Canadian stocks. Our proposition 2.b. reads as follows: the proportion of foreign trade of interlisted Canadian stocks increases over time. Furthermore, it is apparent that the arguments in favor of listing abroad are valid from the point of view of the firm in a small market. The empirical evidence generally confirms these advantages for a foreign issuer listing in the U.S. In terms of liquidity, transaction costs, and analyst monitoring, the advantages for a foreign issuer of trading in Canada are hard to discern. The liquidity, visibility, and size of the investor pools are considerably lower in Canada than in the U.S. In Canada, trades are segmented between upstairs and downstairs markets, and transaction costs are higher than, or at best, equal to those in the U.S. The certification effect cannot be invoked because SEC requirements are generally perceived as higher than those of Canada, especially since the adoption of the Sarbanes-Oxley Act in 2002. Given the lack of attractiveness of the Canadian market, we formulate our third proposition as follows: The number and trading volume of foreign issuers in Canada decrease over time. 7. Foerster and Karolyi (1993) observed a 62% increase in the total trading value of Canadian securities in the three months following their listing on an American exchange. This increase is especially noticeable on the American market, but the value traded on the Canadian market also increased by 26%.. 8.
(12) 2 Canadian market development 2.1. Measurement. The number of listed corporations or securities, total capitalization and trade volume are classic indicators of the level of development of a stock market. Each of these variables, however, captures only a single aspect of a complex reality: the number of securities may mask considerable differences in size, and capitalization provides little information as to why the securities are rarely traded. Moreover, the capacity of a market to attract corporations already listed elsewhere and to retain the trading of domestic securities has become crucial owing to market globalization. Accordingly, we have defined three groups of indicators: 1) capitalization levels, trading volume and number of listed corporations, 2) the changes in these levels during the last decade, and 3) the changes in and size of trades in Canada of securities of foreign corporations and foreign trades of Canadian interlisted securities. Each of the measures of market size must be subject to analysis and adjustments. The number of listed corporations must be considered in relation to corporations that are listed but are non-operating. The distribution of the size of companies must be examined, since in Canada, the Capital Pool Company programs (a Canadian version of the U.S. Blind Pools) allow diminutive initial offerings compared with international standards. The variation of total capitalization may be related to the growth of issued capital through initial or secondary offerings (minus repurchases), and to the effect of variations of market indices. Capitalization amounts therefore combine two effects, which it is very important to distinguish. Most data available for Canada issues from the stock exchanges, and is characterized by several difficulties: 1) Inactive companies represent more than 20% of the corporations listed in Canada; 2) Foreign corporations, characterized by very large market capitalizations compared with the size of the Canadian market, were taken into account in the estimation of the total capitalization of several exchanges. Several such corporations disappeared from the lists, and thus from the calculation of total capitalization, without being specifically mentioned, during the 1990s8; 3). 8. This is the case for IBM, which disappeared as a listed security in Canada in 1995. In its final prospectus (November 5, 2002), The TSX Group Inc. reports a total capitalization of $1,300 billion in 2001, but $264 billion were associated with foreign securities, which are almost never traded on this market;. 9.
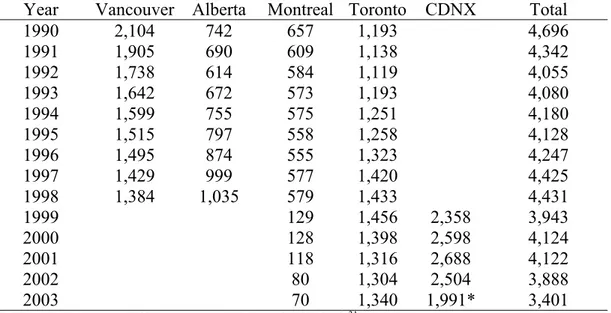
(13) Several Canadian securities are traded almost exclusively in the United States; 4) We further observe a concentration and specialization trend of Canadian stock exchanges during the 90s, as described in Appendix 1. It is therefore difficult to clearly discern the evolution of the Canadian securities market without the detailed analysis we describe in the appendix. 2.2. Number and characteristics of public corporations. Approximately 21% of listed Canadian corporations in 2002 were inactive. Most listed corporations are very small: 67% of operating corporations have shareholders equity of less than $10 million. In terms of shareholders equity alone, only 415 companies could be listed on the NYSE, and approximately 600 on the NASDAQ9. During the studied period, the number of listed corporations decreased by 1,295 (from 4,696 to 3,401) overall. Between 1991 and 2000, there were 1,891 initial public offerings (IPO), other than mutual funds, trusts or limited partnerships, of which 1,217 issues raised amounts less than CDN$1 million (approximately U.S.$.67 million), mainly within Capital Pool Companies (868 issues). The net decrease in the number of businesses therefore translates into a significant “death rate,” which may result from mergers, privatizations, or delistings10. In Canada, around 189 IPOs are undertaken annually, as opposed to 47 in France, 80 in the United Kingdom and 43 in Germany, according to Ljungqvist and Wilhelm (2002, Table 2)11. On average, initial offerings raised US$131 million in Germany, US$74 million in France, US$93 million in the U.K. and US$63.5 in the U.S. In Canada, the average amount initially raised by an IPO is lower than US$1.66 million, excluding privatizations and demutualizations. Carpentier et al. (2003) show that only 10% of Canadian IPOs during the 1991-2000 period raised sums that exceeded the US$20 million threshold, and are thus comparable to issues of SEC-covered securities under the National Securities Market. 9. By keeping capitalization equivalent to shareholder equity, the threshold to maintain listing on the NASDAQ is US$50 million or approximately CDN$75 million, and on the NYSE is US$100 million or CDN$155 million. Securities, however, must comply with other criteria respecting shareholding and revenues. 10 For December 1998 only, there were 25 delistings on the TSE (TSE Review, December 1998), and four in Montreal. 11 4,541 IPOs were counted in the United States, representing 412 per year, for an average amount of raised capital of approximately US$93 million.. 10.
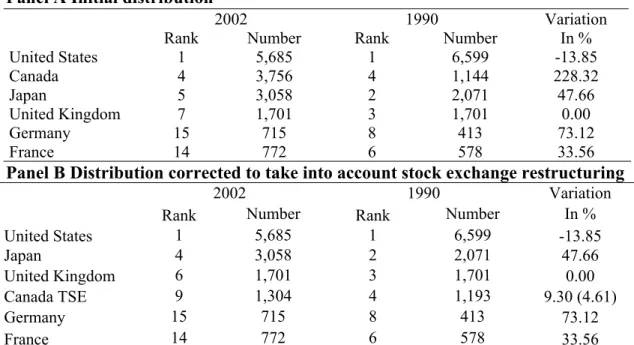
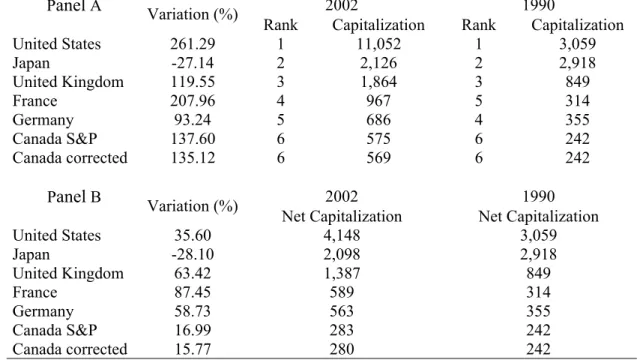
(14) Improvement Act (1996)12. The Canadian market is characterized by the presence of a large number of new businesses, generally small-cap, along with a significant death rate among listed corporations. This makes it atypical compared with the other markets of developed countries. A direct consequence of the large number of small and micro-cap companies on the Canadian securities market is the high level of concentration of this market. At the end of 2003, the 60 largest Canadian issuers represented 68% of this capitalization, and the proportion reached 79% for the 100 largest Canadian stocks. In keeping with these observations, our analysis of the evolution of the Canadian market will be largely focused on the 60 largest Canadian stocks. The United States represents the largest exchange in the world, with over 5,600 companies in 2002 (Table 1). Canada ranks fourth, if we use S&P data, which reveals a very significant change in the number of listed corporations from 1990 to 2002, as compared to Germany or France. It should be noted that the strong Canadian growth is due to a different basis of measurement; the S&P takes into account only companies listed on the TSE in 1990, but includes those of the TSX venture exchange in 2002. If data provided by the TSE is used for the entire period (Panel B of Table 1), the variation in the number of listed companies is only 4.61%, when corrected for the 56 corporations transferred from Montreal to Toronto. 2.3 Capitalization growth The growth of the Canadian market should be compared with that of the major developed markets, which reported strong increases in the last decade (Table 2). Gross Canadian market capitalization more than doubled in the last decade, from US$242 billion at the end of 1990 to US$569 billion in 2002. Canada ranks behind France and Germany in 2002. Market capitalization for Germany doubled in twelve years13, whereas that of Japan decreased. If these variations are corrected to neutralize variations in the market index (Panel B of Table 2)14, the net. 12. These characteristics of Canadian IPOs explain the observation of Freedman and Engert (2003) that the shares of foreign placements of new equity issues seems relatively modest, averaging 12 per cent in the last five years. The reason for this is very simple: most Canadian IPOs simply do not satisfy the criteria of the US IPO market. 13 In France and Germany, significant privatizations between 1995 and 1997 explain a large part of the increase in capitalization. 14 S&P reports that in 1990, Canadian market capitalization consisted in the capitalization of listed companies on the TSE only, expressed in U.S. dollars. In 2002, it was the capitalization of Canadian. 11.
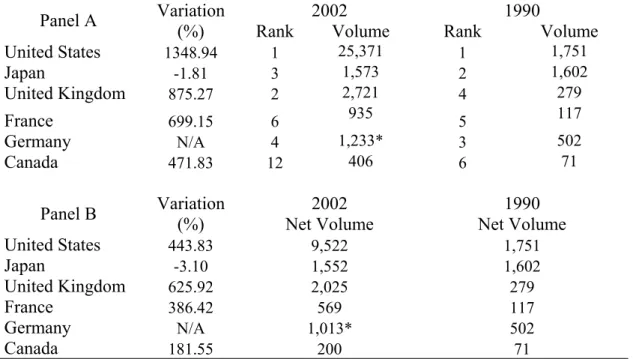
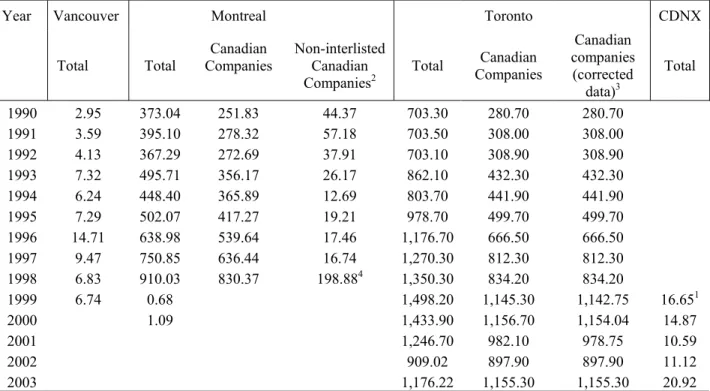
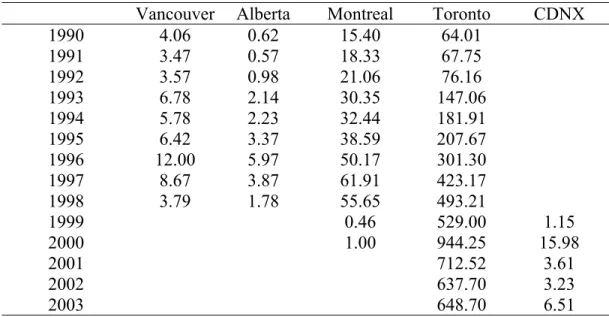
(15) Canadian capitalization increase remains much lower than that of other countries, with the exception of Japan. The net Canadian capital created is 16% in twelve years, as opposed to 87% in France, 63% in the United Kingdom and Germany, and 36% in the United States. The net Canadian capitalization growth is therefore slow (1.22% annually). Statements referring to dynamic growth in Canadian exchanges should thus be seriously reconsidered. 2.4 Trade volume growth Analyzing data from Levesque, Beaubien and Geoffrion Inc., Shearmur (2001, p. 223) shows extremely rapid growth in the value of trades on Canadian stock exchanges between 1976 and 1998. As growth in trading value is a worldwide phenomenon, and a comparison with other developed markets is presented in Table 3, for 1990 and 200215. The relative position of the Canadian market is deteriorating: it was in 12th place in 2002, with US$406 billion, whereas it had ranked in 6th twelve years earlier. The Canadian stock market was surpassed by those of Spain, Korea, Switzerland, Taiwan, Italy and the Netherlands. In net terms, volume growth of Canadian trades was much less than that of the United States, and less than that of France and the United Kingdom. Although the value of Canadian trades was 4.05% of the American volume in 1990, it represented 1.60% in 2000, and this decrease can be only partially explained by the differences between the market index returns in the two countries, which stand at about 2% during this period. Canada is thus progressively losing strength relative to other markets, and in particular to the American market, the volume of which increased fourteen-fold16. Stock market growth is fuelled by internal factors, but may also be triggered by the issue of securities by corporations or, on the contrary, weakened by the transfer to other markets of trading in local securities. The results of our thorough analysis of the changes in the indicators of the evolution of the Canadian market can be summarized as follows: the growth of the Canadian market is slow, companies listed on the TSE and on the TSX venture exchange in U.S. dollars. Consequently, as data was available only on the international level, we are only using TSE capitalization for Canada in 1990 and 2002, and S&P data for other countries. 15 For 1990, S&P reports the volume on the Toronto, Montreal and Vancouver Exchanges, and for 2002, the volume on the Toronto and CDNX Exchanges, and it does not appear useful to correct this data. The United States holds first place with a trading value of around $25,000 billion in 2002, with the United Kingdom lagging far behind ($2,700 billion), as does Japan, with 1,500 $ billion. France and Germany follow with about $1,000 billion each.. 12.
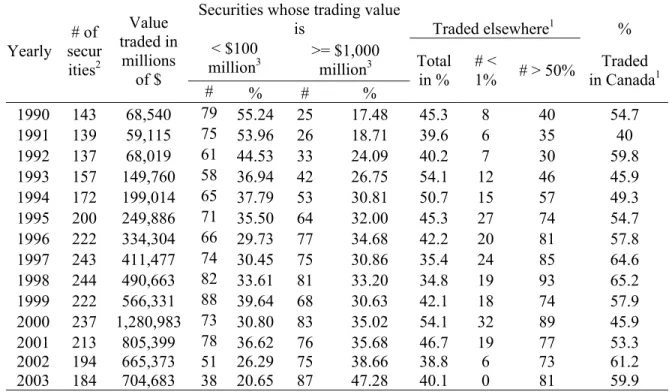
(16) both in terms of market capitalization and trade volume, and Canada is progressively losing strength relative to other markets, the American market in particular. These observations are consistent with our first proposition. 3. Cross-listing and Canadian securities market We successively examine the attraction of the American market for Canadian securities, the foreign issues on the Canadian market and the characteristics of Canadian stocks which are no longer cross-listed in 2003. 3.1 The attraction of the American market for Canadian securities Table 4 shows significant growth in the number of interlisted Canadian securities over the last decade. The number rose from 143 in 1990 to 237 in 2000, representing a 65% increase. In 1990, the number of interlisted Canadian stocks normalized by the number of listed Canadian is 11.98% (143/1193). In 2003, this proportion is 14.11% (184/1304). The worldwide trading value of these stocks also grew considerably: from $69 billion to $1,280 billion ten years later. In 2001, the trading value decreased to $805 billion, mainly because of the loss of value of Nortel Networks and BCE Inc. However, in 2001, 83 Canadian stocks had a trading volume of over $1 billion, and 75 were interlisted. Heavily traded Canadian stocks are thus almost all interlisted. We estimate the number and proportion of large interlisted Canadian stocks, in 1990 and 200317. We limit the analysis to the 60 and 100 largest Canadian issuers. In 1990, 18 of the 60 (30%) largely capitalized Canadian stocks were interlisted. The proportion is 70% in 2003. A Chi-Square test allows us to reject the hypothesis that these two proportions are equal. Similar results were obtained with the 100 largest Canadian stocks. The proportion of interlisted stocks increased from 32% to 65%, and these proportions differ at the 0.001 level of significance. In analyzing the characteristics of the 18 non-interlisted largely capitalized stocks within the set of 60, two categories emerged. The first is composed of companies where the float is limited despite large capitalization, because much of the control and the shares are held by 16. It is, however, possible that the American volume is overestimated, in particular by the double-counting of NASDAQ trades (Dyl and Anderson, 2002). 17 We use the Stock Guide database of January, 2004 and the TSX Review of December 2003.. 13.
(17) individuals or families; four such stocks are related to the Power Corporation of Canada (GreatWest Lifeco Inc., Power Financial Corporation, Power Corporation of Canada and Investors Group Inc.), and two are related to the George Weston Group Limited (George Weston Group Limited and Loblaws), where 62% of the control is in the hands of G. Weston. The second category contains subsidiaries of foreign groups (Shell Canada Limited, Northstar Energy Corp., Bowater Canada Inc. and Smithfield Canada Limited, for example). These observations confirm the hollowing out hypothesis and contradict the opinion of Freedman and Engert (2003, FE). FE show relatively modest growth of interlisted shares, approximately 10% to 15%, between 1980 and 2000. We calculate our proportion relative to the large issuers that can satisfy the U.S. market requirements and represent a very large part of the Canadian capitalization and trading volume. We maintain that our proportions are more informative. Indeed, more than 90% of the largely traded Canadian stocks are interlisted. The volume is in excess of 1 billion, and accounts for a very large part of trading volume and capitalization. Except for foreign subsidiaries, family-controlled firms and rare exceptions, all the large Canadian issuers opted for interlisting during the 1990s. Proposition 2.a is thus statistically verified. Table 4 allows an analysis of the evolution of trading volumes of interlisted Canadian stocks, according to the markets where the trades take place. The percentage of trading volume which took place outside Canada increased sharply from 1998 to 2000, a year in which only 46% of trades of interlisted securities were made in Canada. The TSX then appeared to regain ground, and in 2003, the Canadian proportion was 59.9%. This variation seems largely associated with the crash of technology stocks, which were subsequently abandoned by American investors. Collectively, three stocks (Nortel, BCE and Corel) represent a decrease in trading volume in the United States of about $350 billion18. The proportion of interlisted Canadian stocks traded mainly on foreign exchanges rose from 28% in 1990 (40/143) to 44.02% in 2003 (81/184). In 1990, interlisted Canadian stocks were mainly securities for which trading value was lower than $100. 18. Nortel represented $508.3 billion of trades in 2000, of which 65.7% took place in the United States. Trades rose to $41.9 billion in 2002, of which 51.2% were in the United States. BCE dropped from $96.8 billion and 25.5% of U.S. trades to $25.5 billion and 12.6%. Corel went from $9.1 billion and 88.5% of U.S. trades to $194 million and 58.1%.. 14.
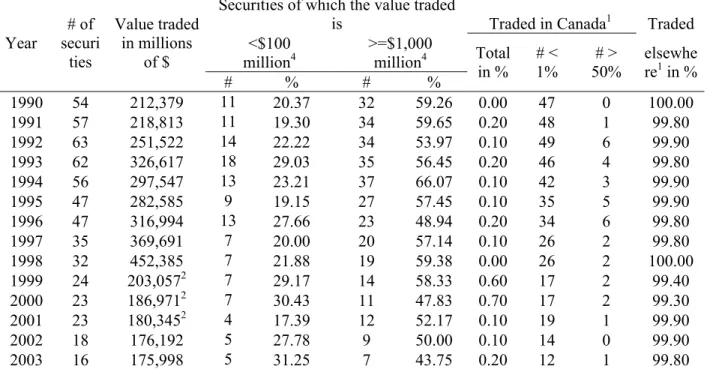
(18) million (55%). In 2003, the proportion of interlisted Canadian stocks for which trading value was lower than $100 million decreased sharply to 21%; in 2003, the interlisted Canadian stocks were mainly securities with trading values higher than $1,000 million (47%). A complementary test is required to assess the significance of this trend. In Table 5, we report an analysis of the changes in the distribution of trading between the U.S. and Canada for the 184 Canadian stocks interlisted at the end of 2003. The analysis is restricted to the 1993-2003 period. When an issuer interlists during the period, it is considered as fully transacted in Canada before the move. In 1993, 86.41% of interlisted stocks were largely traded in Canada, with more than 80% of trade realized in this country. The proportion fell to 32.07% in 2003. Conversely, the proportion of interlisted stocks largely traded in the U.S. (40% and more) jumped from 7.61% to 51.63% during the same period. We can reject the hypothesis that the distribution of interlisted stocks following the split of trades between the two markets was the same in 1993 and 2003. On the contrary, the increase in the U.S. portion of trade is strong and statistically significant. These results are in line with proposition 2.b.: the proportion of foreign trade of Canadian interlisted stocks increases significantly with time. Both the increase in the number and proportion of interlisted stocks and the decrease in the Canadian portion of trading of these securities are consistent with the hollowing out hypothesis. From a Canadian point of view, the decrease of Canadian issuers listed only in the U.S. can be seen as a positive point. Freedman and Engert (2003) illustrate that the number of Canadian issuers solely listed in the U.S. declined from 65 in 1995 to approximately 28 in 2002. According to the TSX, the number of Canadian firms listed only in the U.S. decreased from 49 in 1997 to 35 in 2001. This decrease is due primarily to delistings and mergers (TSX Group Inc. final prospectus, 2002, p. 18)19, and cannot be associated with a “return at home” of these issuers. 3.2 Foreign issuers on the Canadian stock market Table 6 contains figures of interlisted foreign securities mainly issued by American corporations. The value of worldwide trading of interlisted foreign securities increased from 1990 to 1998, reflecting the existence of several large-cap securities such as General Motors, Sony and Philips Petroleum. The trading value decreased considerably in 1999, mainly because of the withdrawal. 15.
(19) of Mobil Corp and Citicorp from the Canadian market. The number of interlisted foreign securities decreased sharply from 54 in 1990 to 16 in 2003. In 1990, the number of foreign interlisted stocks normalized by the number of listed Canadian stocks is 4.53% (54/1193). In 2003, this proportion is 1.23% (16/1304). However, the Canadian volume of trades executed for foreign securities listed in Canada is insignificant. In 2003, 16 foreign corporations were listed both on a foreign and on a Canadian stock exchange. Yet only one security is traded at a rate of over 50% in Canada (Aberdeen AsiaPacific). For 12 of the 16 stocks, Canadian volume represents less than 1% of total trading volume. The presence of foreign corporations on the Canadian market is symbolic—more than 99.8% of the value of trades in these securities is generated outside the Canadian market. By comparison, interlisted foreign securities represent around 10% of the trading volume on the NYSE (Boisvert and Gaa, 2002, p. 23) and more than 900 foreign securities are listed on the NYSE and NASDAQ. The Swiss market has 140 listings of foreign securities, London reports 382, and Luxembourg 197, according to data from the World Federation of Stock Exchanges20. Therefore, Canadian markets have practically abandoned trading in foreign securities21. This observation is perfectly consistent with our third proposition. 3.3. The characteristics of Canadian firms no longer cross-listed in 2003. In 1998, 244 Canadian securities are listed both on the TSX and on a foreign stock exchange, mainly an American one. In 2003, only 184 Canadian securities are still cross-listed. This evolution is in line with the evidence of Karolyi (2004), who observes that the number of internationally cross-listed stocks declined by over 50% from 1997 to 2002. According to the net advantages of listing in the U.S. for Canadian firms (King and Segal, 2004; Foerster and Huen, 2003), for institutional investors who trade their stocks (Domowitz et al., 2001), the reduction in the number of Canadian cross-listed stocks is puzzling. This change in cross-listing pattern around the world opens several research avenues that Karolyi (2004) lists in the conclusion of his. 19. http://www.sedar.com/csfsprod/data34/filings/00480106/00000021/SEDAR%3A%5Cfclnfnl.pdf http://www.fibv.com/publications/TA1102.pdf 21 The situation seems different, however, on the derivatives market. The ME reports an increase of 35% in 2002, as opposed to 9% in 2001, of its market share for interlisted Canadian options traded in the American market (April 23, 2003 ME press release). 20. 16.
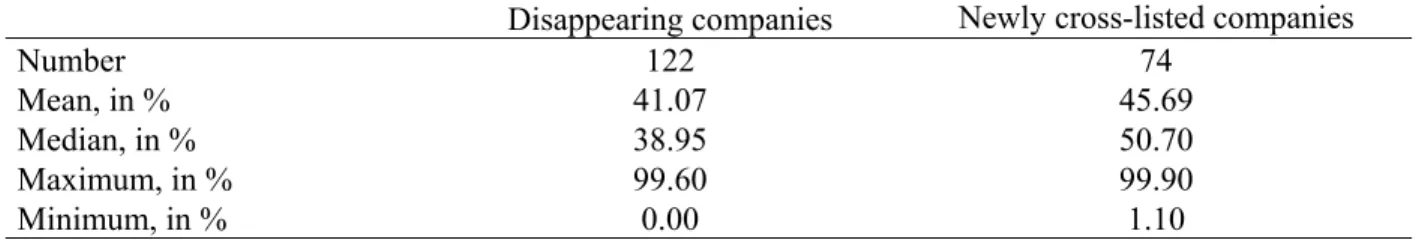
(20) paper. However, before exploring these issues, we believe that a better understanding of the real evolution is required. Firstly, the reduction in the number of cross-listed stocks occurs during a period when the total number of listed stocks drops significantly in developed markets. Between 1998 and 2003, the number of corporations listed on an American stock exchange decreases from 12,447 to 9,758, according to data available from the Word Federation of Exchanges22. Then, mergers and delistings can explain some of the disappearing cross-listings. In 1998, the proportion of Canadian cross-listed stocks was 5.6% (222/3943), and was 5.1% (184/3599) in 2003. Secondly, the reasons for the reduction in the number of cross-listed stocks are unclear. Two alternative hypotheses may be proposed. The first one contends that market integration and the homogenization of governance requirements and regulation reduce the advantages of crosslisting (Coffee, 2002), causing any advantages to vanish, and firms are likely to return to a strictly domestic listing. The other story is that the advantages of listing in a dominant market become so evident that firms delist from their home markets. We carefully analyze each of the Canadian firms which list and delist in the U.S. between 1998 and 2003. When it is possible, we analyze the reasons invoked by the firms to justify their moves. Table 7 summarizes our observations. In 1998, there are 244 cross-listed securities and 232 different companies23. In 2003, there are 184 different companies24. However, this 48-company decrease between 1998 and 2003 hides the disappearing of 122 companies and the addition of 74 new ones. The “in and out” movements of Canadian firms from the U.S. market are in fact more intensive than indicated by the global numbers25. We follow each of the 122 disappearing companies, to check the reasons why they are no longer cross-listed in 200326.. 22. http://www.fibv.com/WFE/home.Asp?nav=ie Some firms cross-list different classes. We considered that Canadian Pacific Limited was already split into five parts in 1998, even though the actual announcement date was February 13th 2001. 24 Allstream Inc. cross-lists two classes. We add Bowater Canada Inc., which is no longer reported in the TSE review lists of Canadian interlisted stocks, but still has a class of exchangeable shares listed on the TSE. 25 Note that the reported numbers may be undervalued since we do not count the “in and out” movement of a firm which cross-lists, for instance, in 1999, and which is no longer cross-listed in 2002. 26 We use the Survey of predecessor and defunct company and the corporate survey of the FPinfomart.ca database. We also use Sedar (the Canadian equivalent of Edgar) lists of American over-the-counter (O.T.C.) markets, Google and Copernic software. 23. 17.
(21) We find that 68 companies (56% of the disappearing companies) are acquired or merged. 18 (15%) are acquired by or merged with another Canadian interlisted firm27. 36 (30%) are acquired by or merged with a foreign firm, mainly an American one. On the whole, 54 Canadian firms, which are cross-listed in the U.S. in 1998, delist from the Canadian markets before the end of 2003. When they merge with a U.S. listed company, we should consider that they are attracted by the U.S. market. This is the case for 45% of the disappearing securities. 29 companies (24%) are not cross-listed in 2003 because they no longer meet the American stock exchange requirements. They are traded over the counter (O.T.C.) in the U.S., and are usually still listed on the TSX or on the TSX venture. These securities are always cross-listed, but as the official statistics do not consider O.T.C. markets, they disappear from the lists. 15 (12%) companies file for bankruptcy. Big Rock Brewery Ltd. is reorganized into an income trust, and does not list the trust units on NASDAQ28. 3 companies are no longer listed on an American exchange or on an American O.T.C., market. In one case (Synsorb Biotech Inc.) the delisting occurs due to a failure to comply with NASDAQ requirements, and in another case (Fletcher’s Fine Foods Inc.), the company voluntarily delists its securities in order to reduce administrative costs. 2 Canadian companies delist from the TSX and are still listed on an American stock exchange: Genetronics Biomedical Corporation and Denbury Resources29. The bottom line is that the reduction in the number of cross-listed Canadian firms is more a perception than a reality. The U.S. market absorbs a large number of these firms, generally by way of a merger or acquisition by a U.S.-listed corporation. A few companies delist from the Canadian market while a significant proportion transfer to the O.T.C., because they no longer comply with the listing requirements of major exchanges. Going private and bankruptcy account for 16% of the 122 disappearing companies. We detect only 2 firms (among 122) which 27. A Canadian firm which is interlisted either in 1998 or in 2003. Income Trusts rules limit the number of non-resident stockholders and few trusts are actually listed in the U.S. 29 In a news release dated March 22, 2002: Denbury Resources Inc. (NYSE / TSE symbols: DNR), announced today that it will de-list from The Toronto Stock Exchange (“TSE”) as of the close of business on April 15, 2002. Since the Company’s reincorporation in the United States in 1999, the Company’s trading volume on the TSE has dropped substantially relative to the volume on the NYSE and the number of its Canadian shareholders has also declined. As a result, the Company felt like it could no longer justify the incremental cost of the dual listing. The Company’s listing on the New York Stock Exchange will provide an active market in the Company’s stock and will be available to all shareholders regardless of the country where they reside. 28. 18.
(22) voluntarily return to the Canadian market. Table 8 summarizes the characteristics of the distribution of U.S. trades, for firms that delist in the U.S. and for new cross-listed stocks. The median of the distribution is close to 39% for delisted stocks, and over 50% for newly interlisted stocks. This is another piece of bad news for the Canadian market. A majority of the newly interlisted stocks are more heavily traded in the U.S. than in Canada, while firms that delist in the U.S. are mainly traded in Canada. 4 Conclusions and implications We document that the Canadian securities market is growing slowly and that large trades are increasingly being moved to the United States. The proportion of trades of foreign securities conducted in Canada has become insignificant, and it is difficult to consider these stocks in the Canadian capitalization. Since the early 1990s, a growing number of Canadian securities have been traded in the United States, and for these interlisted securities, around half of the trades are executed outside Canada. More than 90% of largely traded Canadian stocks are interlisted, and the stocks are increasingly trading in the U.S. The only dynamic element of the market is the high rate of creation of new companies, but this creation is associated with a high mortality rate, which leaves the total number of listed corporations unchanged. Our conclusion approximates that of Gaa et al., (2002, p. 31) who write: the results (…) suggest that the direction of change is towards a single global market through the interlinkage of national equity markets. Domestic intermediated markets would be undermined by this development, since the standardized products traded on those markets could be traded more efficiently and at lower cost on the global matching market. The domestic intermediated market would continue to exist, since there will always be relatively illiquid products and agents desiring to trade them. The transfer of large trades to the U.S. is consistent with the advantages of listing and trading abroad. Our observations and tests show that the optimistic view of the Canadian securities market trends is not borne out by an in-depth analysis of the various indicators of the attractiveness of the Canadian market. Our conclusions differ from the optimistic opinions about the Canadian stock market for several reasons: we corrected the numbers for the effect of the stock exchange restructuring and consider the net growth of capitalization and volume; we analyzed the interlisting phenomenon for the subsample of large capitalized stocks; and we. 19.
(23) studied the changes in the breakdown of the trading of interlisted stocks between the two markets. Galper (1999) defines three business models for stock exchanges in the 2000s. A global exchange (GEX. p. 6) dominates an economically linked community of several financial jurisdictions. It has the largest market capitalization in that community and the greatest trading volume and liquidity of any of its direct competitors. It trades both highly visible international securities and derivative products (...) It draws its clientele from a pool of both domestic and global investors. The TSX at least partially meets the criteria of a GEX, but bears a closer resemblance to a regional market (REX, p. 8), defined as follows: the Regional Exchange dominates its local economy. It has the greatest concentration of regional listings available and is the chief expert in these listings. By virtue of its intense national concentration, its index becomes a barometer of the health of the publicly quoted part of the regional economy. It may trade securities and derivative products. It draws its clientele primarily from regional investors, with a smaller share of international investors interested in benefiting from the available expertise and opportunities. The TSX Venture Exchange is clearly what Schulman (1999) defines as a Small and Medium Business Market (SMB), a category in which the NASDAQ also falls. To the extent that Canada has less than 600 corporations capable of being listed and traded on the NASDAQ, the TSX should also be put into this category. The implications are significant in terms of development strategy. According to Schulman (1999, p.14), the main element to consider for SMB exchanges is location: an exchange provides a real estate function for companies in the sense that it is where companies locate their stock listings and it is where customers (investors) come to buy and sell that stock. Therefore, to enhance the profile of an SMB market, exchanges should create attractive SMB market communities with financial influence, recognized value, and uniquely beneficial services. Since several large-cap securities are moving to the American stock exchanges, it seems inevitable that the Canadian exchange will increasingly become an exchange of medium and small businesses, as defined by international standards. In terms of public policy, more effort should be devoted to working on strategic alliances. Specifically, Canada should obtain a real mutual recognition system, and get the companies whose securities are traded on the American exchanges to be considered immune to U.S. civil and criminal liability under Rule 10b-5 of the 1934 Exchange Act. To facilitate access for U.S. 20.
(24) companies to the Canadian national market, and to keep trades and liquidity in the national market, Canada should also work to reduce the transaction costs, which are largely higher in Canada than in the U.S. for cross-listed companies. Moreover, Canada should particularly study the way the small and medium sized enterprises, which represent the largest proportion of its securities market, are listed, regulated and traded. This is probably the true challenge for the securities market meet in order to survive in Canada.. 21.
(25) References Black, B.S. (2001), “The Legal and Institutional Preconditions for Strong Securities Markets,” UCLA Law Review 48, 781-858. Baruch, S., G.A. Karolyi and M.L. Lemmon (2003), “Multi-Market Trading and Liquidity: Theory and Empirical Evidence,” Working paper, Ohio State University and University of Utah. Boisvert, S. and C. Gaa (2002), “Innovation and Competition in Canadian Equity Markets,” Bank of Canada Review 15-30, http://www.bankofcanada.ca/en/res/r01-3-eb.htm. Carpentier, C., Kooli, M. and J.M. Suret (2003) “Primary Issues in Canada: Status, Flaws and Dysfunctions,” Research Paper, Industry Canada, April, http://strategis.ic.gc.ca/epic/internet/insbrp-rppe.nsf/vwGeneratedInterE/rd00530e.html Chowdhry, B. and V. Nanda (1991) “Multimarket Trading and Market Liquidity,” Review of Financial Study 4, 483-511. Cleary, S. Ker K. and J. Schmitz (2002), “Transaction Costs for TSE Listed Stocks,” Canadian Investment Review http://www.investmentreview.com/archives/2002/spring/transactions.html. Coffee, J.C. (2002), “Racing Towards the Top?: The Impact of Cross-Listings and Stock Market Competition on International Corporate Governance,” Columbia Law and Economics & SSRN Working Paper 205. DiNoia, C. (2001), “Competition and Integration among Stock Exchanges in Europe: Network Effects, Implicit Mergers and Remote Access,” European Financial Management, 7(1), 39-72. Doidge, G., Karolyi, A. and R. Stulz (2004), “Why Are Foreign Firms that List in the U.S. Worth More?,” forthcoming in Journal of Financial Economics. Domowitz, I., J. Glen, and A. Madhavan (2001), “Liquidity, Volatility, and Equity Trading Costs Across Countries and Over Time.” International Finance, 4(2), 221-255. Doukas, J. and L.N. Swidler (2000), “Common Stock Returns and International Listing Announcements: Conditional Test of the Mild Segmentation Hypothesis,” Journal of Banking and Finance, 24, 471-502. Dyl, A. and M.A. Anderson (2002), “Market Structure and Trading Volume,” NYSE Working Paper 02 (2002) http://www.nyse.com/pdfs/2002-02.pdf. Eun C.E. and S. Sabherwal (2003), “Cross-Border Listing and Price Discovery: Evidence from U.S. Listed Canadian Stocks,” The Journal of Finance, 58 (2), 549-576. Foerster, S.R. and G.A. Karolyi (1993), “International Listing of Stocks: The Case of Canada and the U.S.,” Journal of International Business Studies, 24, 763-784. Foerster, S.R. and G.A. Karolyi (1998), “Multimarket Trading and Liquidity: A Transaction Data Analysis of Canada U.S. Interlistings,” Journal of International Financial Markets, Institution and Money, 393-412. Foerster, S. R. and B. C. Y. Huen (2003), “Does Corporate Governance Matter to Canadian Investors?” Working paper, NFA Meeting, 25 p.. 22.
(26) Freedman, C. and Engert, W. (2003), “Financial Developments in Canada: Past Trends and Future Challenges,” Bank of Canada Review, Summer, pp. 3-13. Gaa, C., S. Lumpkin, R. Ogrodnik and P. Thurlow (2002), “The Future Prospects for National Financial Markets and Trading Centres,” Bank of Canada Working Paper 2001-10, http://www.bankofcanada.ca/en/res/wp01-10.htm Galper, J. (1999), “Three Business Model for the Stock Exchange Industry,” World Federation of Stock Exchanges Working Paper, http://www.world-exchanges.org/index.asp?resolutionX=1280&resolutionY=1024. Jenkinson, T. and A. Ljungjvist (2001), Going Public: The Theories and Evidence on How Companies Raise Equity Finance, 2nd ed. (Oxford University Press). Karolyi, G.A. (1998), “Why Do Companies List Shares Abroad?: A Survey of the Evidence and Its Managerial Implications,” Financial Markets, Institutions & Instruments 28 (1), 1-60. Karolyi, G. A. (2004), The World of Cross-Listings and Cross-Listings of the World: Challenging Conventional Wisdom. Dice Center Working Paper No. 2004-14.: 62 p. King, M. R. and D. Segal (2004), “International Cross-Listing and the Bonding Hypothesis,” . Bank of Canada Working Paper, Ottawa: 40 p. Lang, M.H., K.V. Lins and D. Miller (2002), “ADRs, Analysts, and Accuracy: Does Cross-listing in the U.S. Improve a Firm's Information Environment and Increase Market Value?” NYSE Working Paper 2002-06. http://www.nyse.com/pdfs/2002-06.pdf. Licht, A.N. (2001), “David’s Dilemma. A Case Study of Securities Regulation in a Small Open Market,” Theoretical Inquiries in Law 2 (2), 673-710. Ljungqvist, A. and W. Whilhelm (2002), “IPO Allocations: Discriminatory or Discretionary?” Journal of Financial Economics 65 (2), 167-201. Mittoo, U.R. (1997) “Cross-Country Listing and Trading Volume: Evidence From the Toronto and Vancouver Stock Exchanges,” Journal of International Financial Management and Accounting 8, 147-174. Mittoo, U.R. (2002), “Globalization and the Value of U.S. Listing: Revisiting Canadian Evidence,” Working Paper, August, http://www.mgmt.utoronto.ca/cmi/news/august_index.htm Oliver, J. J, (2002), “The Changing Structure of Corporate Canada and Canadian Capital Markets,” Presentation at the Financial Forum, Schulich School of Business, York University February 4. http://www.ida.ca/Media/RecSpeech_en.asp Pagano, M., Roëll A. A., and J. Zechner, (2002) “The Geography of Equity Listing: Why do Companies List Abroad?” Journal of finance 57, (6), 2651-2694. Reguly, E., (1999) “Corporate Canada March South,” December, The Globe and Mail Report on Business. Reguly, E. (2002), “The Hollowing out of Corporate Canada,” Corporate Knight.ca, http://www.corporateknights.ca/stories/hollowing_out.asp Shearmur, R. (2001), “Financial Flow and Places: The Case of Montreal,” Canadian Public Policy 27 (2), 219-233.. 23.
(27) Schulman, A. (1999), “Small and Medium Size Business Markets,” World Federation of Stock Exchanges Working Paper, http://www.world-exchanges.org/index.asp?resolutionX=1280&resolutionY=1024. Steil, B. (2002), “Building a Transatlantic Securities Market.” International Securities Market Association, Zurich: 68 p. Steil, B. (2001), “Creating Securities Markets in Developing Countries: A New Approach for the Age of Automated Trading.” International Finance 4(2): 257-278.. 24.
(28) Table 1: Distribution of countries sampled according to the number of listed corporations at the end of 1990 and 2002 and distribution of the number of listed corporations at the end of 1990 and 2002 Panel A Initial distribution United States Canada Japan United Kingdom Germany France. Rank 1 4 5 7 15 14. 2002 Number 5,685 3,756 3,058 1,701 715 772. 1990 Rank 1 4 2 3 8 6. Number 6,599 1,144 2,071 1,701 413 578. Variation In % -13.85 228.32 47.66 0.00 73.12 33.56. Panel B Distribution corrected to take into account stock exchange restructuring 2002 United States Japan United Kingdom Canada TSE Germany France. Rank 1 4 6 9 15 14. 1990 Number 5,685 3,058 1,701 1,304 715 772. Rank 1 2 3 4 8 6. Number 6,599 2,071 1,701 1,193 413 578. Variation In % -13.85 47.66 0.00 9.30 (4.61) 73.12 33.56. Sources: Standard & Poors, Emerging Stock Market Fact Book, New York, 2000, 2001, Global Stock Markets Factbook 2003, and TSE Review, 1993 and 2001, Five Year Statistical Summary.. 25.
(29) Table 2: Ranking of the top 6 countries at the end of 1990 and 2002 by market capitalization, distribution of market capitalization in billions of US$, according to S&P data. Panel A shows gross data, and Panel B shows data net of index fluctuations. 2002 1990 Panel A Variation (%) United States Japan United Kingdom France Germany Canada S&P Canada corrected Panel B United States Japan United Kingdom France Germany Canada S&P Canada corrected. 261.29 -27.14 119.55 207.96 93.24 137.60 135.12 Variation (%) 35.60 -28.10 63.42 87.45 58.73 16.99 15.77. Rank 1 2 3 4 5 6 6. Capitalization 11,052 2,126 1,864 967 686 575 569. 2002 Net Capitalization 4,148 2,098 1,387 589 563 283 280. Rank 1 2 3 5 4 6 6. Capitalization 3,059 2,918 849 314 355 242 242. 1990 Net Capitalization 3,059 2,918 849 314 355 242 242. Sources: Standard & Poors, Emerging Stock Market Fact Book, New York, 2000 and 2001, Global Stock Markets Factbook 2003. TSE Review 1993 and 2001, Five-Year Statistical Summary, Bank of Canada exchange rate at the end of the year, and market index per country from DataStream.. 26.
(30) Table 3: Ranking of countries sampled and trading volume in US$ billion at the end of 1990 and 2002. Panel A shows gross data. Panel B shows data net of index fluctuations. Panel A. Variation (%). United States Japan United Kingdom. 1348.94 -1.81 875.27. 1 3 2. France Germany Canada. 699.15 N/A 471.83. 6 4 12. 2002 Rank Volume 25,371 1,573 2,721 935 1,233* 406. 1990 Rank. Volume. 1 2 4. 1,751 1,602 279 117. 5 3 6. 502 71. Panel B. Variation (%). 2002 Net Volume. 1990 Net Volume. United States Japan United Kingdom France Germany Canada. 443.83 -3.10 625.92 386.42 N/A 181.55. 9,522 1,552 2,025 569 1,013* 200. 1,751 1,602 279 117 502 71. Sources: Standard & Poors, Emerging Stock Market Factbook, New York, 2000, 2001, Global Stock Markets Factbook 2003 and stock market index by country from DataStream. *Data for Germany is not comparable between 1990 and 2000. The method of recording volume was changed in 1997 to eliminate partial double-counting of trades (Emerging Market Fact Book 2001, p. 37).. 27.
(31) Table 4: Annual distribution by number and value of Canadian stocks traded in the United States and geographical breakdown of trades # of Yearly secur ities2 1990 1991 1992 1993 1994 1995 1996 1997 1998 1999 2000 2001 2002 2003. 143 139 137 157 172 200 222 243 244 222 237 213 194 184. Value traded in millions of $ 68,540 59,115 68,019 149,760 199,014 249,886 334,304 411,477 490,663 566,331 1,280,983 805,399 665,373 704,683. Securities whose trading value is Traded elsewhere1 % < $100 >= $1,000 Total # < Traded million3 million3 # > 50% in % 1% in Canada1 # % # % 79 55.24 25 17.48 45.3 8 40 54.7 75 53.96 26 18.71 39.6 6 35 40 61 44.53 33 24.09 40.2 7 30 59.8 58 36.94 42 26.75 54.1 12 46 45.9 65 37.79 53 30.81 50.7 15 57 49.3 71 35.50 64 32.00 45.3 27 74 54.7 66 29.73 77 34.68 42.2 20 81 57.8 74 30.45 75 30.86 35.4 24 85 64.6 82 33.61 81 33.20 34.8 19 93 65.2 88 39.64 68 30.63 42.1 18 74 57.9 73 30.80 83 35.02 54.1 32 89 45.9 78 36.62 76 35.68 46.7 19 77 53.3 51 26.29 75 38.66 38.8 6 73 61.2 38 20.65 87 47.28 40.1 0 81 59.9. Source: Toronto Stock Exchange Review, December 1990 to December 2003. 1. The percentage of trading value is based on capitalization. 2 Certain securities show zero trading value: in 1990, Fahnestock II, in 1994, Currage Inc. and U. Dominion, in 1995, Currage Inc., in 1996, STN Inc., in 1997, Trizec Hahn and Moores Retail, and in 1998 Rea Gold and Tee-Com. 3 We deflate the limits of CAN$100 million and CAN$1,000 million as of December 31, 2003 using the Canadian stock market index from DataStream. Table 5: Chi-square test of the null hypothesis: the proportion of interlisted Canadian stocks traded in Canada is the same in 1993 and in 2003. The sample is restricted to the interlisted Canadian stocks of 2003.. % <20 1993 Number of stocks Relative frequency (%) 2003 Number of stocks Relative frequency (%). Proportion of trade concluded in Canada 20<%<40 40<%<60 60<%<80 %>80. Total. 6 3.26. 3 1.63. 5 2.72. 11 5.98. 159 86.41. 184 100.00. 23 12.5. 39 21.20. 33 17.93. 30 16.30. 59 32.07. 184 100.00. Chi- Square. 116.13. Source: Toronto Stock Exchange Review, December 1993 and December 2003.. 28.
(32) Table 6: Annual distribution of the number and trading value of foreign and American interlisted securities and the breakdown of trading between Canada and other countries.. Year. 1990 1991 1992 1993 1994 1995 1996 1997 1998 1999 2000 2001 2002 2003. # of Value traded securi in millions of $ ties 54 57 63 62 56 47 47 35 32 24 23 23 18 16. 212,379 218,813 251,522 326,617 297,547 282,585 316,994 369,691 452,385 203,0572 186,9712 180,3452 176,192 175,998. Securities of which the value traded is <$100 >=$1,000 million4 million4 # % # % 11 20.37 32 59.26 11 19.30 34 59.65 14 22.22 34 53.97 18 29.03 35 56.45 13 23.21 37 66.07 9 19.15 27 57.45 13 27.66 23 48.94 7 20.00 20 57.14 7 21.88 19 59.38 7 29.17 14 58.33 7 30.43 11 47.83 4 17.39 12 52.17 5 27.78 9 50.00 5 31.25 7 43.75. Traded in Canada1. Traded. Total in %. #< 1%. #> 50%. elsewhe re1 in %. 0.00 0.20 0.10 0.20 0.10 0.10 0.20 0.10 0.00 0.60 0.70 0.10 0.10 0.20. 47 48 49 46 42 35 34 26 26 17 17 19 14 12. 0 1 6 4 3 5 6 2 2 2 2 1 0 1. 100.00 99.80 99.90 99.80 99.90 99.90 99.80 99.80 100.00 99.40 99.30 99.90 99.90 99.80. Sources: Toronto Stock Exchange Review, December 1990 to December 2003. 1. The percentage of value traded is based on capitalization.. 2. The total values traded reported by the TSE Review for 1999, 2000 and 2001 are 189,934, 168,771 and 170,011 respectively, and do not correspond to the total value traded for each interlisted security (reported in this table). 3. Certain securities did not trade: in 1990, Coleco Inc. and Stan West J, 1993, British Tel Int, in 1996, Owens Corning (2 securities) and, in 1997, Tenneco Inc.. 4. We deflate the limits of CAN$100 million and CAN$1,000 million as of December 31, 2003 using the Canadian stock market index from DataStream. 29.
(33) Table 7: Number of Canadian securities and Canadian companies both listed on a Canadian stock exchange and on a foreign stock exchange (mainly an American stock exchange) in 1998 and in 2003. Analysis of the reasons why 122 companies are cross-listed in 1998 but are no longer cross-listed in 2003. Panel A: Interlisted Canadian securities Year Number of securities Number of companies Number of new interlisted companies: companies that are cross-listed in 2003 but are not cross-listed in 1998 Number of disappearing companies: companies that are crosslisted in 1998 but are not cross-listed in 2003. Panel B: Analysis of the reasons why 122 companies are cross-listed in 1998 but are no longer cross-listed in 2003 Merger or acquisition With or by another Canadian interlisted company With or by a foreign company With or by Canadian company Securities are traded on an American O.T.C. market Bankruptcy Privatization Reorganization into an Income Trust Delisted from the foreign stock exchange (voluntarily: 2) Voluntarily delisted from the Toronto stock exchange Total. 1998 244 232. 2003 184 184 74. 122 1998-2003. 1998-2003. # 68 18 36 12 29 15 4 1 3 2 122. % 55.74 14.75 29.51 9.84 23.77 12.30 3.28 0.82 2.46 1.64 100.00. Sources: TSE review December 2003, TSE review December 1998, FPinfomart.ca, Sedar, www.otcbb.com, www.pinksheets.com , Google and Copernic software.. Table 8: Characteristics of the distribution of interlisted Canadian stock traded in a foreign market (mainly an American market) for disappearing companies (companies cross-listed in 1998 and not cross-listed in 2003) and for newly cross-listed stocks (companies crosslisted in 2003 and not cross-listed in 1998). Number Mean, in % Median, in % Maximum, in % Minimum, in %. Disappearing companies 122 41.07 38.95 99.60 0.00. Newly cross-listed companies 74 45.69 50.70 99.90 1.10. Source: TSE Review December 2003, TSE Review December 1998, FPinfomart.ca, Sedar, www.otcbb.com, www.pinksheets.com, Google and Copernic software.. 30.
Figure
+6
Documents relatifs
We studied the integration between the six major Latin American stock markets and the US stock market by applying the threshold cointegration techniques developed by Hansen and
Les problèmes préexistants d’accessibilité et d’adaptation aux besoins des femmes du système de soins et de santé se sont nettement aggravés (services à domicile, femmes
During the 70's, the NEB can increase border prices without diminishing export volumes as a result of chronic excess demand on the US gas market.. The appearance of
Rey F, Cécillon L, Cordonnier T, Jaunatre R, Loucougaray G (2015) Integrating ecological engineering and ecological intensification from management practices to ecosystem services
Between the spatial restriction of cell surface receptor activation, the varied signaling pathways activated by Ca 2+ , and the combinatorial potential for transcription factor
Herein, we have evaluated the immunostimula- tory effects of SLA archaeosomes when used as adjuvant with ovalbumin (OVA) and hepati- tis B surface antigen (HBsAg) and compared this
The control system development includes the electrical wiring and interfacing of various actuators, sensors and the controller; the design and implementation of
However, in a “pla- teau” region exhibiting significant slope of In(p) vs x, each hydrogen aliquot causes, in addition to conversion between the two phases,
