Crop Breeding and Applied Biotechnology 8: 271-278, 2008 Brazilian Society of Plant Breeding. Printed in Brazil
Received 29 January 2008 Accepted 09 June 2008
Inter-trait relations for direct and indirect selection in
coffee
Romário Gava Ferrão1*, Adésio Ferreira2,Cosme Damião Cruz3, Paulo Roberto Cecon3, Maria Amélia Gava Ferrão4, Aymbiré Francisco Almeida da Fonseca4, Pedro Crescêncio de Souza Carneiro3, and Marcia Flores da Silva2
ABSTRACT – The purpose of this study was to verify the possibility of using direct selection in nine traits underlying indirect selection for yield and determine which traits should participate in the selection process. Data of 40 Conilon coffee genotypes were analyzed in two experiments in the growing seasons of 1996, 1998, 1999, 2000 and 2001 in random blocks with four and six replications. The significance of phenotypic associations was evaluated by the t test and the genotypic and environmental associations by bootstrap resampling. The genotypic associations were higher than the phenotypic, indicating a prevailing influence of the genotypic over the environmental effects in the relationship between significant traits; equal signs indicated a lack of contrary action among the effects. The traits related to cycle; yield; ratio of fresh ripe cherries to clean coffee; empty or flat grains; and sieve 17 should be maintained in the selection, evaluation and study of genetic divergence. The estimated gains in grain yield by indirect selection for any trait studied are not satisfactory.
Key words: Coffea canephora, genetic improvement, bootstrap, significance tests.
1Instituto Capixaba de Pesquisa, Assistência Técnica e Extensão Rural, Rua Afonso Sarlo, 160, 29.052-010, Vitória, ES, Brazil. *E-mail: [email protected]
2Universidade Federal de São João Del-Rei, Campus Centro Oeste Dona Lindu, Av. Sebastião Gonçalves Coelho, 400 Chanadour, 35501-296, Divinópolis, MG, Brazil
3Universidade Federal de Viçosa, Avenida Peter Henry Rolfs, s/n Campus Universitário, 36570-000, Viçosa, MG, Brazil
4EMBRAPA/Instituto Capixaba de Pesquisa, Assistência Técnica e Extensão Rural, Centro Regional Centro-Serrano, BR 262, km 92, 29052-010, Venda Nova do Imigrante, ES, Brazil
INTRODUCTION
The study of relations between traits is essential, because breeding is generally aimed at improving a number of traits simultaneously, rather than of individual traits of the plant material (Ferreira et al. 2003, and Vencovsky and Barriga 1992).
Estimates of simple correlation allow an evaluation of the magnitude and direction of relations between two traits. These associations may have a genetic, environmental or phenotypic nature in genetic
improvement. The genetic correlation explains the additive and the environmental correlation the non-additive components, so both are determinants of phenotypic correlation (Kominakis 2003).
The genetic correlation indicates the degree of genetic association between traits, in other words, it quantifies the influence of one particular trait on another, i.e., when the genetic correlation is high, the change by selection in one trait leads to alterations in other correlated traits (Resende 2002).
The knowledge of the existence of inter-trait associations underlying the study of correlations in programs of genetic improvement, permits the indirect selection of traits of difficult measurement or low heritability, based on other more easily measurable and highly heritable traits, which results in genetic gains together with time, labor and cost savings (Resende 2002). However, in the selection of a trait that is negatively correlated with one or more and positively with other(s), care must be taken not to cause undesirable changes in other (s) (Cruz et al. 2004).
Correlations are also used as tools to reduce the number of study traits, for example, in analyses of genetic divergence, where available traits are redundant, due to their correlation with other more easily measurable traits whose evaluation is less time and/or cost-demanding (Cruz et al. 2004).
In breeding programs of the genus Coffea, most studies of inter-trait correlations and/or associations (fixed effect) in Brazil and the world are focused on Coffea arabica. Studies on Coffea canephora, variety Conilon, are rare. As an example, one can cite the study of Fonseca (1999), who estimated the phenotypic, genetic and environmental correlations in 80 genotypes of Conilon coffee for eight traits.
Yield is the main criterion for selection of coffee trees, which usually have biennial bearing and are influenced by abiotic factors. Therefore, the quantification and knowledge of the nature of the correlation between yield and morphological traits can be useful in the selection of coffee (Dhaliwal 1968).
Aiming to meet the demands of consumers and to ensure environmental sustainability, as well as for greater socio-economic benefits of coffee cultivation, coffee breeding programs have been focused on the improvement of other agronomic traits such as fruit type, uniform maturation and fruit size. Consequently, the nature of associations and/or correlations among these and the yield-related traits must be quantified and understood.
The purpose of this study was to verify the possibility of using direct selection in nine traits underlying indirect selection for yield and determine which traits must participate in the selection process, in 40 genotypes of the Genetic Improvement Program of the INCAPER Conilon coffee.
MATERIAL AND METHODS
Forty genotypes of C. canephora var. Conilon of the genetic improvement program of Conilon coffee of INCAPER (Instituto Capixaba de Pesquisa, Assistência Técnica e Extensão Rural), state of Espirito Santo (ES) were studied. Of these, 35 clones were descendants of phenotypic selection from mother plants found on agricultural areas in several counties in the northern region of the state; three were elite clones: ES 01, classified as early-maturing, ES 23, medium- maturing, and ES 36, late-maturing; one a seed propagated cultivar of the INCAPER breeding program and one a commercial polyclonal cultivar.
Data from two experiments planted in 1993 and conducted in the growing seasons of 1996, 1998, 1999, 2000 and 2001 on experimental farms of the INCAPER, ES, in the counties of Marilândia and Sooretama, ES, were analyzed. The experimental sites are representative of climate and soil in the northern region of the state, where coffee cultivation is intensive.
In Marilândia (lat 19 º 24’48" S, long 40 ° 32’27 “W, at 70 m asl) the annual rainfall is 1,100 mm at a relative humidity of 74% and the mean annual temperature 24 ° C. The topography is wavy-rugged, and the soil classified as low fertile and crystalline. In Sooretama (lat 19 º 11’30 “S, long 40 ° 05’46" W; 40 m asl) the topography is flat, with prevailing south wind and a sandy dystrophic red-yellow Latosol (80% sand) of low fertility, annual rainfall of 1,200 mm, poorly distributed, with average annual temperature of 24º C and relative humidity of 80 %.
Fertilization was carried out according to the soil analysis and a targeting a yield of 80 bags of green coffee per hectare. K2O was applied in three portions
340 kg ha-1, N, 55 kg ha-1of P
2O5 and 170 kg ha-1 K2O.
The experimental management and cultural treatments followed technical recommendations and the crop needs, using no irrigation.
The experiments were installed in randomized blocks, with four and six replications, with two healthy plants per plot. The spacing was 3x1.5m with a planting density of 2,222 plants ha-1.
Ten traits were evaluated: cycle (C) - number of days from flowering to the main harvest; mean grain yield (MGY) – green coffee yield in kg ha-1, at 14%
moisture; yield in kilograms of fresh cherry/green coffee (FCh/GC); yield in kilograms of dry cherry/green coffee
(DCh/GC); percentage of fruit with empty grains (EmG); percentage of flat grains (FlG); percentage of mocha grains (MOG); percentage of grains retained a sieve over 15 (Sieve17); percentage of grain retained in sieve 15 (Sieve15) and percentage of grain retained in sieve 13 (Sieve13).
An individual analysis of variance was performed at each location and year with the genotype effects (clones and varieties) as fixed in the model, for not representing a sample of the variability in Robusta in the northern state of Espirito Santo. The associations were estimated as proposed by Cruz et al. (2004).
The significance of the coefficient of phenotypic association was evaluated by the t test for the genotypic and environmental associations using bootstrap methodology. This methodology is the destructuration of the data set by the exchange of information of each treatment with one of the traits of the analyzed pair, creating new data sets, specifically 5000 bootstrap replicates, in which each data replicate underwent analysis of variance, resulting in estimates of 5000 new associations.
The statistical software system GENES (Cruz 2006) was used to carry out the statistical analyses.
RESULTS AND DISCUSSION
The analysis of magnitude of phenotypic (Table 1) and genotypic associations (Table 2) showed that the genotypic exceeded the phenotypic associations in 93.33% of the cases in Sooretama and in 80.44% in Marilândia. These percentages at the two locations were higher than observed by Fonseca (1999). Although the magnitude of associations was studied, particular attention should be paid to study the significant associations. It was found that 107 phenotypic associations (Table 1) were significant at 5% or 1% probability by the t test and 141 genotypic associations (Table 2) were significant at 5% or 1% probability by the bootstrap test, while no associations were observed for the others.
The magnitude of only nine of the 107 phenotypic significant associations was higher than the genotypic and only four combinations of these genotypic associations were not significant. Of the 141 significant genotypic associations 137 were greater than the phenotypic and of these combinations 38 phenotypic associations were insignificant.
The above results suggest that the influence of the genetic factors on the inter-trait relationship was greater than of the environmental factors. The superiority of genotypic associations is relevant, because in breeding programs genetic associations are used as an orientation since only these involve an inheritable combination. In genetic studies it is essential to distinguish and quantify the degree of genetic and environmental inter- trait associations (Cruz et al. 2004). It is possible that the phenotypic correlations were lower than the genotypic as a result of the modifying effects of the environment in trait association at the gene level (Pandey 1981).
The agreement of the signs of the estimated coefficients of genotypic (Table 1) and environmental associations (Table 3) was 61.33% in Sooretama and 63.55% in Marilândia, indicated a sensitive environmental influence on the inter- trait associations. It was found that many of these environmental and genotypic associations were not significant. The analysis revealed that in Sooretama 76 environmental and 78 genotypic associations were significant and Marilândia 74 environmental and 63 genotypic associations.
In Sooretama, 37 of the environmental associations (Table 3) were significant and genotypic associations absent, as for example, in 2001 the combination FCh/GC X S17. In Marilândia 42 environmental associations (Table 3) were significant and genotypic associations absent. The result of these combinations shows the predominant influence of the environment. According to Falconer and Mackay 1996 the environment causes a correlation when two traits are influenced by the same environmental variations.
In Sooretama, 39 of the genotypic associations (Table 1) were significant and environmental associations absent, as for example, in the combination CX FlG, in 2001. In Marilândia 31 genotypic associations were significant and environmental associations absent. In Sooretama and Marilândia, in 39 and 32 combinations, respectively, significant genotypic and environmental associations were observed simultaneously, for example, in Sooretama in 2001 for MGY X S15. It is worth pointing out that these traits share at least part of the genes involved in their expressions (Ecochard and Ravelomanantsoa 1982).
Combinations Sooretama Marilândia
Growing seasons (years) Growing seasons (years)
1996 1998 1999 2000 2001 1996 1998 1999 2000 2001 C X MGY -0.184 0.082 -0.092 0.087 -0.057 0.044 -0.152* 0.049 -0.073 -0.049 C X FCh/GC 0.412** -0.268 0.445** 0.116 -0.148 -0.370* 0.394 0.071 0.386* 0.077 C X DCh/GC 0.434** -0.324* 0.086 -0.205 -0.059 0.383* 0.580** 0.093 0.479** 0.091 C X EmG 0.149 -0.244 -0.036 -0.468** -0.328* 0.220 -0.077 -0.038 0.008 0.190 C X FlG -0.206 -0.286 -0.227 -0.194 -0.250 -0.131 -0.072 -0.114 -0.278 -0.255 C X MOG 0.210 0.286 0.196 0.188 0.254 0.133 0.057 0.116 0.282 0.257 C X S17 0.041 0.008 0.038 0.101 -0.107 0.102 0.447** 0.029 0.017 0.001 C X S15 0.388* 0.109 0.164 0.112 0.105 0.339* 0.368* 0.261 0.082 0.149 C X P13 -0.197 0.061 -0.099 -0.114 0.168 -0.251 -0.194 -0.121 0.002 -0.035 MGY X FCh/GC 0.150 -0.164 -0.149 -0.101 -0.071 -0.082 -0.152 0.126 -0.002 0.103 MGY X DCh/GC 0.073 -0.384* -0.329* -0.309* 0.088 -0.016 -0.224 -0.045 -0.176 -0.283 MGY X EmG -0.153 -0.071 -0.450** -0.219 -0.314* -0.230 0.119 -0.129 -0.149 -0.296 MGY X FlG 0.283 -0.093 -0.082 -0.223 0.074 0.138 0.105 -0.019 0.270 0.043 MGY X MOG -0.273 0.092 0.063 0.204 -0.069 -0.141 -0.095 0.022 -0.272 -0.046 MGY X S17 0.031 0.062 0.072 0.202 0.250 0.055 0.074 0.057 0.110 0.017 MGY X S15 0.018 0.136 0.272 0.404** 0.358* 0.019 -0.050 0.033 0.195 0.019 MGY X P13 -0.018 0.093 -0.129 -0.305 -0.208 -0.041 -0.057 0.037 -0.035 0.051 FCh/GC X DCh/GC 0.891** 0.754 0.471** 0.570** 0.474** -0.013 0.872** 0.917** 0.765** 0.383* FCh/GC X EmG 0.364* 0.372* 0.218 -0.072 0.072 -0.102 0.138 0.739** 0.057 -0.211 FCh/GC X FlG 0.001 0.034 -0.230 -0.170 -0.060 0.025 -0.186 -0.122 -0.194 -0.063 FCh/GC X MOG -0.007 -0.031 0.166 0.170 0.086 -0.018 0.181 0.124 0.189 0.054 FCh/GC X S17 -0.141 -0.341* -0.205 -0.393* -0.282 -0.371* 0.066 -0.303 -0.043 -0.404** FCh/GC X S15 0.090 -0.345* 0.082 -0.198 -0.235 -0.171 0.100 -0.229 -0.174 -0.291 FCh/GC X P13 0.106 0.271 0.038 0.430** 0.253 0.408** -0.169 0.264 0.081 0.387* DCh/GC X EmG 0.584** 0.523** 0.457** 0.353* 0.066 0.332* 0.050 0.792** 0.075 0.209 DCh/GC X FlG -0.179 0.111 -0.273 0.054 -0.227 -0.409** -0.169 -0.139 -0.225 0.083 DCh/GC X MOG 0.178 -0.108 0.263 -0.044 0.233 0.409** 0.160 0.140 0.226 -0.085 DCh/GC X S17 -0.200 -0.313* -0.055 -0.400* -0.209 -0.171 0.036 -0.325* -0.183 -0.300 DCh/GC X 15 0.130 -0.302 -0.180 -0.136 -0.070 0.069 0.068 -0.213 -0.285 -0.158 DCh/GCX P13 0.117 0.132 -0.019 0.400* 0.135 0.100 -0.153 0.178 0.219 0.322* EmGX FlG -0.252 0.298 0.095 0.126 0.358* -0.168 -0.015 -0.054 -0.049 0.079 EmG X MOG 0.259 -0.296 -0.149 -0.132 -0.349* 0.169 0.024 0.053 0.045 -0.088 EmG X S17 -0.013 -0.033 -0.070 -0.134 -0.193 0.252 -0.043 -0.231 -0.069 0.426** EmG X S15 0.147 0.100 -0.343* -0.304 -0.158 0.017 0.119 -0.149 -0.100 0.333* EmG X P13 -0.046 -0.098 0.155 0.139 0.063 -0.220 -0.025 0.228 0.119 -0.360* FlG X MOG -0.998** -1.000 -0.824** -0.994** -0.998** -1.000 -0.998** -1.000** -0.999** -0.997** FlG X S17 0.376* 0.272 0.285 0.171 0.191 0.308 0.197 0.285 0.320* 0.253 FlG X S15 -0.083 0.342* 0.321* -0.037 0.079 0.025 0.138 0.309 0.264 0.224 FlG X P13 -0.278 -0.334* -0.126 -0.163 -0.228 -0.276 0.102 0.062 -0.224 -0.157 MOG X S17 -0.377* -0.271 -0.183 -0.165 -0.212 -0.314* -0.194 -0.285 -0.321* -0.258 MOG X S15 0.083 -0.340* -0.186 0.054 -0.096 -0.029 -0.137 -0.308 -0.257 -0.218 MOG X P13 0.278 0.331* 0.023 0.147 0.249 0.284 -0.110 -0.063 0.218 0.162 S17 X S15 0.089 0.473** 0.581** 0.213 0.506** 0.009 0.654** 0.747** 0.727** 0.600** S17 X P13 -0.843** -0.717** -0.892** -0.871** -0.897** -0.851** -0.617** -0.606** -0.873** -0.868** S15 X P13 -0.553** -0.795** -0.716** -0.600** -0.715** -0.524** -0.527** -0.317* -0.832** -0.802**
**,*: Significant at 1 and 5%, by the t test, respectively; C= period in number of days from main flowering to full maturity; MGY= mean grain yield (kg/ha); FCh/GC= ratio coffee cherry /green coffee; DCh/GC= ratio dry cherry/green coffee; EmG= empty grains (%), FlG= flat grains (%); MOG= mocha grains (%) and Sieve 17, Sieve 15 and Sieve 13
Table 1. Estimates of coefficients of phenotypic association (rf), in 10 traits of coffee Conilon, in five years at two locations, Sooretama and Marilândia, ES
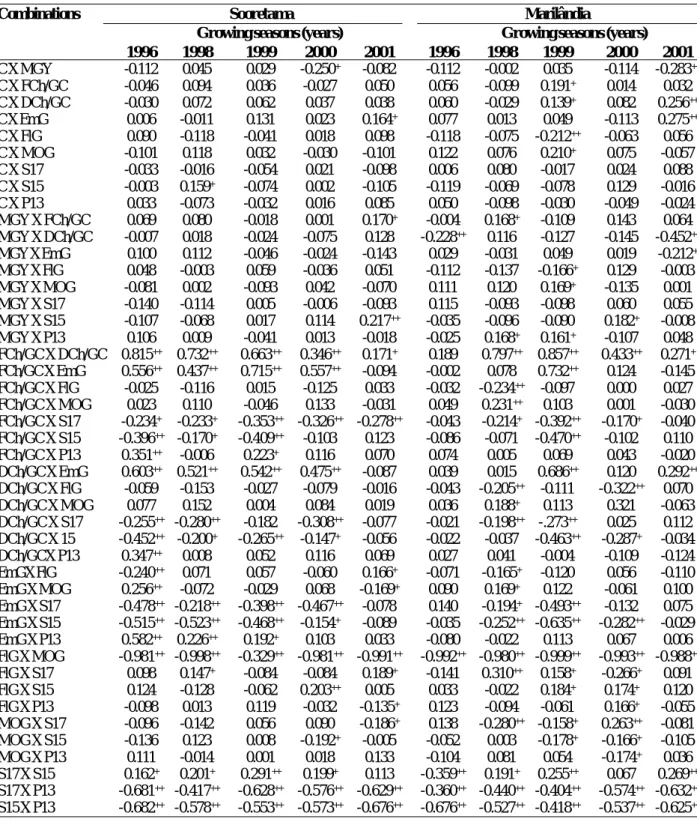
++,+: Significant at 1 and 5%, respectively, by 5000 bootstrap simulations; C= period in number of days from main flowering to full maturity;
MGY= mean grain yield (kg/ha); FCh/GC= ratio coffee cherry /green coffee; DCh/GC= ratio dry cherry/green coffee; EmG= empty grains (%), FlG= flat grains (%); MOG= mocha grains (%) and Sieve 17, Sieve 15 and Sieve 13
Table 2. Estimates of coefficients of genotypic association (rg), in 10 traits of coffee Conilon, in five years at two locations, Sooretama and Marilândia, ES
Combinations Sooretama Marilândia
Growing seasons (years) Growing seasons (years)
1996 1998 1999 2000 2001 1996 1998 1999 2000 2001 C X MGY -0.189 0.086 -0.096 0.095 -0.054 0.054 -0.163 0.051 -0.072 -0.025 C X FCh/GC 0.454++ -0.293 0.484++ 0.128 -0.209 -0.411+ 0.453+ 0.054 0.513++ 0.097 C X DCh/GC 0.509++ -0.393+ 0.100 -0.250 -0.227 0.406+ 0.641++ 0.086 0.597++ 0.060 C X EmG 0.204 -0.303+ -0.043 -0.572++ -0.419+ 0.233+ -0.115 -0.052 0.062++ 0.182 C X FlG -0.225 -0.291+ -0.241 -0.235 -0.304+ -0.132 -0.072 -0.102 -0.334+ -0.324 C X MOG 0.229 0.291 0.243 0.226 0.309 0.134 0.056 0.104 0.335+ 0.328+ C X S17 0.042 0.008 0.039 0.102 -0.109 0.103 0.459++ 0.033 0.016 -0.006 C X S15 0.404++ 0.109 0.165 0.114 0.141 0.353++ 0.378+ 0.282 0.078 0.161 C X P13 -0.203 0.061 -0.100 -0.116 0.181 -0.255 -0.197 -0.128 0.009 -0.036 MGY X FCh/GC 0.161 -0.203 -0.166 -0.122 -0.149 -0.097 -0.201 0.167 -0.021 0.124 MGY X DCh/GC 0.090 -0.498++ -0.398+ -0.390+ 0.149 0.014 -0.269 -0.031 -0.191 -0.261 MGY X EmG -0.247 -0.124 -0.525++ -0.285 -0.354+ -0.269 0.188 -0.162 -0.206 -0.305+ MGY X FlG 0.309+ -0.101 -0.097 -0.284 0.079 0.163 0.129 0.002 0.296+ 0.054 MGY X MOG -0.294 0.100 0.101 0.255 -0.069 -0.166 -0.116 0.000 -0.298 -0.058 MGY X S17 0.039 0.070 0.076 0.224 0.303+ 0.055 0.083 0.073 0.116 0.014 MGY X S15 0.027 0.147 0.284 0.441++ 0.391+ 0.024 -0.050 0.040 0.196 0.021 MGY X P13 -0.025 0.099 -0.134 -0.339+ -0.241 -0.043 -0.066 0.028 -0.032 0.051 FCh/GC X DCh/GC 0.918++ 0.778++ 0.426+ 0.653++ 1.000++ -0.044 0.887++ 0.927++ 0.893++ 0.458+ FCh/GC X EmG 0.322 0.364+ 0.103 -0.277 0.146 -0.119 0.180 0.740++ 0.019 -0.252 FCh/GC X FlG 0.005 0.048 -0.268 -0.187 -0.096 0.032 -0.181 -0.126 -0.261 -0.111 FCh/GC X MOG -0.012 -0.045 0.240 0.184 0.134 -0.025 0.176 0.127 0.254 0.100 FCh/GC X S17 -0.141 -0.365+ -0.204 -0.414+ -0.299 -0.405++ 0.087 -0.298+ -0.011 -0.537++ FCh/GC X S15 0.141 -0.371+ 0.112 -0.212 -0.393+ -0.183 0.113 -0.226 -0.197 -0.416+ FCh/GC X P13 0.090 0.297+ 0.026 0.470++ 0.329 0.445++ -0.188 0.286 0.093 0.528+ DCh/GC X EmG 0.597++ 0.524++ 0.430+ 0.294 0.379 0.370+ 0.070 0.812++ 0.055 0.207 DCh/GC X FlG -0.207 0.158 -0.335+ 0.117 -0.766+ -0.440++ -0.165 -0.143 -0.196 0.090 DCh/GC X MOG 0.202 -0.154 0.384+ -0.103 0.785+ 0.441++ 0.157 0.144 0.197 -0.097 DCh/GC X S17 -0.213 -0.363+ -0.049 -0.460++ -0.615 -0.181 0.050 -0.335++ -0.234 -0.416+ DCh/GC X 15 0.220 -0.355+ -0.192 -0.150 -0.159 0.077 0.075 -0.209 -0.298 -0.201 DCh/GCX P13 0.101 0.159 -0.027 0.481+ 0.371 0.105 -0.168 0.197 0.280 0.452+ EmGX FlG -0.285 0.366+ 0.104 0.216 0.409++ -0.178 0.028 -0.044 -0.099 0.120 EmG X MOG 0.291 -0.364 -0.199 -0.225 -0.398+ 0.177 -0.016 0.042 0.095 -0.129 EmG X S17 0.042 -0.027 -0.050 -0.113 -0.220 0.265 -0.034 -0.207 -0.052 0.455++ EmG X S15 0.325 0.159 -0.362+ -0.358+ -0.179 0.022 0.190 -0.130 -0.073 0.362+ EmG X P13 -0.161 -0.140 0.162 0.160 0.070 -0.232 -0.034 0.245 0.148 -0.391++ FlG X MOG -1.00++ -1.00++ -1.00++ -1.00++ -1.00++ -1.00++ -1.00++ -1.00++ -1.00++ -1.00++ FlG X S17 0.398+ 0.276++ 0.310+ 0.219 0.191 0.320+ 0.194 0.298+ 0.440++ 0.293 FlG X S15 -0.101 0.353++ 0.347+ -0.070 0.099 0.025 0.145 0.322+ 0.284 0.253 FlG X P13 -0.294 -0.343+ -0.143 -0.196 -0.248 -0.288 0.110 0.070 -0.285 -0.182 MOG X S17 -0.398++ -0.275+ -0.236 -0.210 -0.217 -0.326+ -0.193 -0.298+ -0.44++ -0.302 MOG X S15 0.103 -0.351+ -0.234 0.088 -0.120 -0.028 -0.143 -0.321+ -0.276 -0.249 MOG X P13 0.293++ 0.340++ 0.028 0.176 0.275+ 0.296+ -0.118 -0.071 0.278 0.192 S17 X S15 0.087 0.475++ 0.586++ 0.213 0.595++ 0.016 0.661++ 0.767++ 0.800++ 0.620++ S17 X P13 -0.848++ -0.720++ -0.898++ -0.878++ -0.946++ -0.857++ -0.620++ -0.616++ -0.911++ -0.884++ S15 X P13 -0.548++ -0.798++ -0.719++ -0.601++ -0.727++ -0.522++ -0.527++ -0.316 -0.853++ -0.814++
++,+: Significant at 1 and 5%, respectively, by 5000 bootstrap simulations; C= period in number of days from main flowering to full maturity;
MGY= mean grain yield (kg/ha); FCh/GC= ratio coffee cherry /green coffee; DCh/GC= ratio dry cherry/green coffee; EmG= empty grains (%), FlG= flat grains (%); MOG= mocha grains (%) and Sieve 17, Sieve 15 and Sieve 13
Combinations Sooretama Marilândia
Growing seasons (years) Growing seasons (years)
1996 1998 1999 2000 2001 1996 1998 1999 2000 2001 C X MGY -0.112 0.045 0.029 -0.250+ -0.082 -0.112 -0.002 0.035 -0.114 -0.283++ C X FCh/GC -0.046 0.094 0.036 -0.027 0.050 0.056 -0.099 0.191+ 0.014 0.032 C X DCh/GC -0.030 0.072 0.062 0.037 0.038 0.060 -0.029 0.139+ 0.082 0.256++ C X EmG 0.006 -0.011 0.131 0.023 0.164+ 0.077 0.013 0.049 -0.113 0.275++ C X FlG 0.090 -0.118 -0.041 0.018 0.098 -0.118 -0.075 -0.212++ -0.063 0.056 C X MOG -0.101 0.118 0.032 -0.030 -0.101 0.122 0.076 0.210+ 0.075 -0.057 C X S17 -0.033 -0.016 -0.054 0.021 -0.098 0.006 0.080 -0.017 0.024 0.088 C X S15 -0.003 0.159+ -0.074 0.002 -0.105 -0.119 -0.069 -0.078 0.129 -0.016 C X P13 0.033 -0.073 -0.032 0.016 0.085 0.050 -0.098 -0.030 -0.049 -0.024 MGY X FCh/GC 0.069 0.080 -0.018 0.001 0.170+ -0.004 0.168+ -0.109 0.143 0.064 MGY X DCh/GC -0.007 0.018 -0.024 -0.075 0.128 -0.228++ 0.116 -0.127 -0.145 -0.452++ MGY X EmG 0.100 0.112 -0.046 -0.024 -0.143 0.029 -0.031 0.049 0.019 -0.212+ MGY X FlG 0.048 -0.003 0.059 -0.036 0.051 -0.112 -0.137 -0.166+ 0.129 -0.003 MGY X MOG -0.081 0.002 -0.093 0.042 -0.070 0.111 0.120 0.169+ -0.135 0.001 MGY X S17 -0.140 -0.114 0.005 -0.006 -0.093 0.115 -0.093 -0.098 0.060 0.055 MGY X S15 -0.107 -0.068 0.017 0.114 0.217++ -0.035 -0.096 -0.090 0.182+ -0.008 MGY X P13 0.106 0.009 -0.041 0.013 -0.018 -0.025 0.168+ 0.161+ -0.107 0.048 FCh/GC X DCh/GC 0.815++ 0.732++ 0.663++ 0.346++ 0.171+ 0.189 0.797++ 0.857++ 0.433++ 0.271+ FCh/GC X EmG 0.556++ 0.437++ 0.715++ 0.557++ -0.094 -0.002 0.078 0.732++ 0.124 -0.145 FCh/GC X FlG -0.025 -0.116 0.015 -0.125 0.033 -0.032 -0.234++ -0.097 0.000 0.027 FCh/GC X MOG 0.023 0.110 -0.046 0.133 -0.031 0.049 0.231++ 0.103 0.001 -0.030 FCh/GC X S17 -0.234+ -0.233+ -0.353++ -0.326++ -0.278++ -0.043 -0.214+ -0.392++ -0.170+ -0.040 FCh/GC X S15 -0.396++ -0.170+ -0.409++ -0.103 0.123 -0.086 -0.071 -0.470++ -0.102 0.110 FCh/GC X P13 0.351++ -0.006 0.223+ 0.116 0.070 0.074 0.005 0.069 0.043 -0.020 DCh/GC X EmG 0.603++ 0.521++ 0.542++ 0.475++ -0.087 0.039 0.015 0.686++ 0.120 0.292++ DCh/GC X FlG -0.059 -0.153 -0.027 -0.079 -0.016 -0.043 -0.205++ -0.111 -0.322++ 0.070 DCh/GC X MOG 0.077 0.152 0.004 0.084 0.019 0.036 0.188+ 0.113 0.321 -0.063 DCh/GC X S17 -0.255++ -0.280++ -0.182 -0.308++ -0.077 -0.021 -0.198++ -.273++ 0.025 0.112 DCh/GC X 15 -0.452++ -0.200+ -0.265++ -0.147+ -0.056 -0.022 -0.037 -0.463++ -0.287+ -0.034 DCh/GCX P13 0.347++ 0.008 0.052 0.116 0.069 0.027 0.041 -0.004 -0.109 -0.124 EmGX FlG -0.240++ 0.071 0.057 -0.060 0.166+ -0.071 -0.165+ -0.120 0.056 -0.110 EmG X MOG 0.256++ -0.072 -0.029 0.068 -0.169+ 0.090 0.169+ 0.122 -0.061 0.100 EmG X S17 -0.478++ -0.218++ -0.398++ -0.467++ -0.078 0.140 -0.194+ -0.493++ -0.132 0.075 EmG X S15 -0.515++ -0.523++ -0.468++ -0.154+ -0.089 -0.035 -0.252++ -0.635++ -0.282++ -0.029 EmG X P13 0.582++ 0.226++ 0.192+ 0.103 0.033 -0.080 -0.022 0.113 0.067 0.006 FlG X MOG -0.981++ -0.998++ -0.329++ -0.981++ -0.991++ -0.992++ -0.980++ -0.999++ -0.993++ -0.988++ FlG X S17 0.098 0.147+ -0.084 -0.084 0.189+ -0.141 0.310++ 0.158+ -0.266+ 0.091 FlG X S15 0.124 -0.128 -0.062 0.203++ 0.005 0.033 -0.022 0.184+ 0.174+ 0.120 FlG X P13 -0.098 0.013 0.119 -0.032 -0.135+ 0.123 -0.094 -0.061 0.166+ -0.055 MOG X S17 -0.096 -0.142 0.056 0.090 -0.186+ 0.138 -0.280++ -0.158+ 0.263++ -0.081 MOG X S15 -0.136 0.123 0.008 -0.192+ -0.005 -0.052 0.003 -0.178+ -0.166+ -0.105 MOG X P13 0.111 -0.014 0.001 0.018 0.133 -0.104 0.081 0.054 -0.174+ 0.036 S17 X S15 0.162+ 0.201+ 0.291++ 0.199+ 0.113 -0.359++ 0.191+ 0.255++ 0.067 0.269++ S17 X P13 -0.681++ -0.417++ -0.628++ -0.576++ -0.629++ -0.360++ -0.440++ -0.404++ -0.574++ -0.632++ S15 X P13 -0.682++ -0.578++ -0.553++ -0.573++ -0.676++ -0.676++ -0.527++ -0.418++ -0.537++ -0.625++
Table 3. Estimates of coefficients of environmental association (ra), in 10 traits of coffee Conilon, in five years at two locations, Sooretama and Marilândia, ES
Only the combinations C X EmG in Sooretama, in 2001 and FlG X S17 and MOG X S17 in Marilândia, in 2000, showed signs of different genetic and environmental association. The occurrence of the above within one year only for these combinations shows that indirect selection based on the significant coefficients of genotypic association, is not affected by the differential environmental effect on the traits involved. The absence of different signs between the significant genotypic and environmental associations indicates that the causes of genetic and environmental variations do not affect the traits due to different physiological mechanisms (Falconer and Mackay 1996).
In studies of genetic divergence and the processes of evaluation and selection, it is important to maintain traits little correlated with the majority of traits. In this study, analyzing the test of genotypic association, the number of days from main flowering to complete cherry maturity (C), mean grain yield (MGY) and ratio coffee cherry and green coffee (FCh/GC) were the traits that should be maintained in the selection, evaluation and the study of genetic divergence, since these were least correlated and the number of significant associations with other traits was zero and/or low.
No genetic association of yield was found with the number of days from main flowering to complete cherry maturity (C), ratio fresh cherry and green coffee (FCh/GC) and percentage of mocha grains (MOG), and with nearly no association with S17 and S13 either, with only one significant genetic association. Indirect selection based on any trait studied would therefore not result in adequate gains in grain yield.
The traits DCh/GC and EmG were most closely correlated with yield, and significant negative genetic associations were found. These associations were mainly observed in Sooretama, specifically for DCh/GC at this site. Unfilled grains (EmG) may be a result of genetic factors (plant architecture, number of orthotropic branches, arrangement of plagiotropic branches on the stem, and leaf area) and environmental factors (drought, heat, defoliation). These traits affect the grain yield, since they cause deficient grain formation and filling, increasing the DCh/GC ratio and, consequently, reducing the final product yield. Thus, the indirect selection of clones with a lower EmG percentage, an easily measured trait, could lead to better DCh/GC ratio, leading to higher weight yield at harvest, better quality and higher profits for producers.
The significant and positive genetic associations (Table 1) among the traits that induce large grains (S17 and S15) with those of flat grains (FlG) allow the indirect selection of genotypes that will produce a higher-quality coffee, meeting industry and market demands. And the genetic positive associations between S17 and S15 allow an efficient selection for larger grains, without the need of measurements for two traits, consequently reducing the demand for time, labor and costs.
One of the objectives of the breeding study with Conilon was the acquisition of early-cycle cultivars, whose maturation occur in the months March and April. In Sooretama this type of selection aimed at earliness requires caution, depending on the significant and negative genetic associations of C with EmG. The negative association between C and EmG is due to the fact that grain formation and filling occurs in the months of January and February, when rainfall is insufficient for the high water demand of the crop, aside from the high evapotranspiration caused by the high day as well as night temperatures.
Significant and high negative genetic associations were verified between FlG X MOG, P13 and S17 X S15 X P13. This can be explained by the complementarity of these traits, to reach 100% percent. The traits MOG and P13 can therefore be discarded in evaluations and studies of estimates of genetic divergence and selection. This study of the magnitude and significances of phenotypic, environmental and genotypic associations in Coffea canephora is not only a rarity for the species, but has important and useful aspects of trait associations and genetic and environmental effects. The results will be useful and aid breeders in improvement programs of Coffea canephora to study the genetic diversity and select superior genotypes more efficiently.
CONCLUSIONS
Genotypic are higher than phenotypic associations, demonstrating a greater influence of genetic than of environmental factors;
The signs of the significant genetic and environmental associations were equal indicating that the implementation of indirect selection based on the coefficients of significant genotypic association is not affected by the differential action of the environment on the traits involved;
The traits period in number of days from main flowering to full maturity (C), mean grain yield (MGY), ratio coffee cherry and green coffee (FCh/GC), empty grains (EmG), flat grains (FlG) and sieve 17 (S17) must be maintained in the selection, evaluation and even in future studies of genetic divergence;
Given the absence of significant and high associations of the other traits with grain yield, indirect selection based on any of these traits studied would
not provide satisfactory gains for grain yield.
ACKNOWLEDGEMENTS
The authors are indebted to the researchers Abraão Carlos, Verdin Filho and Paulo Sérgio Volpi and to the agricultural technician Paulo Henrique Tragino of the Instituto Capixaba de Pesquisa, Assistência Técnica e Extensão Rura (INCAPER).
Relação de características para fim de seleção direta e
indireta em café
RESUMO – Os objetivos deste trabalho foram verificar a possibilidade de proceder a seleção indireta para produtividade via seleção direta em nove características e determinar quais devem participar do processo de seleção. Em 40 genéticos de Café Conilon, foram analisados dados de dois experimentos, nas safras de 1996, 1998, 1999, 2000 e 2001, instalados em blocos ao acaso, com quatro e seis repetições. As significâncias das associações fenotípicas foram avaliadas pelo teste t e das genotípicas e ambientais por bootstrap. As associações genotípicas foram superiores às fenotípicas demonstrando influência predominante dos efeitos genotípicos aos ambientais na relação entre as características significativas, e ainda apresentaram sinais iguais indicando ausência de ação contrária entre os efeitos. As características ciclo , produção, relação café cereja/ beneficiado, grãos chochos, chatos e peneira 17 deverão ser mantidas na seleção, avaliação e estudos de divergência genética. A seleção indireta via qualquer caráter estudado não proporcionará ganhos adequados na produtividade de grãos.
Palavras-chave: Coffea canephora, melhoramento genético, bootstrap, testes de significância.
REFERENCES
C r u z C , R e g a z z i A J , a n d C a r n e i r o P C S ( 2 0 0 4 ) M o d e l o s
B i o m é t r i c o s A p l i c a d o s a o M e l h o r a m e n t o G e n é t i c o .
Editora UFV, Viçosa, 480 p.
Cruz CD (2006) Programa GENES: estatística
experimen-tal e matrizes. Editora UFV, Viçosa, 480p.
D h a l i w a l T S ( 1 9 6 8 ) C o r r e l a t i o n s b e t w e e n y i e l d a n d morphological characters in Puerto Rican and Columnaris varieties of Coffea arabica L. Journal of Agriculture of
University of Puerto Rico 52: 29-37.
Ecochard R and Ravelomanantsoa Y (1982) Genetic correlations derived from full-sib relationships in soybean (Glycine max Merr.). Theoretical and Applied Genetics 63: 9-15. F a l c o n e r D S a n d M a c k a y T F C ( 1 9 9 6 ) I n t r o d u c t i o n t o
quantitative genetics. Longman. New York, 464p.
Ferreira MAJF, Queiroz MA, Braz LT, and Vencovsky R (2003) Correlações genotípicas, fenotípicas e de ambiente entre dez características de melancia e suas implicações para o melho-ramento genético. Horticultura Brasileira 21: 438-442. Fonseca AFA (1999) Análises biométricas em café conilon (Coffea canephora Pierre). PhD Thesis, Universidade Fede-ral de Viçosa, Viçosa, 121p.
Kominakis AP (2003) Phenotypic correlations as substitutes to genetic correlations in dairy sheep and goats. Journal
Animal Breeding 120: 268-281.
Pandey RM (1981) Genetic associations in Amaranthus. Indian
Journal of Genetics e Plant Breeding 41: 78-83.
Resende MDV (2002) Genética biométrica e estatística no
melhoramento de plantas perenes. Embrapa
Informa-ção Tecnológica, Brasília, 975p.
Vencovsky R and Barriga P (1992) Genética biométrica no