HAL Id: hal-02003722
https://hal.archives-ouvertes.fr/hal-02003722
Submitted on 1 Feb 2019
HAL is a multi-disciplinary open access
archive for the deposit and dissemination of
sci-entific research documents, whether they are
pub-lished or not. The documents may come from
teaching and research institutions in France or
abroad, or from public or private research centers.
L’archive ouverte pluridisciplinaire HAL, est
destinée au dépôt et à la diffusion de documents
scientifiques de niveau recherche, publiés ou non,
émanant des établissements d’enseignement et de
recherche français ou étrangers, des laboratoires
publics ou privés.
Unsupervised Classification of Array Data Based on the
L1-Norm
Rubén Martín-Clemente, Vicente Zarzoso
To cite this version:
Rubén Martín-Clemente, Vicente Zarzoso. Unsupervised Classification of Array Data Based on the
L1-Norm. 52nd Asilomar Conference on Signals, Systems and Computers, Oct 2018, Pacific Grove,
CA, United States. �hal-02003722�
Unsupervised Classification of Array Data Based on
the L1-Norm
Rub´en Mart´ın-Clemente
Departamento de Teor´ıa de la Se˜nal y Comunicaciones Escuela Superior de Ingenier´ıa, Universidad de Sevilla
Avda. Descubrimientos s/n, 41092 Seville, Spain E-mail: [email protected]
Vicente Zarzoso
Universit´e Cˆote d’Azur, CNRS, I3S Laboratory Les Algorithmes, Euclide-B, 2000 route des Lucioles
06903 Sophia Antipolis Cedex, France E-mail: [email protected]
Abstract—L1-norm criteria have been the subject a flurry of research in signal processing and machine learning over the last decade, especially due to their ability to exploit the sparsity of latent variables and their robustness in the presence of faulty data. Among such criteria, L1-norm principal component analysis (L1-PCA) has drawn considerable attention, resulting in a variety of optimization algorithms and connections with other data processing techniques such as independent component analysis. The present contribution takes a step forward in the characterization of L1-PCA by exploring its linear discrimination capabilities. A variant of L1-PCA consisting of L1-norm max-imization subject to an L2-norm constraint is put forward for unsupervised classification. The discrimination properties of the proposed L1-PCA variant are demonstrated through a number of computer experiments.
I. INTRODUCTION
Data analysis techniques based on the L1 norm have be-come ubiquitous in signal processing and machine learning. Indeed, L1-norm costs arise as natural criteria for exploiting the underlying sparsity in many real-world problems and present increased robustness to faulty data as compared with traditional L2-norm based techniques such as second-order principal component analysis (L2-PCA) [1].
A remarkable L1-norm approach is L1-PCA [2], [3]. While behaving like L2-PCA in many situations, L1-PCA offers enhanced immunity against outliers as well as an interesting flexibility in analyzing data patterns. These advantages come at the expense of numerical complexity, as the absolute value is difficult to treat mathematically, making the optimization of L1-norm criteria more computationally demanding than that of traditional L2-norm criteria. To alleviate this difficulty, a number of optimal and suboptimal algorithms have been proposed for computing L1-PCA [2], [3], [4].
Although increasing complexity, the absolute value earity confers great potential to this technique. The nonlin-earity introduces higher-order statistics in the cost function, implying, in particular, that L1-PCA can perform independent component analysis (ICA) in a robust manner under rather general assumptions [5]. This finding opens interesting pos-sibilities for the use of L1-PCA in application scenarios for which it was not originally conceived, as the technique yields meaningful results under different underlying data models.
V. Zarzoso is a member of the Institut Universitaire de France.
Motivated by the flexibility of this technique, the present work investigates for the first time L1-PCA in a data classifica-tion framework. Tradiclassifica-tional L2-PCA has been used in unsuper-vised classification tasks, a fundamental data analysis problem. Unsupervised classification aims at allocating an observed fea-ture vector to one of different classes according to a decision rule based on some proximity criterion. In the fundamental two-class (or binary) case, projecting the observed samples in the direction that maximizes the projected data variance, i.e., applying L2-PCA, can perform unsupervised classification when the data form two well-separated clusters. As a prime example, the Eigenfaces method for face recognition is largely based on this property [6], [7]. Inspired by this result, we move forward in the characterization of L1-PCA by analyzing its discrimination capabilities. An L1-PCA variant is proposed that is able to carry out unsupervised classification, much like its L2-norm counterpart but with increased discrimination properties and robustness to outliers. These results are justified using intuitive arguments and supported by several numerical experiments.
II. PROBLEMFORMULATION
This section summarizes the main assumptions and math-ematical notations used throughout the paper. Then L2-PCA and L1-PCA are recalled, as well as the linear discrimination properties of the former. These inspire the search for analogous properties in L1-norm criteria.
A. Assumptions and Notations
The data analysis techniques considered in this paper as-sume the observation of N samples x1, x2, . . . , xN drawn
from a d-dimensional random variable x 2 Rd. For simplicity,
it is assumed that {xn}Nn=1 has zero sample mean. In the
sequel, we use the standard definitions of the L1-norm and the L2-norm, respectively, of an N-dimensional vector y 2 RN:
kyk1= N X n=1 |yn| kyk2= v u u t XN n=1 y2 n ! . (1)
Also, symbol (·)> denotes the matrix transpose operator and
diag(a1, a2, . . . , aK)the K⇥K diagonal matrix with diagonal
entries {ak}Kk=1.
B. L2-PCA
We first recall the traditional L2-PCA. Its goal is to find a direction a 2 Rd, kak
2= 1, such that the projected samples
yn= a>xn (2)
have maximum dispersion as measured by variance. This is also the linear projection best fitting the data in the least-squares sense [1]. By defining the vector of projected samples as y = [y1, y2, . . . , yN]>, the problem takes in practice the
following form: max kak2=1kyk 2= max kak2=1 N X n=1 a>xn 2 (3)
where we are using the sample variance instead of the pop-ulation variance to introduce the optimization criterion. By defining the d⇥N sample matrix as X = [x1, . . . , xN], we can
write y = X>a, and the above criterion accepts the equivalent
matrix formulation:
max
kak2=1kX >ak
2.
Simple algebra shows that this optimization problem is solved by the eigenvector associated with the largest eigenvalue of the data sample covariance matrix
Cx= XX>. (4)
C. L1-PCA
A major problem with the above technique is that the square in (3) tends to overemphasize large outliers and L2-PCA inherits this sensitivity to faulty data. To overcome this drawback, the square function can be replaced by the absolute value, as proposed in [2], thus yielding the following criterion:
max kak2=1kyk 1= max kak2=1 kX >ak 1. (5)
PCA based on criterion (5) is usually referred to as L1-norm based PCA or, simply, L1-PCA. The absolute value in eqn. (5) endows L1-PCA with an increased robustness to outliers as compared to L2-PCA.
The main difficulty with L1-PCA lies in the optimization of its cost function, which requires the development of specific algorithms. A cost-effective though suboptimal method is proposed by Kwak [2], who proves that the following fixed-point iteration: 1) y = X>a i 2) ai+1= X sign(y) kX sign(y)k2
where ai represents the update of a at the ith iteration,
monotonically increases the L1-norm criterion kyk1 after
each step, and so the algorithm converges at least to a local maximum. The most notable feature of this simple method is that no parameters need to be tuned. Alternatively, one can use the polynomial time approaches in [8], [9], [10]. L1-PCA algorithms with guaranteed convergence to a global maximum have also been proposed, although they come at the expense of increased computational complexity [3], [11]. In addition,
a simplified and faster, yet suboptimal, version of [3] can be found in [4].
D. Unsupervised Classification via L2-PCA
We now recall that L2-PCA can perform unsupervised classification or clustering in the two-class scenario when the clusters are well separated [6]. To see this, let us assume a binary data classification framework where each sample xn belongs to one of two possible classes Ck, k = 1, 2,
characterized by sample means (or centroids) and covariance matrices: µµµk= 1 Nk X xn2Ck xn Ck = 1 Nk X xn2Ck (xn µµµk)(xn µµµk)>.
L2-PCA searches for the dominant eigenvector of the overall data covariance matrix Cx (4). Under our working
assump-tions, this matrix can be expressed up to an irrelevant scale factor as: Cx= 2 X k=1 ⇡kCk+ ⇡1⇡2 µµµ µµµ>
where ⇡k = Nk/N and µµµ = (µµµ2 µµµ1) is the line
joining the class means. If the data dispersion in each class is negligible compared to the distance between the class means, i.e., kCkkFro ⌧ k µµµk2,where k · kFro denotes the Frobenius
norm, then we can approximate
Cx⇡ ⇡1⇡2 µµµ µµµ>.
Consequently, L2-PCA defines a projection in the direction µ
µ
µ joining the class centroids.
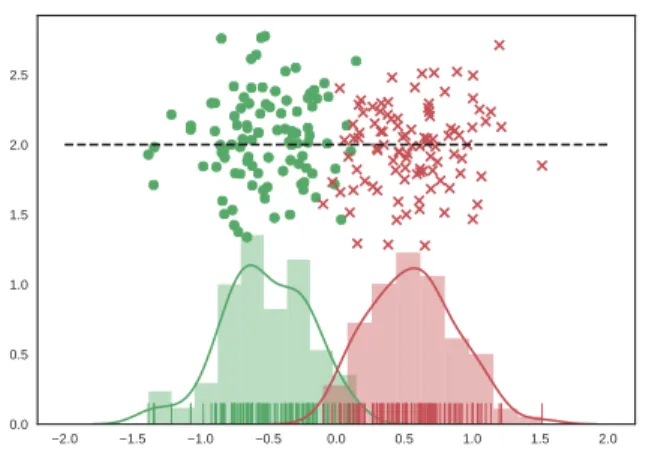
To illustrate why this direction may be useful for classi-fication, Figure 1 represents the scatter plot of a zero-mean synthetic data set with two clusters (‘green’ and ‘red’), as well as the data projections (2) along unit vector a in the direction of the line joining the cluster means. We can see that the projection yields mostly negative values for the green class and mostly positive for the red class, thus allowing cluster discrimination based on these values.
III. L1-NORMBASEDDISCRIMINATION
Pursuing these intuitive arguments, we can define an L1-PCA based criterion for unsupervised clustering as follows. A. Separating the Projected Class Centroids
In the specific case illustrated in Figure 1, we observe that the sign of the projection gives us clues about the class label: a data vector is most likely ‘red’ if its projection is positive, and ‘green’ otherwise. The better the classes are separated after the projection, the more accurate the estimation but, in any case, the sign allows us to eliminate any reference to the ‘colors’ or categories of the data points. This is therefore an unsupervised approach. Now, the L1 norm recalled in eqn. (1) is, by definition, the sum of the positively signed projections minus the sum of the negatively signed ones:
kyk1= N X n=1 |yn| = X yn>0 yn X yn<0 yn.
Fig. 1: Scatter plot of samples from two classes (‘green’ and ‘red’). The small vertical lines on the horizontal axis represent the sample projections onto the dashed line joining the class means Also shown are the histograms and kernel estimates of the densities of the projected data.
In a situation such as that depicted in Figure 1, we can think of this difference as an indicator of the distance between the projected clusters, so that the more separated the clusters, the larger the L1-norm. Therefore, maximizing criterion (5) appears as a promising option for classification. There is an additional interpretation: in many cases, the direction of maximum variance produces well separated clusters; this is why traditional PCA has discriminative properties as recalled in the previous section. Here, we simply reformulate this idea by substituting the variance with the L1-norm for measuring the spread of the data. It is implicitly assumed that the clusters are sufficiently distant in the original d-dimensional space, but this assumption is reasonable in many classification problems. In practice, however, it may not be sufficient to just search for a vector a such that the corresponding projections y in (2) have a large variance. It is for this reason that L2-PCA fails when the class dispersion is significant relative to the centroid distance, even if the clusters are linearly separable [7]. To pre-vent the overlapping between the projected clusters, the spread of the projections around their respective centroids should also be minimized, much like in classical linear discriminant analysis (LDA) [12].
B. Reducing the Projected Data Dispersion The scatter can be measured by 2
posand neg2 , defined as 2 pos= N1 pos X yn>0 (yn mpos)2 mpos=N1 pos X yn>0 yn 2 neg= N1 neg X yn<0 (yn mneg)2 mneg= N1 neg X yn<0 yn
where Npos and Nneg represent the number of positive and
negative projections, respectively, with Npos+ Nneg= N. The
weighted sum Npos pos2 + Nneg neg2 can be interpreted as an
estimate of the total spread of the projected data. Some algebra shows that 2 pos=N1 pos X yn>0 yn2 m2pos 2 neg= 1 Nneg X yn<0 y2 n m2neg.
For zero-mean data, it also holds that X
yn>0
yn =
X
yn<0
yn ) Nnegmneg= Nposmpos
and kyk1= N X n=1 |yn| = X yn>0 yn X yn<0 yn= 2Nposmpos.
Putting it all together, it can be shown that Npos 2pos+ Nneg 2neg=kyk22 µkyk21
where µ = N
4NposNneg > 0.
C. L1-norm Criterion for Unsupervised Classification As a result of the above developments, we can state that:
• To maximize the distance between the projected data
centroids, one should maximize kyk1.
• To minimize the dispersion around the projected data
centroids, one should maximize kyk1 while minimizing
kyk2 or at least keeping it constant.
Accordingly, the following Rayleigh quotient arises as a sen-sible criterion for unsupervised classification based on the L1 norm: max a J1(a) = kyk1 p kyk2 . (6)
The purpose of taking the square root of the L2 norm in the denominator of (6) is to ensure that the objective function is dimensionless and invariant to the scale of a, i.e., J1( a) =
J1(a), 2 R\{0}. This criterion is experimentally assessed
next.
IV. EXPERIMENTAL RESULTS
This section evaluates the performance of the proposed L1-norm criterion through several computer experiments. A. Discriminative Properties
The first experiment randomly draws N = 500 samples from a mixture of two equiprobable (⇡1 = ⇡2 = 0.5)
two-dimensional Gaussian distributions with means µµµ1= [2, 0]>
and µµµ2 = [2, 0]> and covariance matrices C1 = C2 =
diag(1, 3). Figure 2 depicts the proposed criterion J1(a),
defined in eqn. (6), as a function of the angle ✓ between the projection vector a and the x-axis (blue line). The curve attains its global maximum at approximately ✓ = 0 degrees, i.e., the optimal direction for this dataset is parallel to the horizontal axis. For completeness, Figure 2 also represents the
-150 -100 -50 0 50 100 150 0.65 0.7 0.75 0.8 0.85 0.9 0.95 1 θ (º)
Fig. 2: Proposed criterion J1(✓)defined in eqn. (6) (blue line)
for y = a>x with a = [cos(✓), sin(✓)]>, ✓ 2 [ ⇡, ⇡]. For
comparison, the L2-PCA objective function (3) is also depicted (black line). Both curves are normalized with respect to their maximum values.
variance of the projected data (black line), which corresponds to criterion (3) maximized by L2-PCA.
The scatter plot of the observations is given in Figure 3, where data of class 1 and class 2 are represented by circles and crosses, respectively. The blue line points in the direction max-imizing J1(a). As reported in the previous paragraph, observe
that this line is almost horizontal. Compare with the yellow line, which is the direction determined by classical LDA [12]: there is no significant difference between the projections cal-culated by the two methods, as both lines practically overlap. Finally, we point out that the black dashed line marked PCA in Figure 3 points in the direction of maximum variance of the data. Even though L2-PCA seems to yield an acceptable result, i.e., the projected data form clusters, this technique may have poor performance when the data dispersion is large compared to the distance between the class means. This is clearly illustrated by Figure 4, which shows the result obtained by repeating the experiment with class covariance matrices C1 = C2 = diag(1, 10), so that the direction of maximum
variance is now along the x2-axis. Obviously, projecting along
this axis does not produce well separated groups. By contrast, the proposed criterion is essentially unaffected by the change in experimental conditions.
B. Robustness Against Outliers
Outliers are samples generated by a different mechanism, or model, than the nominal observations. In this experiment, we replace 33% of the data in Figure 3 by outliers generated by raising a Gaussian random variable to the third power. The mean of the outliers in each class is set to that of the data they are replacing. Figure 5 represents the scatter plot of the corrupted dataset. The blue line again points in the direction maximizing the proposed criterion J1, while the
black line represents the direction of maximum variance of the data. The experiment shows that, as expected, the proposed L1-norm based method is more robust against outliers than
x 1 -4 -3 -2 -1 0 1 2 3 4 x 2 -4 -2 0 2 4 L2 LDA L1
Fig. 3: Performance of the proposed algorithm when applied to classes with almost spherical data point clouds. Results obtained by using L2-PCA and LDA are also shown for comparison. x 1 -4 -3 -2 -1 0 1 2 3 4 x 2 -4 -2 0 2 4 L2 LDA L1
Fig. 4: Performance of the proposed algorithm when applied to classes with non-spherical data point clouds. Results obtained by using L2-PCA and LDA are also shown for comparison.
L2-PCA. Figure 6 plots the estimated probability density function, computed by a kernel density estimator method, of the projection of the data onto the direction maximizing J1
(blue line of Figure 5). The distribution is clearly bimodal, showing that the sample arises from two different classes.
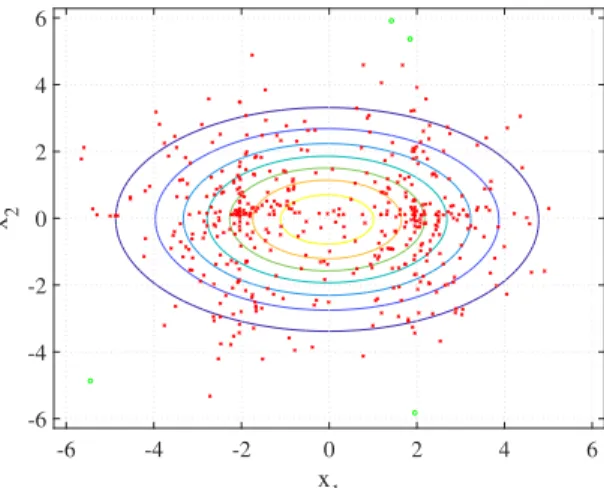
As a further experiment, we fit a Gaussian mixture model (GMM) to the corrupted data. GMMs are based on the assumption that all the observations are drawn from a mixture of normal distributions, and are very popular for solving unsupervised classification problems [13]. Roughly speaking, GMMs generalize the standard k-means clustering algorithm by incorporating information about the covariance structure of the data classes. In this experiment, the parameters of the model are found by using the Expectation-Maximization (EM) algorithm [13]. Figure 7 plots the data over the
es--10 -5 0 5 10 x 1 -10 -5 0 5 10 x 2 L1 L2
Fig. 5: Performance of the proposed algorithm and L2-PCA when applied to data corrupted by outliers.
-2 -1.5 -1 -0.5 0 0.5 1 1.5 2 y 0 0.05 0.1 0.15 0.2 0.25 0.3 0.35 0.4 f(y)
Fig. 6: Histogram of the projection of the corrupted data onto the optimal L1-norm based direction, shown by the blue line of Figure 5.
timated Gaussian mixture model contours. Observe that the EM algorithm models the dataset as a mixture of two almost-overlapped Gaussians with a priori probabilities ⇡1 = 0.94
and ⇡2= 0.06. After learning the GMM, a data point is
clas-sified according to the probability of having been generated by each of the Gaussians. Figure 7 also plots the predicted labels of the data points: data from class 1 are shown as green dots, while data from class 2 are shown as red crosses. The resulting classification is clearly erroneous and, in view of Figure 6, it can easily be outperformed by the proposed L1-PCA based approach.
V. CONCLUSIONS
The present contribution has framed L1-PCA in the context of data classification. An L1-PCA variant has been derived that can perform unsupervised linear discrimination in the two-class setting. The variant consists of the L1-norm of the vector of projected data samples normalized by the square root of its L2 norm, which can be cast as a Rayleigh quotient. Although the criterion has been derived on intuitive grounds, a number of
-6 -4 -2 0 2 4 6 x 1 -6 -4 -2 0 2 4 6 x 2
Fig. 7: Contour plot of the estimated Gaussian mixture model of the corrupted data. Tentative classification of the data points as suggested by this model is also shown, yielding highly inaccurate results.
computer experiments have confirmed its good discrimination capabilities and enhanced robustness to outliers as compared to classical L2-PCA. Further work should include a thorough theoretical study and a comparative performance analysis on real data.
REFERENCES
[1] I. T. Jolliffe, Principal Component Analysis. New York: Springer, 2nd ed., 2002.
[2] N. Kwak, “Principal component analysis based on L1-norm maximiza-tion,” IEEE Transactions on Pattern Analysis and Machine Intelligence, vol. 30, pp. 1672–1680, Sept. 2008.
[3] P. P. Markopoulos, G. N. Karystinos, and D. A. Pados, “Optimal algorithms for L1-subspace signal processing,” IEEE Transactions on Signal Processing, vol. 62, pp. 5046–5058, July 2014.
[4] P. P. Markopoulos, S. Kundu, S. Chamadia, and D. A. Pados, “Efficient L1-norm principal-component analysis via bit flipping,” IEEE Transac-tions on Signal Processing, vol. 65, pp. 4252–4264, Aug. 2017. [5] R. Mart´ın-Clemente and V. Zarzoso, “On the link between L1-PCA and
ICA,” IEEE Transactions on Pattern Analysis and Machine Intelligence, vol. 39, pp. 515–528, Mar. 2017.
[6] M. Turk and A. Pentland, “Eigenfaces for recognition,” Journal of Cognitive Neuroscience, vol. 3, pp. 71–86, 1991.
[7] A. M. Martinez and A. C. Kak, “PCA versus LDA,” IEEE Transactions on Pattern Analysis and Machine Intelligence, vol. 23, pp. 228–223, Feb. 2001.
[8] K. Allemand, K. Fukuda, T. M. Liebling, and E. Steiner, “A polynomial case of unconstrained zero-one quadratic optimization,” Mathematical Programming, Series B, vol. A, pp. 49–52, Oct. 2001.
[9] W. Ben-Ameur and J. Neto, “A polynomial-time recursive algorithm for some unconstrained quadratic optimization problems,” in Discrete Applied Mathematics, vol. 159, pp. 1689–1698, Sept. 2011.
[10] J. A. Ferrez, K. Fukuda, and T. M. Liebling, “Solving the fixed rank convex quadratic maximization in binary variables by a parallel zonotope construction algorithm,” European Journal of Operational Research, vol. 166, pp. 35–50, 2005.
[11] G. N. Karystinos and A. P. Liavas, “Efficient computation of the binary vector that maximizes a rank-deficient quadratic form,” IEEE Transactions on Information Theory, vol. 56, pp. 3581–3593, July 2010. [12] R. A. Fisher, “The use of multiple measures in taxonomic problems,”
Annals of Eugenics, vol. 7, no. 2, pp. 179–186, 1936.
[13] C. M. Bishop, Pattern Recognition and Machine Learning. Springer-Verlag New York, 2006.
![Fig. 2: Proposed criterion J 1 (✓) defined in eqn. (6) (blue line) for y = a > x with a = [cos(✓), sin(✓)] > , ✓ 2 [ ⇡, ⇡]](https://thumb-eu.123doks.com/thumbv2/123doknet/13640849.427392/5.918.495.819.71.324/fig-proposed-criterion-defined-eqn-blue-line-cos.webp)