Publisher’s version / Version de l'éditeur:
Vous avez des questions? Nous pouvons vous aider. Pour communiquer directement avec un auteur, consultez la première page de la revue dans laquelle son article a été publié afin de trouver ses coordonnées. Si vous n’arrivez pas à les repérer, communiquez avec nous à PublicationsArchive-ArchivesPublications@nrc-cnrc.gc.ca.
Questions? Contact the NRC Publications Archive team at
PublicationsArchive-ArchivesPublications@nrc-cnrc.gc.ca. If you wish to email the authors directly, please see the first page of the publication for their contact information.
https://publications-cnrc.canada.ca/fra/droits
L’accès à ce site Web et l’utilisation de son contenu sont assujettis aux conditions présentées dans le site
LISEZ CES CONDITIONS ATTENTIVEMENT AVANT D’UTILISER CE SITE WEB.
The 3rd NRC Symposium on Computational Fluid Dynamics, High Performance
Computing and Virtual Reality [Proceedings], pp. 1-8, 2003-12-01
READ THESE TERMS AND CONDITIONS CAREFULLY BEFORE USING THIS WEBSITE. https://nrc-publications.canada.ca/eng/copyright
NRC Publications Archive Record / Notice des Archives des publications du CNRC :
https://nrc-publications.canada.ca/eng/view/object/?id=e8798298-114f-432d-a52e-ea77df32b074 https://publications-cnrc.canada.ca/fra/voir/objet/?id=e8798298-114f-432d-a52e-ea77df32b074
Archives des publications du CNRC
This publication could be one of several versions: author’s original, accepted manuscript or the publisher’s version. / La version de cette publication peut être l’une des suivantes : la version prépublication de l’auteur, la version acceptée du manuscrit ou la version de l’éditeur.
Access and use of this website and the material on it are subject to the Terms and Conditions set forth at
Parametric study on the ventilation configuration for a section of a
tunnel in the event of a fire
Parametric study on the ventilation configuration for a
section of a tunnel in the event of a fire
Bounagui, A.; Kashef, A.; Bénichou, N.
NRCC-46740
A version of this document is published in / Une version de ce document se trouve dans :
3
rdNRC Symposium on Computational Fluid Dynamics, High Performance Computing
and Virtual Reality, Ottawa, Dec. 2003, pp. 1-8
Parametric study on the ventilation configuration for a section of a tunnel
in the event of a fire
A. Bounagui, A. Kashef, and N. Benichou Fire Risk Management Program, Institute for Research in Construction National Research Council of Canada
ABSTRACT
To evaluate the in-place emergency ventilation strategies of an existing road tunnel, CFD simulations have been carried out for a number of fire scenarios. The objective of these simulations is to gain insight into the effect of different ventilation configurations on fire-induced flows and conditions in the tunnel, on the fire growth, thermal condition and species concentrations at different locations in the tunnel. To conduct these simulations, only one section of the tunnel was simulated to optimize the cost of computations.
The CFD simulations indicated that when the side upper supply vents are open, higher temperatures
and CO2 concentrations are observed in the
evacuation path. In the roadway area, a smoke back-layering phenomenon was observed which may delay the removal of combustion gases and heat. In addition, a higher temperature was estimated at a height of 1.5 m compared to other scenarios. It was concluded that the opening of the upper supply vents delayed smoke removal and, consequently, increased hazardous situations in both the roadway and escape paths.
Keywords: Tunnel section; smoke backlayering; tunnel fire; large eddy simulation
1 INTRODUCTION
The L.-H.-La Fontaine tunnel, located in Montreal, has a mechanical ventilation system (MVS). In the event of a fire, the MVS is used to ensure the safety of the tunnel users and emergency responders. In case of a fire in the tunnel, the operators must activate a smoke management system, which keeps the road upstream of the accident a smoke free area and prevent backlayering (smoke moving in the opposite direction to the exhaust system). This is done by keeping smoke from moving upstream and either venting it or letting it escape through the
downstream portal. When the fire department arrives on the fire scene, the operators must cooperate and modify, as needed, the smoke management system in order to facilitate access to fire. At present, the standard tunnel emergency ventilation procedures are based on the experience of operators. Recently, the operating instructions were revised and formalized according to the total capacity of the MVS in venting the tunnel. However, a scientific-based validation of these operation instructions is essential.
The tunnel air supply is via openings distributed along the side wall. These openings have adjustable dampers to ensure the uniformity of air distribution. They are at present completely open. It is necessary, within the framework of this study, to validate this state of opening or to propose an adjustment, compatible with the operating instructions, and optimizing the capacities of the MVS.
CFD numerical techniques were used to conduct a parametric study. The objective is to investigate the effects of ventilation configurations on the fire development, thermal conditions and species concentrations in the tunnel.
This paper presents the parametric study that was performed to study the influence of different ventilation configurations on fire-induced flows and conditions in a selected section of the tunnel.
2 CFD FIRE MODEL
Fire Dynamics Simulator (FDS) is a CFD fire model using large eddy simulation (LES) techniques [1] that was developed by NIST (National Institute of Standards and Technology). FDS has been demonstrated to predict thermal conditions resulting from a fire in an enclosure [1, 2]. The CFD fire model computes the gas density, velocity, temperature, pressure and species concentrations in each control volume based on the conservation laws of mass, momentum, and energy.
Smokeview is a visualization program that was developed to display the results of an FDS model simulation. Smokeview produces animations or snapshots of FDS results [2].
2.1 FDS setup and boundary conditions
FDS requires as inputs the geometry of the tunnel being modelled, the computational cell size, the location of the ignition source, fuel type, and heat release rate, the material thermal properties of walls, and the boundary conditions.
2.2 Geometry
The L.-H.-La Fontaine tunnel, built in 1964, consists of a 1.8 km long underwater gallery in a North-South direction. The public traveller circulates on six laneways inside two concrete tubes, which are separated by a centre section. Two ventilation towers are located at the ends of the tunnel. The North tower contains a control centre that monitors the tunnel operation.
The tunnel emergency ventilation system is composed of 8 ceiling exhaust fans (4 fans for each
roadway VE-151 through VE-254 ) and 8 fans (VA-101 through VA-204) that supply air through side vents uniformly distributed along one wall for each roadway in two rows. The lower and upper side vents are located at heights of 1.0 and 3.9 m respectively above the tunnel floor at intervals of approximately 6 m.
All fans can operate in a reverse mode. Therefore, fresh air may be supplied at either the ceiling using fans VE-151 through VE-254, or by fans VA-101 through VA-204 through the side vents. Figure 1 and Figure 2 show the general layout of the tunnel and the emergency ventilation system. A detailed description of the tunnel is provided in reference [3]. For this study, only one section of the North roadway was simulated. A sensitivity study has shown that a 300 m long section of the tunnel was sufficient to investigate the ventilation configurations [4]. The section is 300 m long, 16.2 m wide and 4.9 high. The roadway is 12.8 m wide. A 0.1 m thick concrete wall separates the roadway area from the escape area. A perspective view of the modelled section is shown in Figure 3.
Figure 1: General Layout of the tunnel
1 0 7 5 ’ ( 3 2 7 .7 m ) 2 3 0 0 ’ (7 0 1 .0 m ) 11 8 6 ’ ( 3 6 1 .5 m ) G ra d e Slo pe: -4 .5 % (10 5 cfm /lane ) +4 .5 % (15 3.5 cfm/la ne ) G ra de S lo p e : +4 .5% (1 05 c f m ) /la ne -4 .5 % (1 0 5 c fm /la n e ) G ra de Sl o p e : +0 .2 5 % ( 1 0 5 c fm /la n e ) -0 .2 5 % ( 1 0 5 c f m /la n e) S O U T H N O R T H 4 2 ’ ( 12 .8 m ) 11 ’ ( 3 .4 m ) 11 ’ ( 3 .4 m ) 4 2 ’ (12 .8 m ) 1 6 ’ (4. 9 m ) T u n n e l L .-H .- L A F o n t a in e V A - 1 0 1 V A - 1 0 3 V A -2 0 1 V A -2 0 3 V A - 1 0 2 V A - 1 0 4 V A -2 0 2 V A -2 0 4 V E - 1 5 1 V E - 1 5 2 V E - 1 5 3 V E - 1 5 4 V E - 2 5 1 V E - 2 5 2 V E - 2 5 3 V E - 2 5 4 Section modelled
Figure 3: Perspective view of the tunnel section
2.3 Boundary conditions
Two rows of supply air vents were located in the concrete wall that separates the roadway from the escape area. The typical dimensions of the lower and upper vents are 1.04 m x 0.52 m and 1.4 m x 0.52 m, respectively.
Fresh air was supplied by fan VA-103 through the side vents and combustion products were exhausted by fan VE-153. Both fans were simulated as volumetric airflow introduced or extracted at the end of the section. Therefore, at the end of the roadway
area, a volume flow rate Vt of 230 m3/s was
exhausted and, at the end of the escape area, a
volume flow rate Ve of 230 m3/s was supplied. The
ambient temperature was 20°C. The other end of the studied tunnel section was modelled as open boundary conditions.
2.4 Fire specification
For all simulations, a propane pool fire with a heat release rate of 15000 kW was used to represent a
vehicle fire. The fire area was 3 m2, 0.5 m above the
tunnel floor and located in the middle of the tunnel section.
2.5 Material properties
The ceiling, walls, and floor of the tunnel were made of concrete with the following thermal properties: Thermal Conductivity: 1.0 W/m.K
Thermal Diffusivity: 5.7x10⁻⁷ m2/s Thickness: 0.1 m
3 PARAMETRIC STUDY
In case of a fire in the tunnel, the environment is modified greatly inside the tunnel. Several parameters affect the temperature level and smoke behaviour including: the volumetric flow rate, opening conditions of the side vents, fire size and location, and traffic pattern. The following sections will investigate the first two effects.
3.1 Influence of volumetric flow rate
To study the influence of the volume flow rate on the thermal distribution and species concentrations, CFD simulations were carried out for different volumetric flow rates (Table 1). The fire was located in the middle of the tunnel and both upper and lower side vents were modelled open.
Maximum Temperature (°C)
Cases Volume flow
rate m3/s Roadway Escape Area Case 1 Vt = Ve = 115 1083 175 Case 2 Vt = Ve = 230 1237 178 Case 3 Vt = Ve = 345 1220 109 Case 4 Vt = 230 Ve = 115 1195 176 Case 5 Vt = 115 Ve = 230 1190 188 Table 1: Volume flow rate and maximum temperatures
where:
Vt : volume flow rate in the roadway
Ve: volume flow rate in the escape area
Figure 4 shows the maximum temperatures in the roadway area at different locations and for different volume flow rates. The extension of the area of high temperature decreases when the volume flow rate
increases. Figure 5 shows the maximum CO2
concentrations for different sections and for different volume flow rates. The length of the high
CO2 concentrations zone decreases when the volume
flow rate increases. With a higher volume flow rate, there is increased removal of combustion gases.
Section position (m) 0 50 100 150 200 250 300 350 Temp eratur e (°C ) 0 200 400 600 800 1000 1200 1400 Ve = Vt = 115 m3/s Ve = Vt = 230 m3/s Ve = Vt = 345 m3/s
Figure 4: Maximum temperatures for different volume flow rate in the roadway
Section position (m) 0 50 100 150 200 250 300 350 CO 2 co ncentrati on (m ol/m ol) 0.00 0.02 0.04 0.06 0.08 0.10 0.12 0.14 Ve = Vt = 115 m3/s Ve = Vt = 230 m3/s Ve = Vt = 345 m3/s
Figure 5: Maximum CO2 concentration for
different volume flow rates in the roadway
Figure 6 and Figure 7 show the maximum
temperatures and CO2 concentrations in the escape
area at different locations along the tunnel section length and for two volumetric flow rates. The
maximum temperature and CO2 concentration are
lower for the case with the higher volume flow rate in the escape area. This can be attributed to the turbulence flow in the roadway which is caused by the high volume flow rate coming from the escape area. As a result, the backlayering occurred and the hot gases and heat were transferred to the escape path.
From Figure 4 to Figure 7, a similar trend was
observed for the temperature and CO2
concentrations at different section throughout the roadway and the escape path.
Section position in the escap area
50 100 150 200 250 300 350 T e mper ature (°C) 0 20 40 60 80 100 120 140 160 180 200 Ve = 230 Vt = 115 m3/s Ve = 115 Vt = 230 m3/s
Figure 6: Maximum temperature for different volume flow rate in the escape path
Section position in the escape area (m)
50 100 150 200 250 300 350 CO 2 Co ncent rat ion (mol /m ol) 0.000 0.002 0.004 0.006 0.008 0.010 0.012 0.014 0.016 0.018 Ve = 230 Vt = 115 m3/s Ve = 115 Vt = 230 m3/s
Figure 7: Maximum CO2 concentrations for
different volume flow rate in the escape path
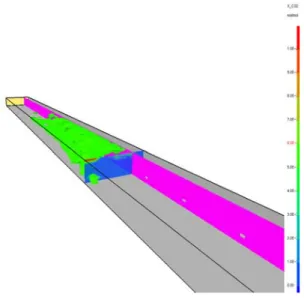
Figure 8 to Figure 11 show temperature and CO2
concentration iso-surfaces for Cases 1 and 2. The results indicate that the backlayering occurred and the smoke layer covers a longer area when the flow rate in the roadway is low.
Figure 8: Iso-surface for temperature at 120°C -
Figure 9: Iso-surface for temperature at 120°C -
Vt=Ve=115 m3/s
Figure 10: Iso-surface for CO2 concentration at
0.005 mol/mol - Vt=Ve=345 m3/s
Figure 11: Iso-surface for CO2 concentrations at
0.005 mol/mol - Vt=Ve=115 m3/s
3.2 Influence of the wall vents
To study the influence of the wall vents on the estimated temperatures and species concentration, simulations were conducted for different side vent scenarios (Table 2). The values of the volumetric
flow rate Ve and Vt are 230 m3/s. The measurements
were taken at height of 1.5 m. The height of 1.5 m
was chosen to indicate the effect on occupants in the roadway and the escape route.
Maximum Temperature (°C) Cases Description
Traffic
Area Escape Area
Case 1 Upper vents
closed lower vents open
1345 96
Case 2 Upper vents
open lower vents closed
1112 190
Case 3 Upper and
lower vents closed
1143 75
Case 4 Upper and
lower vents open
1237 178
Table 2: Case descriptions
Figure 12 and Figure 13 show the maximum
temperature and CO2 concentrations, respectively, in
the escape path for different positions in the section of the tunnel and different vent scenarios. The maximum temperature decreases for the upper vents
closed case by 100 °C. The maximum CO2
concentrations are 3 times lower for the upper vents closed case than the case with both vents open. This can be attributed to the fact that the buoyant hot smoke is restricted to enter the escape route at the upper vents (for Cases 1 and 3).
Case 3 shows an increase in temperature above the ambient conditions although both vents are closed. This can be attributed to the conduction effect from the concrete to the escape route.
Section position (m) 50 100 150 200 250 300 350 Te mper ature ( °C) 0 20 40 60 80 100 120 140 160 180 200
Both vents closed Lower vents closed Upper vents closed Both vents open
Figure 12: Maximum temperatures for different vent scenarios in the escape path
Section position (m) 50 100 150 200 250 300 350 CO 2 c on centration (m ol /mol ) 0.000 0.002 0.004 0.006 0.008 0.010 0.012 0.014 0.016
Lower vents closed Upper vents closed Both vents open
Figure 13: Maximum CO2 concentration for
different vent scenarios in the escape path
Figure 14 shows the maximum temperature in the roadway at a height of 1.5 m for two vent scenarios (Case 1 and Case 4). The maximum temperature is lower by 200°C for Case 1 than for Case 4. This is due to the fact that the flow from the upper vents introduces turbulence into the tunnel traffic area thus, forcing the hot smoke to move down and delaying its removal.
Figure 15 shows no impact on the CO2
concentration in the traffic area for the different vent scenarios when considering only maximum values.
Section position (m) 80 100 120 140 160 180 200 220 240 260 Tem p erature (°C) 0 200 400 600 800 1000 1200
Upper vents closed Both vents open
Figure 14: Maximum temperatures in the roadway at a height of 1.5 m Section position (m) 80 100 120 140 160 180 200 220 240 260 CO 2 conc ent ration (mol/ m ol) 0.00 0.02 0.04 0.06 0.08 0.10 0.12 0.14
Both vents closed Lower vents closed Upper vents closed Both vents open
Figure 15: Maximum CO2 concentrations in the
roadway at a height of 1.5 m
Figure 16 to Figure 23 show the iso-surface for the
temperature and CO2 concentration for the four
scenarios. From Figure 16, Figure 17, Figure 20 and
Figure 21, there is some effect on CO2 and
temperature removal. However, the better removal of smoke and heat was observed in Case 1 and Case 3 as can be seen in Figure 18, Figure 19, Figure 22, and Figure 23.
Figure 16: Iso-surface for temperature at 80°C both side vents open
Figure 17: Iso-surface CO2 concentrations at
0.006 (mol/mol) both side vents open
A backlayering of the smoke movement was not observed for Case 3 when both side vents were closed (Figure 19). The smoke moves toward the exit.
Figure 18: Iso-surface for temperature at 80°C both side vents closed
Figure 19: Iso-surface for CO2 concentrations at
0.006 (mol/mol) both side vents closed
For Case 4 with both side vents open and Case 2 with lower side vents closed, the hot smoke from the fire spreads symmetrically along the tunnel (Figure
17 and Figure 21). The smoke layer covers a long
distance in the tunnel.
Figure 20: Iso-surface of temperature at 80°C lower vents closed
Figure 21: iso-surface CO2 concentrations at
0.006 (mol/mol) lower side vents closed
Figure 22: Iso-surface of the temperature at 80°C upper side vents closed
The backlayering of the smoke was observed over a small distance for the case when the upper side vents were closed (Cases 1 and 3) and the smoke moves
toward the exit (Figure 19 and Figure 22). With the
upper side vents open, the air introduced into the traffic area forced the smoke and hot gases downwards to the tunnel floor (Figure 24) which will delay the extraction of the smoke. Thus, the backlayering of the smoke occurs when the upper
side vents are open (Figure 16, Figure 17, Figure 20
and Figure 21). When only the lower vents are open,
minimal disturbance of the tunnel flow occurred. This led to the effective removal of hot gases and
smoke.
Figure 23: Iso-surface for CO2 concentrations at
0.006 (mol/mol) upper side vents closed
Figure 24: Velocity U profile for the upper vent near the fire area
4 CONCLUSION
A CFD model, FDS, was used to perform a parametric study on different ventilation configurations for a section of the L. –H. La Fontaine tunnel.
Simulations with five ventilation rates were performed to determine the effect on temperature
and CO2 concentration in the tunnel section. The
area of high temperature decreased in size when the ventilation rate was higher as the heat was rapidly extracted and the smoke spread was controlled. Four ventilation scenarios were simulated to determine the effect of the side vents on fire behaviour. When the upper vents were left open, the smoke and hot gases traversed through the upper vents from the roadway to the escape area causing
higher temperature and CO2 concentrations in the
escape route. Moreover in the traffic area, a high temperature was detected at a height of 1.5 m and the smoke backlayering occurred. It was also observed that the air introduced into the roadway from the upper side vents forced the smoke and hot gases downwards to the tunnel floor.
REFERENCES
1. McGrattan, Kevin B., Baum, Howard R., Rehm, Ronald G., Hamins, Anthony, Forney, Glenn P., (2000), “Fire Dynamics Simulator – Technical Reference Guide”, National Institute of Standards and Technology, Gaithersburg, MD., NISTIR 6467, January.
2. McGrattan, Kevin B., Forney, Glenn P., (2000), “Fire Dynamics Simulator – User’s Manual”, National Institute of Standards and Technology, Gaithersburg, MD., NISTIR 6469, January. 3. A. Kashef, N. Benichou, G. Lougheed and A.
Debs. (2003), “Numerical Modelling of Air Movement in Road Tunnels” Proceedings of the
11th Annual Conference of the CFD Society of
Canada” p. 23-30.
4. A. Bounagui, A. Kashef, N. Benichou, (2003), “ Simulation of the dynamics of the fire for a section of the L. H. –La Fontaine Tunnel” Research Report, Institute for Research in Construction, National Research Council Canada,(IRC-RR-140) September 22, 2003.