HAL Id: halshs-00358057
https://halshs.archives-ouvertes.fr/halshs-00358057
Submitted on 9 Feb 2009HAL is a multi-disciplinary open access archive for the deposit and dissemination of sci-entific research documents, whether they are pub-lished or not. The documents may come from teaching and research institutions in France or abroad, or from public or private research centers.
L’archive ouverte pluridisciplinaire HAL, est destinée au dépôt et à la diffusion de documents scientifiques de niveau recherche, publiés ou non, émanant des établissements d’enseignement et de recherche français ou étrangers, des laboratoires publics ou privés.
Vincent Herbreteau, Florent Demoraes, Jean-Pierre Hugot, Pattamaporn
Kittayapong, Gérard Salem, Marc Souris, Jean-Paul Gonzalez
To cite this version:
Vincent Herbreteau, Florent Demoraes, Jean-Pierre Hugot, Pattamaporn Kittayapong, Gérard Salem, et al.. Perspectives on Applied Spatial Analysis to Animal Health: a Case of Rodents in Thailand. Annals of the New York Academy of Sciences, Wiley, 2006, pp.17-29. �10.1196/annals.1373.002�. �halshs-00358057�
Perspectives on Applied Spatial Analysis to Animal
Health
A Case of Rodents in Thailand
VINCENT HERBRETEAU,a,b FLORENT DEMORAES,a,b JEAN-PIERRE HUGOT,b,c PATTAMAPORN KITTAYAPONG,a GERARD SALEM,b,d MARC SOURIS,a,b AND JEAN-PAUL GONZALEZb
a Center for Vectors and Vector-borne Diseases (CVVD), Faculty of Sciences, Mahidol University, Bangkok 10400, Thailand
b Institut de Recherche pour le Développement (IRD), Research Unit UT178, RCEVD/CVD, Mahidol
University, Nakhon Pathom 73170, Thailand
c Muséum National d’Histoire Naturelle de Paris, Département Systématique et Evolution, UMR 5202 Origin, Structure and Evolution of Biodiversity, 75231 Paris Cedex 05, France
d Laboratoire Espace, Santé, Territoire, Université Paris-X, Nanterre, 92000 Nanterre, France
ABSTRACT: Geographic information systems (GIS) and remote sensing have been increasingly used in
ecology and epidemiology, providing a spatial approach for animal health issues. Recent development of earth environmental satellites—i.e., their growing number, improving sensor resolutions and capabilities— has offered new opportunities to delineate possible habitats and understand animals and associated parasites in their environment, by identifying the nature and structure of land use, hydrological network, soil hydromorphy, and human settlements. Integrated into GIS, remotely sensed and other geo-referenced data allow both spatial and temporal analyses of animal ecology and health. However, a review of their applications has showed the poor quality of data sources and processing used, revealing limitations between theory and practical implementations. As an example, the assessment of the expected distribution of Bandicoot rats, main agricultural pest and vector of zoonoses in Phrae province (North Thailand), illustrates a rational use of spatial analysis, with the choice of relevant data, scales, and processing. Vegetation indices are computed on a TERRA ASTER image and further classified using elevation data. The biotopes of Bandicota indica and Bandicota savilei are delimited, providing a major source of knowledge for rodent and human health analyses.
Address for correspondence: Vincent Herbreteau, PhD candidate in Health Geography, Master of Engineering in GIS and Remote Sensing, IRD-UT178, Center for Vectors and Vector-borne Diseases, Faculty of Sciences, Mahidol University, Thanon Rama VI, Phyathai, Bangkok 10400, Thailand.Voice: 66-24410227; fax: 66-24410227. e-mail: Vincent.Herbreteau@ird.fr
KEYWORDS: geographic information systems; remote sensing; spatial analysis; rodents;
biogeography; Bandicoot; Bandicota indica; Bandicota savilei; NDVI; SAVI; ASTER
INTRODUCTION
With an increasing access to a large variety of location-based data, including animal and animal health information, spatial analysis has emerged as a major method for describing and understanding diseases dynamics and risk of transmission. 1 The aims of spatial analysis are: (a)
the epidemiological surveillance, with disease mapping of reported incidences, and further active surveillance, involving collection of animal health and animal population information; (b) the explanatory understanding of animal population and diseases dynamics, by identifying patterns in the spatio-temporal distribution of diseases and identifying risk factors or causes of the diseases (etiology), and (c) the disease prevention, by predicting outbreaks and assisting in decision making. Spatial analysis is conducted through a geographic information system (GIS), used as the central interface to integrate, manage, and process data.2,3 A current trend is to combine
other available tools, such as remote sensing (RS), with GIS software, in order to implement efficient computer-based systems for spatial analysis. Most of the researches in health involving space technologies have been dedicated to human health. The few applications using RS in animal health were mainly studies of Blutetongue,4–6 African horse sickness,7 bovine tuberculosis, 8,9 Eastern equine encephalomyelitis virus,10,11 and assessment of mosquitoes abundance.12
Rare applications on rodent-borne diseases have been published.13 The ecological approach of
vectors has been the most direct contribution ofRSto health studies, used in96%of past researches.14 Location-based data set usually gathers environmental variables, such as climate,
RS from aerial pictures or satellite images, of which a large choice has been made available. However, an almost exhaustive review of the use of RS in health over the last 25 years has shown the gap between the theory and arguments of RS professionals and the limited use of these techniques in health, and especially epidemiology.14 Most studies are based on the
low-resolution images chosen, because they are free of charge or available at a low cost and not for their relevance regarding the objectives of the study. Considering that the choice of scales in health geography is a fundamental issue to understand diseases dynamics, being limited to the resolutions of the image is obviously a major weakness, though rarely mentioned. The second outcome of this article highlighted the limited processes performed on images; 49% of the studies used the normalized difference vegetation index (NDVI).14 In addition, in most of these cases,
authors rarely processed NDVI by themselves despite the simplicity of the calculation; they acquired already processed NDVI from National Oceanographic and Atmospheric Administration images that have been made available through the Internet. A conclusion of this review about RS in health is that the price of data has been the limiting factor to the relevance of such studies. After reviewing the applications of spatial analysis to health and emphasizing their limits, this article aims to provide a descriptive and relevant example making use of RS for vector-borne diseases. It consists in assessing the potential distribution of a genus of common rodents in Thailand, Bandicota, which is a major vector of zoonoses. Three Bandicota species are described from India to South East Asia: Bandicota indica (Bechstein, 1800), the great bandicoot, Bandicota savilei (Thomas, 1916), the lesser bandicoot, and Bandicota bengalensis (Gray and Hardwicke, 1804), the Bengal bandicoot. Only the first two occur in Thailand, in different ecosystems. B. indica has been designated as the main vector of leptospirosis,15,16 but both of them are
suspected to be the vectors of other zoonoses, especially Scrub typhus and hantaviruses. An explanatory approach of rodent distributionwas used to identify potential indicators of presence, later compared with field sampling data and ecological observations (FIG. 1). B. indica is the largest murine rodent occurring in South East Asia, common in agricultural areas, particularly in rice fields, possibly close to houses and often wetlands.17–19 Villagers regularly hunt B. indica for
meat or to protect cultivations, and have always shown great knowledge of its ecology during interviews. B. savilei is a medium-sized rat, living in agricultural but dry areas,which is a major point of distinction between the two species.19 Despite rare notifications of B. savilei during
trapping in Thailand, it has shown great adaptation to agricultural changes, with populations rapidly colonizing and damaging corn fields.
MATERIALS AND METHODS
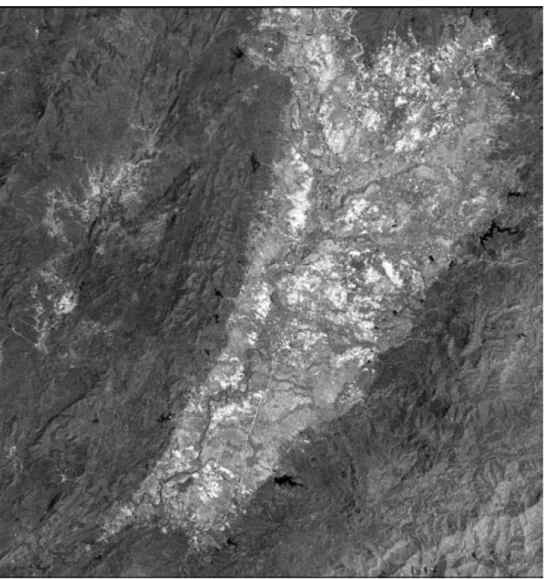
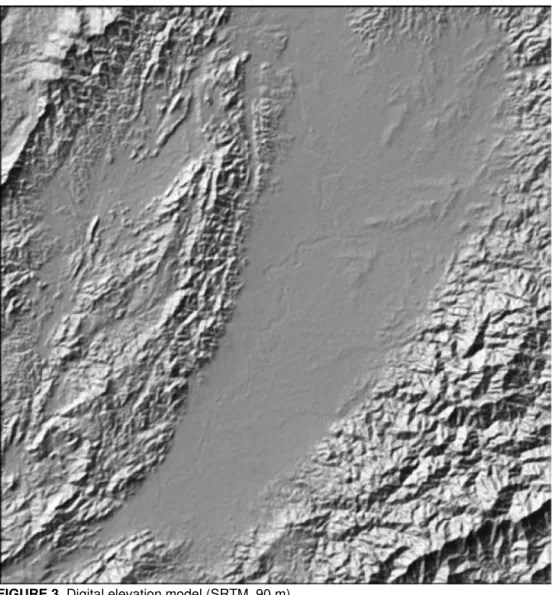
Since 1998, rodent surveys have been conducted in Phrae province and other Thai regions, in the frame of a research on rodent-borne zoonoses (IRD/UT178 in collaboration with Mahidol University/CVVD). Trappings were set up in different ecosystems to broadly sample murine rodents’ diversity, invest their morphology and taxonomy, and identify ecological indicators of their distribution. In 2004, complementary interviews were conducted in Phrae province regarding Bandicoot rats’ ecology, distribution, and dynamics. The study area, centered on Phrae province, is located in the Central– Northern part of Thailand between longitude 99.5 E and 100.2 E and between latitude 17.5 N and 18.3 N. The topography comprises forested highland areas, with a North–South alignment, separated by large flood plains. Drastic changes in land use have occurred with the agricultural development, boosted by the construction of several reservoirs to irrigate lowland areas, and a continuous deforestation in the highland area that officials could slow down but have failed to stop. Phrae City, located by the side of Mae Yom River in the large flood plain, is one of the most frequently flooded localities in Thailand. Regarding the price of data as a recurrent limiting factor in the choice of images, we carried out our research using only free data and tools, searching for the highest quality and relevance. We integrated, managed, and processed data using SavGIS, a GIS freeware under development by IRD (http://www.savgis.com), offering beyond GIS capabilities, integrated tools for RS. A TERRA EOS AM-1 (Earth Observing System) ASTER (Advanced Spaceborne Thermal Emission and Reflection Radiometer) image from the March 7, 2003 was acquired, for free, from the United States Geological Survey website (http://eros.usgs.gov/products/satellite.html).With a 15-m spatial resolution and 14 bands available, ASTER images are suitable for describing the land use on a large scale (small extent). Only three bands, in the green, red, and near-infrared electromagnetic spectrum portions were acquired, to use the specificities of high reflectance of vegetation in near-infrared wavelengths. They were merged and arranged in a false color composition, for an easier distinction of vegetation density and activity (FIG. 2). Elevation data for Thailand were obtained from the international project Shuttle Radar Topography Mission (SRTM), providing a worldwide Digital Elevation Model (DEM), accessible via the Internet (http://srtm.usgs.gov/). Data points are located every 3-arc second (approximately 90 m) on a latitude/ longitude grid. These data points were interpolated for the whole country, using SavGIS, and directly integrated into the GIS database (FIG. 3).
FIGURE 2. TERRA ASTER image. Phrae, Thailand 07/03/03 (False-color composition).
Vegetation indices (VIs) are calculations of reflectance values in different spectral portions helping to quantify the abundance and vigor of vegetation. While the NDVI is the most commonly used in health applications, there are nearly two dozen others. Most are ratios of a near-infrared and red bands, considering the proprieties of high reflectance for vigorous vegetation in nearinfrared spectral portion.20,21 In the present study, we used two different VIs (NDVI and SAVI)
as described below. NDVI, introduced by Rouse et al.,22 is a ratio-based index, ranging between
–1.0 and +1.0, with vegetation having positive values: NDVI = (NIR − R)/(NIR + R)
with NIR = value of pixel in near-infrared band, R = value of pixel in Red band.
NDVI is a differential index for active vegetation, that is, forests or fields with a dense cover. Bare fields with some spontaneous vegetation or fields with little vegetation coverage are hardly separated. To minimize the effects of soil, Huete incorporated a soil adjustment factor (L) in the NDVI formula and proposed the soil-adjusted vegetation index (SAVI)23,24:
FIGURE 3. Digital elevation model (SRTM, 90 m).
SAVI = [(1 + L) × (NIR − R)]/(NIR + R + L)
This correction factor is determined by the relative coverage of vegetation and color of soil. For this study, L was given a value of 1 for bare soils and emergent crops, 0.5 for an intermediate stage, and 0 to get the NDVI values for dense vegetation cover. Then, NDVI and SAVI are combined to separate the range of coverage, from sparse to dense, which can be found in a same area in tropical countries.
RESULTS
There were 1718 murine rodents, belonging to 30 different species, trapped between January 1998 and December 2004, in Northern, Northeastern, and Central Thailand, representative of the great biodiversity. B. indica constitutes 13.5% (232 specimens) of the total murine rodents trapped during this period. This ratio should not be interpreted in terms of abundance because of the multiple biases inherent in the trapping method. Of the species trapped, 55.9% were males, showing the active behavior of males going hunting while females protect the nest and litter after birth. B. indica was exclusively found during sampling in the lowland rice fields, especially abundant after harvests, digging burrows on the edge of fields. Sixty B. savilei (3.5% of total murine rodents) were trapped during the same period. Here again, the smaller number of B. savilei trapped, compared to B. indica, does not reflect any reality in the density of both species but the biases in trapping methods. Half of B. savilei specimens come from the mountains of Phrae province, where it has been a major agricultural pest since maize production has
increased, replacing mung beans and other crops, in the foothills of the mountains. These fields provide dry habitats for B. savilei, with a seasonal but abundant source of food.
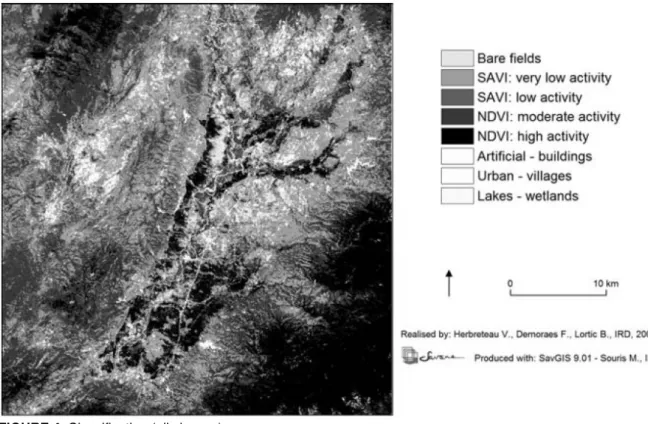
FIGURE 4. Classification (all classes).
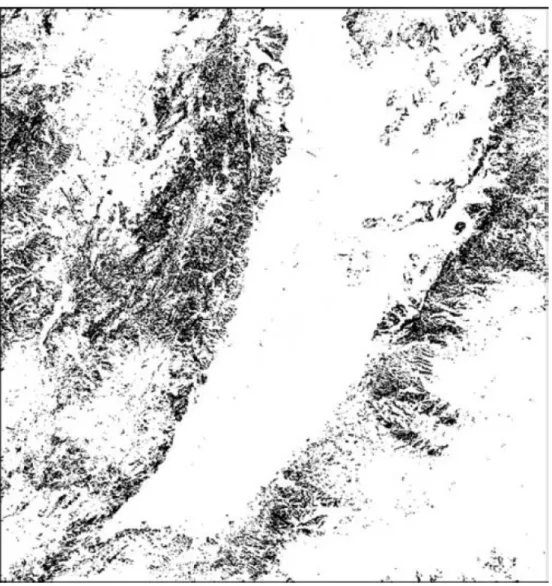
The supervised classification (FIG. 4) helps to separate what represent the human settlements, the city of Phrae, the villages, some large isolated buildings, and the main roads. Regarding the distribution of Bandicoot rats, the extent and structure of human settlements are a first indicator, considered as attractive for B. indica. Lakes andwetlands are also accurately extracted from optical satellite images. In the central flood plain, fields with no vegetation were classified as bare lands. Difficulties lie in distinguishing different vegetation covers, stages of cultivation, and agricultural practices, especially artificial flooding. The calculation of SAVI with an L-value equal to 0 (then SAVI = NDVI), first showed active vegetation. Two classes were isolated, based on ground proof: high activity: NDVI > 185, and moderate activity: 170 < NDVI < 185 (these values are stretched from 0 to 255 to use the full color range for the output map). These areas correspond to highland forests and rice fields in the lowland flood plain. With an L-value equal to 1, also two classes were identified: very low activity: 165 < SAVI < 195 and low activity: 195 < SAVI < 215, with the result that the first class corresponds to the previously described B. savilei habitat, that is, field areas, in the foothills of the mountains, in transition between lowland rice fields and highland forests, where corn fields have been replacing forests. The two classes group together, in lowland areas, agricultural fields, and sparse vegetations, where B. indica can occasionally be found. VIs give similar values for lowland rice fields and highland forests, both characterized by a dense cover. This common limitation of RS, when only based on reflectance values, was solved by using the topography derived from the SRTM DEM. Rice field areas, only found in the large flood plain where B. indica occurs, correspond to fields with a very low slope. The slope was calculated from the DEM and almost flat areas (with slopes <2 ) were delineated (FIGS. 5 and 6). In these lowland areas, high vegetation reflectance is classified as rice field instead of forests. Otherwise, high reflectance values with a slope greater than 2 were classified as forested areas.
FIGURE 5. NDVI + SAVI in lowlands.
The potential distribution of B. indica, present in the large flood plain, corresponds to both “NDVI high activity” and “SAVI very low activity” classes, within the lowland areas, while the potential distribution of B. savilei is delimited by the “SAVI low activity” class. Maps of potential distribution were generated from these results (FIGS. 7 and 8).
FIGURE 6. NDVI + SAVI in highlands.
DISCUSSION
Location-based data set integrated in a GIS are useful for RS analyses, illustrating with this example the need of GIS software directly integrating RS tools. VIs, based on reflectance values, show variations in the vegetation intensity but are not fully appropriate to differentiate the types of vegetation. Indeed, in the classified image, the same NDVI values can be attributed to both rice fields and forests. This is the reason why other RS techniques, such as texture or pattern discrimination processes, or other GIS queries, such as the merging of RS results with slopes or elevation as described above, should be used in complement. The use of RS in tropical countries has a main restriction with the scarcity of exploitable satellite images during the rainy season when the widespread cloud cover makes the ground not observable from the sky. As a result, observations are generally conducted during the dry season, limiting the analysis of seasonal changes. However, radar sensors, emitting and recording radiations with a longer wavelength (from 1 mm to 1 m), provide images that can be used all through the year, with a particular interest for tropical diseases presenting a peak of incidence during the rainy season.14 Access to
low-cost but high-resolution images should increase for higher relevance in health studies. The
emergence of web-based satellite images browser, after Google Earth_ initiative
(http://earth.google.com/), which allows visualization for free, of worldwide images at medium or even very high resolutions, is a new hope for health geographers, seeking such an easy access to images but with different bands for RS analysis.
FIGURE 7. Potential distribution of B. indica.
Mapping the potential distribution of rats is a first step for pin-pointing areas in which a risk of transmission of rodent-borne disease is likely to occur. Future investigations should focus on the validation of these expected rodent distribution maps through a higher number of trappings. Knowing the habitats of murine transmitting pathogens is useful for both animal and human health in order to define prevention and vector control campaigns.
FIGURE 8. Potential distribution of B. savilei.
ACKNOWLEDGMENTS
We thank Bernard Lortic (IRD-UR029) for his precious help in image processing, Jean-Paul Cornet (IRD-UR178) and Jean-Louis Janeau (IRDUR176/ IWMI-SEA, Bangkok) for their continuous support all through this research.We also thank Arthorn Boonsaner (National Park,Wildlife and Plant Conservation Department, Thailand, Bangkok), Narissara Chatwatcharakul (IWMI-SEA, Bangkok), Wasana Khaungaew, and Primporn Moungthong (Ministry of Public Health, Phrae provincial office) for their assistance. This research was supported by the Institut de Recherche pour le Développement (IRD) Research Unit UT178 “Fundamentals and Domains of Disease Emergence” and the program _Usages des Sols et Sédiments: Impacts Sanitaires_ for field investigations.
REFERENCES
1. GATRELL,A. 1999. GIS and health: from spatial analysis to spatial decision support. In Geographic
Information Research: Trans-Atlantic Perspectives. M. Craglia & H. Onsrud, Eds.: 143–158. Taylor and Francis. London.
2. ELLIOTT, P. & D. WARTENBERG. 2004. Spatial epidemiology: current approaches and future challenges.
Environ. Health Perspect. 112: 998–1006.
3. BAKER, R.D. 2004. Identifying space-time disease clusters. Acta Trop. 91: 291–299.
4. TATEM, A.J., M. BAYLIS MELLOR, et al. 2003. Prediction of bluetongue vector distribution in Europe and
north Africa using satellite imagery. Vet. Microbiol. 7: 13–29.
5. CAPELA, R., B.V. PURSE, I. PENA, et al. 2003. Spatial distribution of Culicoides species in Portugal in
relation to the transmission of African horse sickness and bluetongue viruses. Med. Vet. Entomol. 17: 165– 177.
6. PURSE, B.V., A.J. TATEM, et al. 2004. Modelling the distributions of Culicoides bluetongue virus vectors in
Sicily in relation to satellite-derived climate variables. Med. Vet. Entomol. 18: 90–101.
7. BAYLIS, M., H. BOUAYOUNE, et al. 1998. Use of climatic data and satellite imagery to model the abundance
of Culicoides imicola, the vector of African horse sickness virus, in Morocco. Med. Vet. Entomol. 12: 255– 266.
8. WINT, G.R.W., T.P. ROBINSON, et al. 2002. Mapping bovine tuberculosis in Great Britain using
environmental data. Trends Microbiol. 10: 441–444.
9. MC KENZIE, J.S., R.S. MORRIS, et al. 2002. Application of remote sensing to enhance the control of wildlife
associated Mycobacterium bovis infection. Photogrammetric Eng. Rem. S68: 153–159. 10. FREIER, J.W. 1993. Eastern equine encephalomyelitis. Lancet 342: 1281–1283.
11. MONCAYO, A.C., J.D. EDMAN & J.T. FINN. 2000. Application of geographic information technology in
determining risk of eastern equine encephalomyelitis virus transmission. J. Am. Mosq. Control 16: 28–35. 12. GLEISER, R.M., G. SCHELOTTO&D.E. GORLA. 2002. Spatial pattern of abundance of the mosquito,
Ochlerotatus albifasciatus, in relation to habitat characteristics. Med. Vet. Entomol. 16: 364–371.
13. GLASS, G.E., J.E. CHEEK, J.A. PATZ, et al. 2000. Using remotely sensed data to identify areas at risk for
hantavirus pulmonary syndrome. Emerging Infect. Dis. 6: 238–247.
14. HERBRETEAU, V., G. SALEM, M. SOURIS, et al. 2005. Sizing up health through remote sensing: uses and
misuses. Parassitologia 47: 63–79.
15. PHULSUKSOMBATI, D., W. TANGKANAKUL, et al. 1999. Isolation of leptospires from wild rodents in Thailand,
1998. J. Health Sci. (Thai.) 8: 360–369.
16. TANJATHAM, S., W. KHAUNGAEW & D. BOONYOD. 2003. Serological survey on Leptospira in animals and
patients, Prae province. J. Health Sci. (Thai.) 12: 265–272.
17. BOONSONG, L., J.A. MCNEELY & J.T. MARSHALL. 1988. Mammals of Thailand. Association for the
Conservation of Wildlife. Bangkok.
18. CHAIMANEE, Y. 1998. Plio-Pleistocene Rodents of Thailand. Biodiversity Research and Training Program,
National Center for Genetic Engineering and Biotechnology. Bangkok.
19. APLIN, K.P., P.R. BROWN, J. JACOB, et al. 2003. Field methods for rodent studies in Asia and the
Indo-Pacific. ACIAR Monograph No. 100, ACIAR, Canberra.
20. JACKSON, R.D. & A.R. HUETE. 1991. Interpreting vegetation indices. Prev. Vet. Med. 11: 185–200.
21. TUCKER, C.J. 1979. Red and photographic infrared linear combinations for monitoring vegetation.
Remote Sens. Environ. 8: 127–150.
22. ROUSE, J.W., R.H. HAAS, et al. 1973. Monitoring vegetation systems in the great plains with ERTS. Third
ERTS Symposium, NASA SP-351. 1: 309–317.
23. HUETE, A.R., R.D. JACKSON&D.F. POST. 1985. Spectral response of a plant canopy with different soil
backgrounds. Remote Sens. Environ. 17: 37–53.