HAL Id: hal-00396294
https://hal.archives-ouvertes.fr/hal-00396294
Submitted on 17 Jun 2009
HAL is a multi-disciplinary open access
archive for the deposit and dissemination of
sci-entific research documents, whether they are
pub-lished or not. The documents may come from
teaching and research institutions in France or
abroad, or from public or private research centers.
L’archive ouverte pluridisciplinaire HAL, est
destinée au dépôt et à la diffusion de documents
scientifiques de niveau recherche, publiés ou non,
émanant des établissements d’enseignement et de
recherche français ou étrangers, des laboratoires
publics ou privés.
Using a trace-based simulation tool to test the efficiency
of error codes applied to wireless multimedia streaming
Julien Bourgeois, Adrien Henriet, Jérôme Lacan, Tanguy Pérennou
To cite this version:
Julien Bourgeois, Adrien Henriet, Jérôme Lacan, Tanguy Pérennou. Using a trace-based simulation
tool to test the efficiency of error codes applied to wireless multimedia streaming. EUROMEDIA’
05 : Workshop on Distributed Multimedia Databases and Multimedia Adaptation - WDMDMA, Apr
2005, Toulouse, France. p.173-177. �hal-00396294�
Using a trace-based simulation tool to test the efficiency of error codes applied to wireless
multimedia streaming
Julien Bourgeois, Adrien Henriet
Laboratoire d’Informatique de l’Universit´e de Franche-Comt´e (LIFC) Centre de D´eveloppement Multim´edia
25201 Montb´eliard Cedex, France
{Julien.Bourgeois, Adrien.Henriet}@univ-fcomte.fr
Jerome Lacan, Tanguy P´erennou ENSICA-LAAS,
1, place Emile Blouin, 31056 Toulouse cedex 5 {jerome.lacan, tanguy.perennou}@ensica.fr
Abstract
This article presents an original method to validate the ef-ficiency of the short length maximum separable distance forward error codes when using broadcasting mode in 802.11b/g multimedia streaming. Our method is based on real traces on which the forward error code will be mapped. Then, the quality of the streaming is evaluated by calculating the Peak Signal-to-Noise Ratio (PSNR).
KEYWORDS
Multimedia, FEC, error codes, simulation, wireless, stream-ing
Introduction
The development of wireless networks bandwidth is chang-ing the way to access to multimedia contents. WiFi, also known as 802.11b/g, is the most popular local wireless net-work. WiFi can communicate according to two modes: point to point and broadcast. Point to point communications offer reliability by ensuring retransmission of lost packets. The lost packets retransmission is managed by the MAC layer of 802.11b/g. When using broadcasting mode, the MAC layer does not manage retransmission of lost packets. Therefore, in a video streaming session, errors will occur and video qual-ity will decrease. In this article, we propose to evaluate the benefit of using adaptive Forward Error Code (FEC) by cal-culating the Peak Signal-to-Noise Ratio (PSNR) of the trans-mitted videos. This experiment based on real traces ensures a result very close to the reality.
In the following section , we present conventional error con-trol mechanisms. Section , discusses the efficiency of short-length MDS FEC. This efficiency is calculated using real ex-periments that generate traces. Simulations use these traces to obtain results. Section concludes the article and describes future work to be done.
Conventional Error Control Mechanisms
In order to ensure packets transmission reliability, two essen-tial types of mechanisms can be distinguished [3] :
• reactive mechanisms (ARQ: Automatic Repeat re-quest): when a packet is lost, the transmitter retransmits
it. The packet loss indication can be carried out by the emission of positive or negative acknowledgments. • proactive mechanisms (FEC: Forward Error
Correc-tion): the transmitter sends redundancy packets a priori, making it possible for the receiver to recover certain lost packets thanks to the redundancy packets. These pack-ets are usually calculated by using block error correcting codes. These codes generate n − k redundancy packets starting from a set of k information packets (to be pro-tected) so that the receiver can recover the k information packets as soon as it has received a sufficient number of packets among all the sent packets.
It should be pointed out that these two mechanisms are often combined by using acknowledgments to adjust the quantity of redundancy of FEC codes. Such a combination is often called Hybrid ARQ of type I (packets already received by the receiver are not combined with redundancy packets received after the retransmission request) or of type II (all packets that relate to the same block of k packets are used by the decoder). Being relatively flexible and easy to implement, reactive mechanisms are the most used in packet transmissions (in TCP for example). Proactive mechanisms are particularly used in multicast transmissions (where a redundancy packet allows to compensate for the loss of a different packet for each of the receivers). In addition, real-time transmissions which do not allow delays due to retransmissions, often use proactive mechanisms.
In the context considered here, i.e. real-time multicast video transmissions, the use of FEC is clearly the best solution. Two main families of FEC can be distinguished: the Maxi-mum Separable Distance (MDS) codes and the Low-Density Parity-Check (LDPC) ones. The MDS codes, often based on Reed-Solomon codes, have the property that the information packets can be recovered as soon as any k packets among the n sent ones are received. However, for long lengths (n > 500), these codes, which have quadratic encoding and decoding complexities, become too costly in CPU. On the other hand, LDPC codes have linear complexity and then can be used with long lengths [4, 7]. However, they need more received packets (between 5 and 20% [6]) than MDS ones to recover the information packets, especially for short codes. A strong constraint on FEC used for real-time transmissions is that they must have a short length. Indeed, the decoder
must necessarily wait the reception of the last packets to be-gin the decoding. Then it appears that the FEC codes which must be considered here are short-length MDS codes. Next Sections present an evaluation of these codes.
Evaluating the short-length MDS FEC efficiency
To evaluate the efficiency of FEC codes, and extremely im-portant point is to consider a realistic representation of the channel in terms of packet loss rate and losses distribution. Even if some modeling of the 802.11 channel losses were already proposed (see e.g. [8] ), we preferred consider real traces to evaluate the codes.
Experiments
A platform of wireless tests was installed in order to col-lect IP broadcast packets loss measurements. It relies on an 802.11b infrastructure mode network, which comprises one access point, 10 nodes with an 802.11b interface, and one node with an Ethernet interface, directly connected to the access point. Various types of 802.11b interfaces (PCI, USB and PCMCIA) and material architectures (PC, laptop PC, Pocket PC) were used.
Methodology
First, a serie of 5 experiments was carried out during which all the nodes remained motionless. The nodes were placed at various places, with a distance of 0 to 4 walls with the access point. In a second series of 6 experiments, 4 of the nodes were mobile: each one was carried by an operator walking without a specified trajectory while always remaining in the range of the access point.
In each experiment, the fixed node pacman transmits a multicast MPEG1/RTP video-only stream, which consisted of 300 to 1400 bytes packets with a mean bandwidth of 500kbps. Each experiment is approximately 90 seconds long. The video stream is produced by the Java Media Studio application and is broadcasted in multicast on the wireless network. The transmitter is fixed in all of the experiments and remains close to the access point, with a minimal atten-uation of the signal on the corresponding link. The result-ing MAC packets are automatically re-emitted by the access point towards 9 nodes over the wireless network, and 1 node over the Ethernet.
Thus, each experiment made it possible to record the se-quence numbers of the RTP packets actually received by each receiver. In 802.11b, there is no acknowledgement nor retransmission in the MAC layer for broadcasted pack-ets [1]. Hence, a received UDP packet was transmitted only once from the transmitter towards the access point and then towards the receivers. By making the assump-tion that no packet is lost on the Ethernet, the Ethernet re-ceiver serveur-mitv allows the measurement of MAC losses over the uplink between the transmitter and the access point, the wireless receivers allowing to measure the addi-tional MAC losses over the downlink.
Results
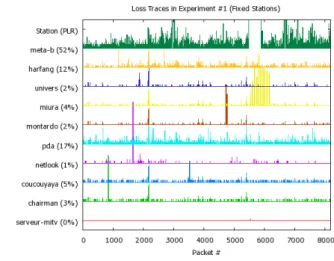
Figure 1. Traces of packets loss with fixed sta-tions
Figure 2. Traces of packets loss with mobiles stations
The 5 experiments, where all the nodes were fixed, produced similar traces, just as the 6 experiments with mobile nodes. We can see here that the mobility isn’t a significant factor who influate in packet lost. Figures 1 and 2 gives the traces of one of the experiments with fixed stations and one with mobile stations (pda,miura,montardoandharfang). The x-axis corresponds to the sequence of transmitted pack-ets and the y-axis illustrates the burstiness of packet losses for each station. The receiving stations are listed on the left. The percentage given after the station name is the packet loss rate observed for this station in this experiment. Each line indicates if packet #x was received (lowest position) or lost (higher positions) by the corresponding station. Loss
bursts are represented by their length along the y-axis. To get an idea of the length of the bursts, consider that station loss lines are 10 losses apart. In experiment #1 for example,
serveur-mitvdoes not lose any packet, which results in a straight line. In contrastnetlookexperiences a big burst of 32 packets starting at packet #1645 and a few other less important bursts: this results in an almost straight line with a high peak for the 32-packet long burst and a few smaller peaks corresponding to bursts of 1, 2, 3 or 5 packets. Finally,
pda experiences a lot more loss bursts (255 bursts have a length greater than 1, generally 2, 3, 4, or 5 packets long), which results in a very irregular line. The ten receiving sta-tions are classified on the y-axis from the nearest to the most distant with respect to the access point, except formeta-b
which is close to the access point but receives few packets due to hardware limitations.
The experiments show that practically no data is lost on the uplink, and that many losses are observed on the downlink. They are related to the used material, the position of the fixed receiver or to mobility. Some simultaneous bursts attest the occurrence of important disturbances on the downlink, which could not be diagnosed. The peaks of very important ampli-tude recorded onmeta-breveal a disconnection phase due to a hardware configuration problem.
More generally, a considerable quantity of packets are lost in bursts, which can be temporally correlated for a given re-ceiver and/or spatially correlated for several rere-ceivers. The peaks observed for each individual receiver of Figure 2 de-note temporal correlation. Spatial correlation can be ob-served too when peaks occur for the same packets, as in e.g. experiment #1 for packets #2168 to #2088, which are simul-taneously lost by all stations except serveur-mitvand
netlook. An analysis of these correlations can be found in [5].
Simulation driven by traces
To evaluate the efficiency of the FEC codes applied to a video sequence, one solution is to count the ratio between well-received and losts packets. If this solution can show the the-oritical efficiency of the FEC codes, it does not show the real efficiency of the FEC codes applied to a video sequence. The idea is to calculate the PSNR of the received video. Indeed of the methodology, and the type of trace, we can’t know the size of each packet, and so, can’t have a more realistic sim-ulation based not only on packet, but on data. This isn’t a limitation, because of the structure is the same, and be rela-tively near a real situation.
Methodology
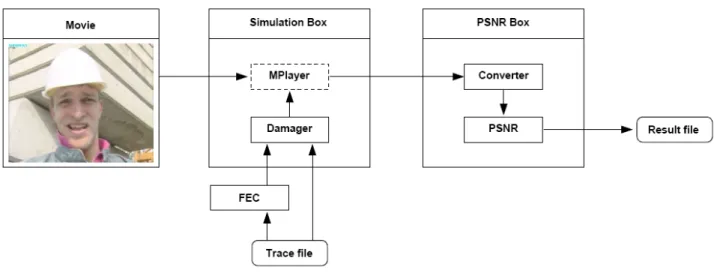
As described in figure 3, our simulation tool takes two inputs: a movie and the experiment trace file described in section . The movie is the Foreman, a reference sequence for testing multimedia platform. The aim of our tool is to compute the PSNR of the movie when packets are lost according to the trace file. This PSNR represents the available quality for the client for each decoded frame of the stream. Indeed, during
multimedia streaming the lost packets will not have the same effect on the video quality. Some packets will seriously affect the visual quality of the video whereas others will not. This difference depends on various parameters like the kind of lost packet, the moment in the group of pictures (GOP) the packet is lost, etc. In fact, if the last P-frame of a GOP is lost, the quality will not be affected because, just after this image, an intra image will be decoded. As the last P-frame of a GOP and the first I-frame of the following GOP do not have any temporal dependances, only one frame will be damaged. An another example is when a packet is lost on an P-frame just before a camera movement. The resulting image will be damaged but the camera movement will delete this error. That is why it is necessary to calculate the PSNR and not just to count the lost packets to evaluate the resulting video quality.
Our simulation tool can compute the PSNR with or without the short-length MDS FEC. In fact, it can apply any kind of processing on the packets. Our simulation tool is composed of two main boxes: the Simulation Box and the PSNR Box. The Simulation Box is composed of mplayer an open-source movie player and the Damager which is able to alter the pack-ets transmitted by mplayer. The Damager does not randomly alter the packets, it takes as input the trace file generated in section . When a packet is generated in mplayer, the Dam-ager alters it or not according to the trace file. It can also take an error code information into account. Here, we use our short-length MDS FEC as a plugin for the Damager. This plugin modifies the trace file by correcting the lost packets when it is possible.
The PSNR Box receives only images, not packets. MPlayer receives packets and generates Portable Network Graphic (PNG) images. These images are then gathered by the PSNR Box which converts them into a raw format and then com-putes the PSNR. The output of our simulation tool is a text file which contains the PSNR for each generated image. Results
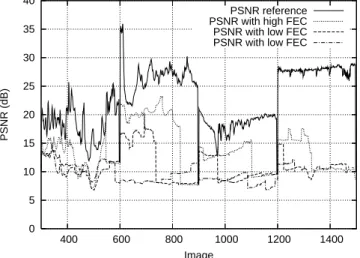
The three figures 4, 5 and 6 show the PSNR of the movie Foreman visualized respectively by the client “coucouyaya”, “meta-b” and “harfang” in the mobile environment. Strong or light FECs represent the minimum size of the redundancy information in the code. The solid curve represents the PSNR of video sequence without any errors. The dotted curve shows the PSNR calculated when strong FECs are applied to the packets whereas the dashed curve presents the PSNR calculated when light FECs are applied to the packets. The dotted-dashed curve shows the PSNR of the transmission without error codes.
“Coucouyaya” receives the packets with few errors, that is why the three curves, PSNR with strong FECs, light FECs and without FECs are very close. The interesting thing to see is that the use of strong codes or light codes when there are no long bursts of errors is nearly equivalent.
“Meta-b” and “harfang” have nearly the same error profile: lots of errors, and long bursts of errors. For these station, it is clear that the FECs enhance the visual quality of the video.
Figure 3. The simulation tool
But, when the bursts are too long, even the strong FECs can not correct the errors and retreiving the original content of the packets. This, is the second interesting fact taught by these experiments.
Thanks to these results, we can say that even strong FECs can not cope with long bursts as the stream will be interrupted. Strong FECs delay the interruption but do not avoid it. The second fact is that when there are no long bursts, light FECs are sufficient. As the strong codes need a lot more bandwidth than the light ones, the idea is to preferably use them. But, the problem of long bursts remains. Solutions will be inves-tigated later.
Conlusion and perpectives
We have presented our method to test the efficiency of the short length maximum separable distance forward error codes. Our simulation tool is able to calculate the quality of any streamed video by using trace files of previous transmis-sion. The results show that the FECs can not cope with long bursts of error. They can delay the error but at last, the video quality will dramatically decrease.
Future works will have to deal with this problem. The idea we will have to experiment is the following. Light FECs are kept to deal with short bursts of error and an RTP mixer [2] capable of regenerating an I-frame is adding between the server and the clients to overcome the long bursts of error. When a interruption occurs, the RTP mixer will transform a P-Frame into a I-Frame, and then the video can continue thanks to this new GOP. With this mixed solution (reactive and proactive), the bigger part of the errors will be treated without adding too much traffic on the wireless channel.
REFERENCES
[1] ANSI/IEEE Std 802.11. Wireless LAN MAC and PHY
0 5 10 15 20 25 30 35 40 400 600 800 1000 1200 1400 PSNR (dB) Image PSNR reference PSNR with high FEC PSNR with low FEC PSNR without FEC
Figure 4. PSNR computation for coucouyaya
fications, 1999.
[2] J. Bourgeois, E. Mory, and F. Spies. Video transmission adapta-tion on mobile devices. Journal of Systems Architecture, 49(10-11):475–484, November 2003.
[3] S. Lin and D. Costello, Jr. Error Control Coding:
Fundamen-tals and Applications. Prentice Hall, Englewood Cliffs, NJ.,
1983.
[4] M. Luby, M. Mitzenmacher, M. A. Shokrollahi, and D. A. Spielman. Efficient erasure correcting codes. IEEE
Transac-tions on Information Theory, 47(2):569–584, 2001.
[5] T. Perennou, J. Lacan, and H. Elnatour. ´evaluation de m´ecanismes de contrˆole d’erreur pour des transmissions multi-points sur des r´eseaux de mobiles. TSI, To appear in 2005. [6] J. S. Plank and M. G. Thomason. A practical analysis of
low-density parity-check erasure codes for wide-area storage appli-cations. In DSN-2004: The International Conference on
0 5 10 15 20 25 30 35 40 400 600 800 1000 1200 1400 PSNR (dB) Image PSNR reference PSNR with high FEC PSNR with low FEC PSNR with low FEC
Figure 5. PSNR computation for metab
0 5 10 15 20 25 30 35 40 400 600 800 1000 1200 1400 PSNR (dB) Image PSNR reference PSNR with high FEC PSNR with low FEC PSNR without FEC
Figure 6. PSNR computation for harfang
[7] V. Roca, Z. Khallouf, and J. Laboure. Design and evaluation of a low density generator matrix (ldgm) large block fec codec. In Fifth International Workshop on Networked Group
Commu-nication (NGC’03), Munich, Germany, September 2003.
[8] C. Tang and P. McKinley. Modeling Multicast Packet Losses in Wireless LANs. In Proceedings of MSWiM’03, 2003. [9] Mplayer: open source movie player for Linux