HAL Id: hal-00275330
https://hal.archives-ouvertes.fr/hal-00275330
Submitted on 23 Apr 2008
HAL is a multi-disciplinary open access
archive for the deposit and dissemination of
sci-entific research documents, whether they are
pub-lished or not. The documents may come from
teaching and research institutions in France or
abroad, or from public or private research centers.
L’archive ouverte pluridisciplinaire HAL, est
destinée au dépôt et à la diffusion de documents
scientifiques de niveau recherche, publiés ou non,
émanant des établissements d’enseignement et de
recherche français ou étrangers, des laboratoires
publics ou privés.
Performance evaluation of reactive and proactive
routing protocol in IEEE 802.11 ad hoc network
Salima Hamma, Eddy Cizeron, Hafiz Issaka, Jean-Pierre Guédon
To cite this version:
Salima Hamma, Eddy Cizeron, Hafiz Issaka, Jean-Pierre Guédon. Performance evaluation of reactive
and proactive routing protocol in IEEE 802.11 ad hoc network. ITCom 06 - next generation and
sensor networks, Oct 2006, Boston, United States. pp.638709, �10.1117/12.686251�. �hal-00275330�
Performance evaluation of reactive and proactive routing
protocol in IEEE 802.11 ad hoc network
Salima Hamma & Eddy Cizeron & Hafiz Issaka & Jean-Pierre Gu´
edon
Institut de Recherche en Communications et en Cybern´
etique de Nantes
Rue Christian Pauc BP 50609 44306 Nantes cedex 3 France
[email protected]; [email protected]
[email protected]; [email protected]
ABSTRACT
Wireless technology based on the IEEE 802.11 standard is widely deployed. This technology is used to support multiple types of communication services (data, voice, image) with different QoS requirements. MANET (Mobile Adhoc NETwork) does not require a fixed infrastructure. Mobile nodes communicate through multihop paths. The wireless communication medium has variable and unpredictable characteristics. Furthermore, node mobility creates a continuously changing communication topology in which paths break and new one form dynamically. The routing table of each router in an adhoc network must be kept up-to-date. MANET uses Distance Vector or Link State algorithms which insure that the route to every host is always known. However, this approach must take into account the adhoc networks specific characteristics: dynamic topologies, limited bandwidth, energy constraints, limited physical security, ... Two main routing protocols categories are studied in this paper: proactive protocols (e.g. Optimised Link State Routing - OLSR) and reactive protocols (e.g. Ad hoc On Demand Distance Vector - AODV, Dynamic Source Routing - DSR). The proactive protocols are based on periodic exchanges that update the routing tables to all possible destinations, even if no traffic goes through. The reactive protocols are based on on-demand route discoveries that update routing tables only for the destination that has traffic going through. The present paper focuses on study and performance evaluation of these categories using NS2 simulations. We have considered qualitative and quantitative criteria. The first one concerns distributed operation, loop-freedom, security, sleep period operation. The second are used to assess performance of different routing protocols presented in this paper. We can list end-to-end data delay, jitter, packet delivery ratio, routing load, activity distribution. Comparative study will be presented with number of networking context consideration and the results show the appropriate routing protocol for two kinds of communication services (data and voice). Keywords: performance evaluation, routing protocol, simulation, mobility.
1. INTRODUCTION
Mobile adhoc networks remove dependence on a fixed network infrastructure by treating every available mobile node as an intermediate router. So they became useful in emergency searches and rescue operations, meet-ings or conventions in which sharing information is quickly done. To do so, specific routing algorithms are needed. MANET communication protocols must take into account the adhoc network features. They should have lightweight computational and information storage need because wireless devices usually use low capacity, processors, memory, i/o devices). In section 2, we summarize the main protocols studied in this paper. In section 3, we describe the simulation model and specify in particular the traffic and mobile node mobility models used in to simulate adhoc network behavior. We also define in the same section the performance criteria used to study adhoc routing algorithms. The section 4 illustrates the impact of traffic load, mobile node mobility and network density on the performance of both proactive and reactive routing protocols. Finally, we conclude by given an appropriate protocol for a given communication services (e.g. voice and data).
2. ADHOC ROUTING PROTOCOLS
Conventional networks typically rely on distance vector or link state algorithms in which periodic advertisements are sent in order to allow all routers to keep routing tables up-to-date. Using these algorithms which ensure that the route to every host is always known, presents several problems. First, periodically updating the network topology increases bandwidth overhead. Secondly, repeatedly awakening hosts to receive and send information quickly exhaust batteries. Then, communication systems often cannot respond quickly enough to dynamic changes in network topology. Two main routing protocols categories are studied in this paper: reactive protocols and proactive protocols.
2.1. Reactive protocols
Reactive protocols or on-demand routing protocols rather than relying on periodical broadcasts of available routes, discover routes as needed, build and maintain routes. In this case, route to every mobile is not known at any given time. Two different protocols are studied: DSR (Dynamic Source Protocol) and AODV (Adhoc On-demand Distance vector).
2.1.1. DSR
DSR is a simple algorithm based on the concept of source routing4
: Source nodes determine routes dynamically and only as needed. A source node that wants to send a packet must check its route cache. If there is a valid entry for the destination, the node sends the packet using that route. If no valid route, the source node initiates the route discovery process: it first send a special route request (RREQ) packet to all neighboring nodes and then propagate through the network collecting the address of all nodes visited until it reaches the destination node or intermediate node with a valid route to the destination node. This node initiates the route reply process: it sends a special route reply RREP packet to the source node providing the sequence of all node through which a packet will travel. This algorithm includes also a route maintenance process. Each host sends a route error (RERR) packet if it encounters a broken link. DSR is easily implemented and thus can work with asymmetric links and involves no overhead when there are no changes in the network. Furthermore, it can be improved to support multiple routes from the source to destination. Nevertheless, large bandwidth overhead inherent in source routing. Each route cache collects the addresses of all visited nodes and the RREQ packet can become huge. So, the acceptable network’s diameter and its scalability are limited.
2.1.2. AODV
A source node that wants to send a message to a destination for which it does not have a route, broadcasts a request RREQ packet. All nodes receiving this packet update their information for the source node and maintain only the next hop’s address in a routing table. A RREQ packet contains the source node’s address, broadcast ID, current sequence number and the most recent sequence number of the destination node. The response packet RREP is sent by either the destination or a node that has a route to the destination with the sequence number greater than or equal to the sequence number in the RREQ packet. The route is established once the source node receives the RREP. AODV algorithm includes route maintenance facilities. When a link is broken, the related node sends a RERR message to the neighboring nodes using that route. The main advantage of AODV compared to DSR is the reduced bandwidth due to smaller control and data packet. This algorithm has also good scalability because it needs only two addresses: destination and next hop. However, it works with symmetric links and does not allow for multipath routing. So, new routes must be discovered when a link breaks down.6
2.2. Proactive protocols
Proactive protocols exploit the periodic exchange of control messages between routers ensuring that the route to every host is always known. This needs high bandwidth overhead. Adhoc Link state routing algorithm attempts to conserve bandwidth by reducing both the size and the number of control messages. OLSR (Optimized Link-State Routing) is the proactive protocol we have studied in this paper.
2.2.1. OLSR
OLSR optimizes classic link state routing algorithm in which each node declares all links with neighboring nodes and floods the entire network with routing messages. OLSR protocol uses only multipoint relay nodes (MPR). So, each node maintains a table of MPR selectors and rebroadcast packets received from the originating node (MPR). Periodically, each node broadcasts ”hello messages” and selects minimal subset MPR among one-hop neighbors (with symmetric link) to cover all nodes two hops away.3
3. SIMULATION MODEL
3.1. The traffic model
In this paper we focus on Constant Bit Rate (CBR) sources (i.e voice sources) and ftp sources (i.e file transfer). The packet size is limited to 512 bytes. The source-destination pairs are chosen randomly over the network. The source-destination numbers are fixed (called connection number). We make the offered load vary by using scenarios with 10,20,30,40,50 and 60 connections. Each source-destination pair begins packet sending at a chosen time and keeps sending between 40 and 80s for CBR sources and between 5 and 20 for ftp sources.
3.2. The mobility models
In this study, we focus on two mobile node mobility models to simulate their movement.2
First of them is the Proba Walk mobility model. This model uses a probability matrix to determine the node new position. Three states are used in order to determine the next position. state 0 represents the current value x or y, state 1 represents the previous x or y position and state 2 represents the mobile node next position if the mobile moves in the same direction. Each node moves using an average speed and four possible directions (ie., north, south, east, or west). The Proba Walk model gives more realistic behaviors compared to random movements. The second mobility model is the Modified Random Direction model which was created to avoid the clustering mobile node near the center of the simulation area. This behavior occurs in the random waypoint mobility direction.2 In the Modified Random Direction mobility model, each mobile node chooses a random direction and travels over a random distance at a random speed to it. After being arrived, it pauses for a specific time and then chooses a new direction. If it reaches the edge of the simulation area, it bounces.
3.3. Architectural scenarios
Some parameters are used in order to make performance evaluation of routing protocols in adhoc mobile network environnement. They are resumed in the following table: In order to simulate adhoc network with a minimum
parameters CBR traffic ftp traffic
node number 125,150,175,200,225,250,275 125,150,175,200,225,250,275
field size (m) 1100 1100
simulation duration (s) 180 180 number of connection 10,20,30,40,50,60 10,20,30,40,50,60
Mac Layer IEEE 802.11 IEEE 802.11 communication range (m) 100 100
min transfer duration (s) 40 5 max transfer duration (s) 80 20 input rate per connexion (Kb/s) 8 64
Table 1.The mean CBR and ftp parameters
number of node’s neighbors, we choose 125 as the minimum node number. The average number of neighbor nodes (N H) is given by the following equation:
N H= πR 2
C2 N − 1 (1)
where R is the communication range, C is value of the field side and N is the total node number. N H is equal to 4.19 for N equal to 200.
3.4. Performance criteria
Five important performance metrics are evaluated:
• packet delivery ratio: the ratio of the data packets delivered to the destination to those generated by CBR or ftp sources.
• mean end-to-end delay: mean end-to-end delay related to data packets delivered to destination.
• routing load: gives the number of routing packets over the number of received data packets. Each routing packet sent or forwarded by a mobile is counted.
• jitter: gives the transmission delay variation. • activity distribution (A): is calculated as follow: P
N−1 i=0 1 N − Pi where Pi= ni P jnj
is the probability that the mobile node i make a sending or forwarding action. Pi=
1
N while all nodes are working (N is a mobile node number). A = 0 means that all mobile nodes fairly work.
4. RESULTS AND DISCUSSIONS
Several simulations are performed using NS2 network simulator5
and using parameters shown in table 1. NS2 generates a big trace files analysed using a statistical tools developed in java. The performance study concerns three routing protocols DSR, AODV and OLSR described in the second section and both CBR and ftp traffic sources.
4.1. Impact of traffic load
We propose here to study the impact of traffic load by varying the number of connections (pair of source-destination). The following figures show performance evaluation of AODV, DSR and OLSR protocols related to 10, 20, 30, 40, 50 and 60 connections and 200 mobile nodes. In1
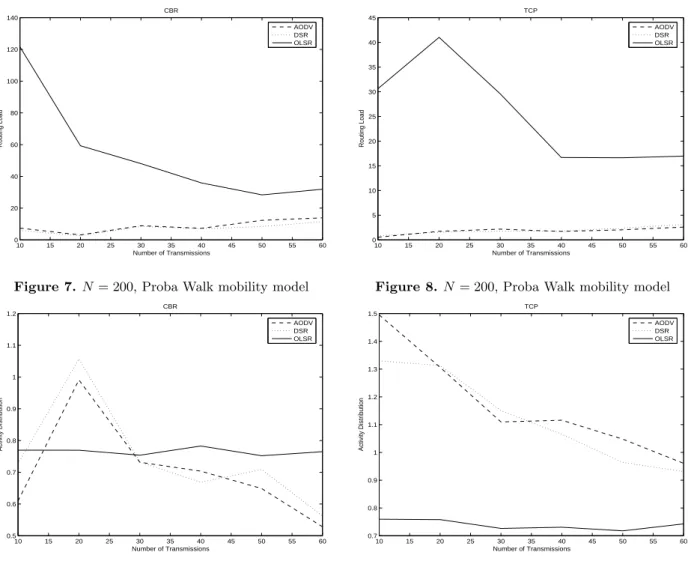
authors show that the mobility models may drastically affect protocol performances. So, using the Proba Walk mobility model was conducted by study walker scenarios aim in this part of a paper. We first observe in figure 1 that AODV outperform DSR and OLSR for packet delivery ratio (3 to 5% compared to OLSR) and also routing load criteria as shown in figure 7 (between 4 and 12 times lower). As shown in figures 3 and 5, OLSR performs better and gives little variation when the traffic load increases. Until 30 connections, all studied routing protocols perform identically but when the traffic load increases, OLSR performs better for delay and jitter. However, routing load is higher (see figures 7 and 8) because it periodically sends routing packets in order to maintain the routing table up-to-date. In CBR sources as well as in ftp sources, the OLSR activity distribution is constant (figures 9 and 10). As shown in figures 2,4 and 6, DSR seems to produce higher percentage of data packets for ftp sources even if it produce higher delay and jitter. We also observe packet delivery ratio higher (about 98%) compared to CBR sources because ftp uses TCP protocol which insures packets retransmission when dropped.
4.2. Impact of mobile node mobility
In order to study the impact of the node mobility against adhoc routing protocols, we have pitched on the Modified Random Direction mobility. The mean feature of the model is travelling on all simulation area which avoiding nodes centralization in a specific zone. Some parameters related to this model are resumed in table 2.
parameters values step interval (m) [50, 100] speed interval (m/s) [2, 15]
pause time (s) 0, 5, 10, 15, 20, 25
10 15 20 25 30 35 40 45 50 55 60 30 35 40 45 50 55 Number of Transmissions Delivery Ratio (%) CBR AODV DSR OLSR
Figure 1. N = 200, Proba Walk mobilitymodel
10 15 20 25 30 35 40 45 50 55 60 97 97.5 98 98.5 99 99.5 100 Number of Transmissions Delivery Ratio (%) TCP AODV DSR OLSR
Figure 2. N = 200, Proba Walk mobility model
10 15 20 25 30 35 40 45 50 55 60 0 0.2 0.4 0.6 0.8 1 1.2 1.4 1.6 1.8 Number of Transmissions Delay (s) CBR AODV DSR OLSR
Figure 3. N = 200, Proba Walk mobility model
10 15 20 25 30 35 40 45 50 55 60 0.1 0.15 0.2 0.25 0.3 0.35 0.4 0.45 0.5 0.55 0.6 Number of Transmissions Delay (s) TCP AODV DSR OLSR
Figure 4. N = 200, Proba Walk mobility model
10 15 20 25 30 35 40 45 50 55 60 0 0.05 0.1 0.15 0.2 0.25 0.3 0.35 Number of Transmissions Jitter (s) CBR AODV DSR OLSR
Figure 5. N = 200, Proba Walk mobility model
10 15 20 25 30 35 40 45 50 55 60 0.01 0.02 0.03 0.04 0.05 0.06 0.07 0.08 0.09 Number of Transmissions Jitter (s) TCP AODV DSR OLSR
10 15 20 25 30 35 40 45 50 55 60 0 20 40 60 80 100 120 140 Number of Transmissions Routing Load CBR AODV DSR OLSR
Figure 7. N = 200, Proba Walk mobility model
10 15 20 25 30 35 40 45 50 55 60 0 5 10 15 20 25 30 35 40 45 Number of Transmissions Routing Load TCP AODV DSR OLSR
Figure 8. N = 200, Proba Walk mobility model
10 15 20 25 30 35 40 45 50 55 60 0.5 0.6 0.7 0.8 0.9 1 1.1 1.2 Number of Transmissions Activity Distribution CBR AODV DSR OLSR
Figure 9. N = 200, Proba Walk mobility model
10 15 20 25 30 35 40 45 50 55 60 0.7 0.8 0.9 1 1.1 1.2 1.3 1.4 1.5 Number of Transmissions Activity Distribution TCP AODV DSR OLSR
Figure 10. N = 200, Proba Walk mobility model The figure 11 show the small increases of packet delivery ratio when the mobility decreases (pause time increases between 10 and 20). However, we show in figures 17 and 18 an important decreases of routing load (about 50% for OLSR). The best performance is given by the AODV protocol because it need lowest routing load for routes discovery. The most important criteria for real-time services is delay and jitter. So, OLSR gives better performance results compared to both DSR and AODV (figures 13 and 15). The files transfer are delay sensitive while the packet delivery ratio criteria is much more important QoS. In this case, DSR and AODV seems to be quite identical (see figures 11, 13 and 15).
4.3. Impact of network density
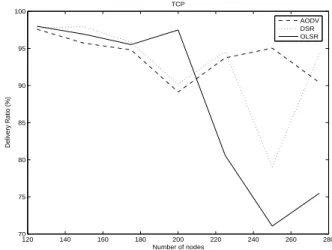
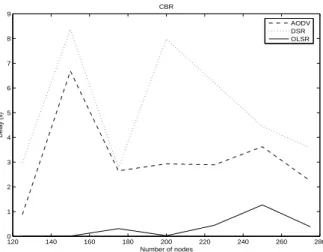
In this section, we investigate the impact of network density on the adhoc routing protocols. This criteria is simulated varying the number of network nodes between 125 to 275. In this study, we used the Modified Random Direction model. The first observation concerns OLSR which is the best running protocol for voice services (i.e CBR sources). The packet delivery ratio, delay and jitter are the lowest but the routing ratio is highest (figures 19, 21, 23 and 25. It also seems that the network density (i.e number of nodes) in OLSR has no impact on the packet delivery ratio and mean delay criteria while routing ratio increases with the number of nodes . In reactive routing protocols (i.e DSR and AODV), the packet delivery ratio increases when the density of network increases (see figure 19). One plausible reason is the mobile node has a greater probability to find routes to a destination when the number of neighbors increases (when N increases, see equation (1)). In addition, proactive
0 5 10 15 20 25 5 10 15 20 25 30 35 40 Pause time Delivery Ratio (%) CBR AODV DSR OLSR
Figure 11.40 connections, Modified Random Direction mobility model 0 5 10 15 20 25 89 90 91 92 93 94 95 96 97 98 Pause time Delivery Ratio (%) TCP AODV DSR OLSR
Figure 12.40 connections, Modified Random Direction mobility model 0 5 10 15 20 25 0 2 4 6 8 10 12 Pause time Delay (s) CBR AODV DSR OLSR
Figure 13.40 connections, Modified Random Direction mobility model 0 5 10 15 20 25 0 0.1 0.2 0.3 0.4 0.5 0.6 0.7 Pause time Delay (s) TCP AODV DSR OLSR
Figure 14.40 connections, Modified Random Direction mobility model 0 5 10 15 20 25 0 0.5 1 1.5 2 2.5 3 Pause time Jitter (s) CBR AODV DSR OLSR
Figure 15.40 connections, Modified Random Direction mobility model 0 5 10 15 20 25 0 0.05 0.1 0.15 0.2 0.25 Pause time Jitter (s) TCP AODV DSR OLSR
Figure 16.40 connections, Modified Random Direction mobility model
0 5 10 15 20 25 0 50 100 150 200 250 300 Pause time Routing Load CBR AODV DSR OLSR
Figure 17.40 connections, Modified Random Direction mobility model 0 5 10 15 20 25 0 10 20 30 40 50 60 70 80 90 100 Pause time Routing Load TCP AODV DSR OLSR
Figure 18.40 connections, Modified Random Direction mobility model
routing algorithm (i.e OLSR) produces lower delay and jitter (mean QoS for voice services). The figure 20 shows no impact of network density until number of nodes equal to 200. Over, packet delivered ratio linearly decreases until 250 nodes. In the same interval and as shown in figures 26 routing ratio increases which causes an important packet loss (about 30%). This is due to much greater number of nodes which is concerned with the routing table’s update. So, number of sending routing packets logically increases.
120 140 160 180 200 220 240 260 280 0 5 10 15 20 25 30 35 40 45 50 Number of nodes Delivery Ratio (%) CBR AODV DSR OLSR
Figure 19.20 connections, Modified Random Direction mobility model 120 140 160 180 200 220 240 260 280 70 75 80 85 90 95 100 Number of nodes Delivery Ratio (%) TCP AODV DSR OLSR
Figure 20.20 connections, Modified Random Direction mobility model
5. CONCLUSIONS
In this paper we have evaluated the performance of reactive (ie. DSR and AODV) and proactive (ie. OLSR) routing protocols in 802.11 adhoc network environment. We have noticed the proactive protocol (OLSR) offers better performances for CBR sources (eg. voice services) given that it guaranties lowest delay and jitter. However it consumes much more bandwidth. Periodically, OLSR protocol sends routing packets to discover and to maintain routes to all destinations. That’s why the number of delivered packets decreases when the traffic load (number of connections) increases. For 10 connections, the packet delivery ratio is about 53 %. The reactive routing protocols are more adapted for data services (file transfer). They guarantee a packet delivery ratio of 80 % for 60 connections (480 kbit/s). There is no clear winner among DSR and AODV since routing load, delay
120 140 160 180 200 220 240 260 280 0 1 2 3 4 5 6 7 8 9 Number of nodes Delay (s) CBR AODV DSR OLSR
Figure 21.20 connections, Modified Random Direction mobility model 120 140 160 180 200 220 240 260 280 0 0.1 0.2 0.3 0.4 0.5 0.6 0.7 Number of nodes Delay (s) TCP AODV DSR OLSR
Figure 22.20 connections, Modified Random Direction mobility model 120 140 160 180 200 220 240 260 280 0 0.5 1 1.5 2 2.5 3 Number of nodes Jitter (s) CBR AODV DSR OLSR
Figure 23.20 connections, Modified Random Direction mobility model 120 140 160 180 200 220 240 260 280 0 0.05 0.1 0.15 0.2 0.25 0.3 0.35 Number of nodes Jitter (s) TCP AODV DSR OLSR
Figure 24.20 connections, Modified Random Direction mobility model
120 140 160 180 200 220 240 260 280 0 500 1000 1500 Number of nodes Routing Load CBR AODV DSR OLSR
Figure 25.20 connections, Modified Random Direction mobility model 120 140 160 180 200 220 240 260 280 0 100 200 300 400 500 600 700 800 900 1000 Number of nodes Routing Load TCP AODV DSR OLSR
Figure 26.20 connections, Modified Random Direction mobility model
and jitter are quite identical. We have also pointed out the influence of the node mobility model on the adhoc routing protocols. In Proba Walk mobility, direction range is indeed more limited than in Modified Random Direction model.
REFERENCES
1. Fan Bai, Narayanan Sadagopan , Ahmed Helmy, ”The IMPORTANT framework for analyzing the Impact of Mobility on Performance Of RouTing protocols for Adhoc NeTworks”, INFOCOM, 2003.
2. Tracy Camp, Jeff Boleng, Vanessa Davies, ”A survey of mobility models for adhoc network research”, Wireless communications and mobile computing, volume 2, Issues 5, page 483-502, 2002.
3. T. Clausen, P. Jacquet, ”Optimized Link State Routing Protocol (OLSR)”, draft-ietf-manet-olsr-11.txt, july 2003.
4. David B. Johnson, David A. Maltz, Yih-Chun Hu, ”The Dynamic Source Routing Protocol for Mobile Ad Hoc Networks (DSR)”, draft-ietf-manet-dsr-10.txt, july 2004.
5. Network Simulator (NS2), http://www.isi.edu/nsnam/ns.
6. C. Perkins, E. Belding-Royer, S. Das, ”Ad hoc On-Demand Distance Vector (AODV) Routing”, draft-ietf-manet-aodv-13.txt, february 2003.
7. Zhenqiang Ye, Srikanth V. Krishnamurthy, Satish K. Tripathi, ”A framework for reliable routing in mobile adhoc networks”, infocom, 2003.